Running Userpilot vs Google Analytics: 4 SaaS Use Cases



Comparing Userpilot vs Google Analytics (GA4) isn’t about choosing one over the other. Many SaaS teams already use GA4 to track acquisition and conversions, but they also need to understand what drives adoption and retention.
My recommendation is to use both.
Userpilot offers product analytics to show how users behave after signup and help you improve their in-app experience based on what you learn. Combined with GA4’s web analytics data, it gives you a broader view of the customer journey.
Here’s how the two tools work across four use cases, where they complement each other, and when one is better suited to the job.
Executive summary
- Userpilot lets you track feature usage, visualize user paths, analyze funnels, and optimize retention. You can use session replays to find friction behind these patterns and launch in-app flows and checklists to address it.
- GA4 is built to answer how people arrive on your site or app, and whether they convert. Its reports on channels, campaigns, landing pages, and key events make it suitable for measuring acquisition.
- Together, they provide valuable insights to guide where your team invests: attracting more users, turning sign-ups into active customers, or both.
- The verdict: keep GA4’s traffic analytics and add Userpilot when your team needs product analytics and in-app engagement.
- GA4’s standard version is free. Userpilot’s Growth plan starts at $849/month and unlocks advanced product analytics, including custom dashboards and event autocapture.
Userpilot vs Google Analytics at a glance
| Category | Userpilot | Google Analytics 4 (GA4) |
|---|---|---|
| Primary focus | Product analytics and in-app engagement after signup | Web and app analytics for acquisition and conversion |
| Product analytics | No-code funnels, paths, retention cohorts, trends, and custom dashboards; event autocapture lets you label events without dev work (Growth plan and above) | Funnel, path, and cohort explorations, user lifetime, and user stickiness; usually needs custom events and registered custom dimensions |
| Traffic analytics | Focused on post-acquisition behavior (feature engagement, activation, product usage) instead of marketing attribution | Traffic acquisition, pages and screens, landing page reports, key events, and UTM campaign tracking |
| AI features | Lia (AI agent), MCP server for Claude, ChatGPT, Microsoft 365 Copilot, and Cursor, plus agent analytics add-on | Predictive metrics (with eligibility thresholds), anomaly detection, Analytics Insights, Ask Advisor (beta), and a read-only MCP server |
| Acting on insights | Session replays, in-app surveys, walkthroughs, checklists, spotlights, banners, resource center, and workflows on Growth plan and above | Real-time reports, form interaction events, and remarketing audiences via Google Ads; other tools needed to act in-app |
| Technical setup | Developer installs the script and identifies users; custom events optional | Engineering time to define and maintain events (for example via Google Tag Manager) for product behavior |
| Pricing | Starter from $299/month, Growth from $849/month, Enterprise custom | Free (standard); Analytics 360 is paid with no public pricing |
| Best for | Understanding what drives adoption and retention, and fixing friction in-app | Measuring how people arrive and whether they convert |
Userpilot vs GA 4 for product analytics
The notion that Google Analytics is only for marketing is false. GA4 can track in-app events and create funnel charts, user paths, cohorts, and user-lifetime analysis.
But these analyses often require more technical setup, and investigating feature adoption and retention can take additional configuration. For example, GA4 can track users who trigger specific events over time. But analyzing how repeated feature use relates to long-term retention may require defining relevant events and configuring cohort explorations to examine the patterns.
Userpilot takes a more product-focused approach. Its no-code analytics helps product managers analyze feature adoption, identify drop-offs, and explore how usage patterns relate to retention. And because it offers in-app guidance and surveys, you can act on these insights directly within the product.
What Userpilot tracks inside your product
Userpilot’s product analytics tools revolve around one goal: increasing adoption and growth.
So, our platform gives teams not only insights into feature usage but also ways to improve the product experience. This is how Userpilot analyzes in-product interactions:
- Path analysis: This report shows the sequence of actions before and after a specific event. It lets you track the “happy path” of power users and discover where dropped-off users tend to deviate.
- Event autocapture: Once autocapture is turned on (in settings on the web, in the SDK on mobile), Userpilot starts collecting clicks, text inputs, and form submissions, so you can start tracking feature usage right away. This way, you can label raw events as needed instead of working with devs to instrument every event on day one. For example, Amplemarket’s product team uses Userpilot’s no-code event tracking to label a new event in roughly 5–10 minutes, versus a two-week internal engineering process it previously used.
- Funnel analysis: Identifies conversion and drop-off between product events, such as activation tasks or feature adoption. Alternatively, you can ask Lia, our AI agent, to create and then analyze the report, surfacing what needs your attention and what actions to prioritize.
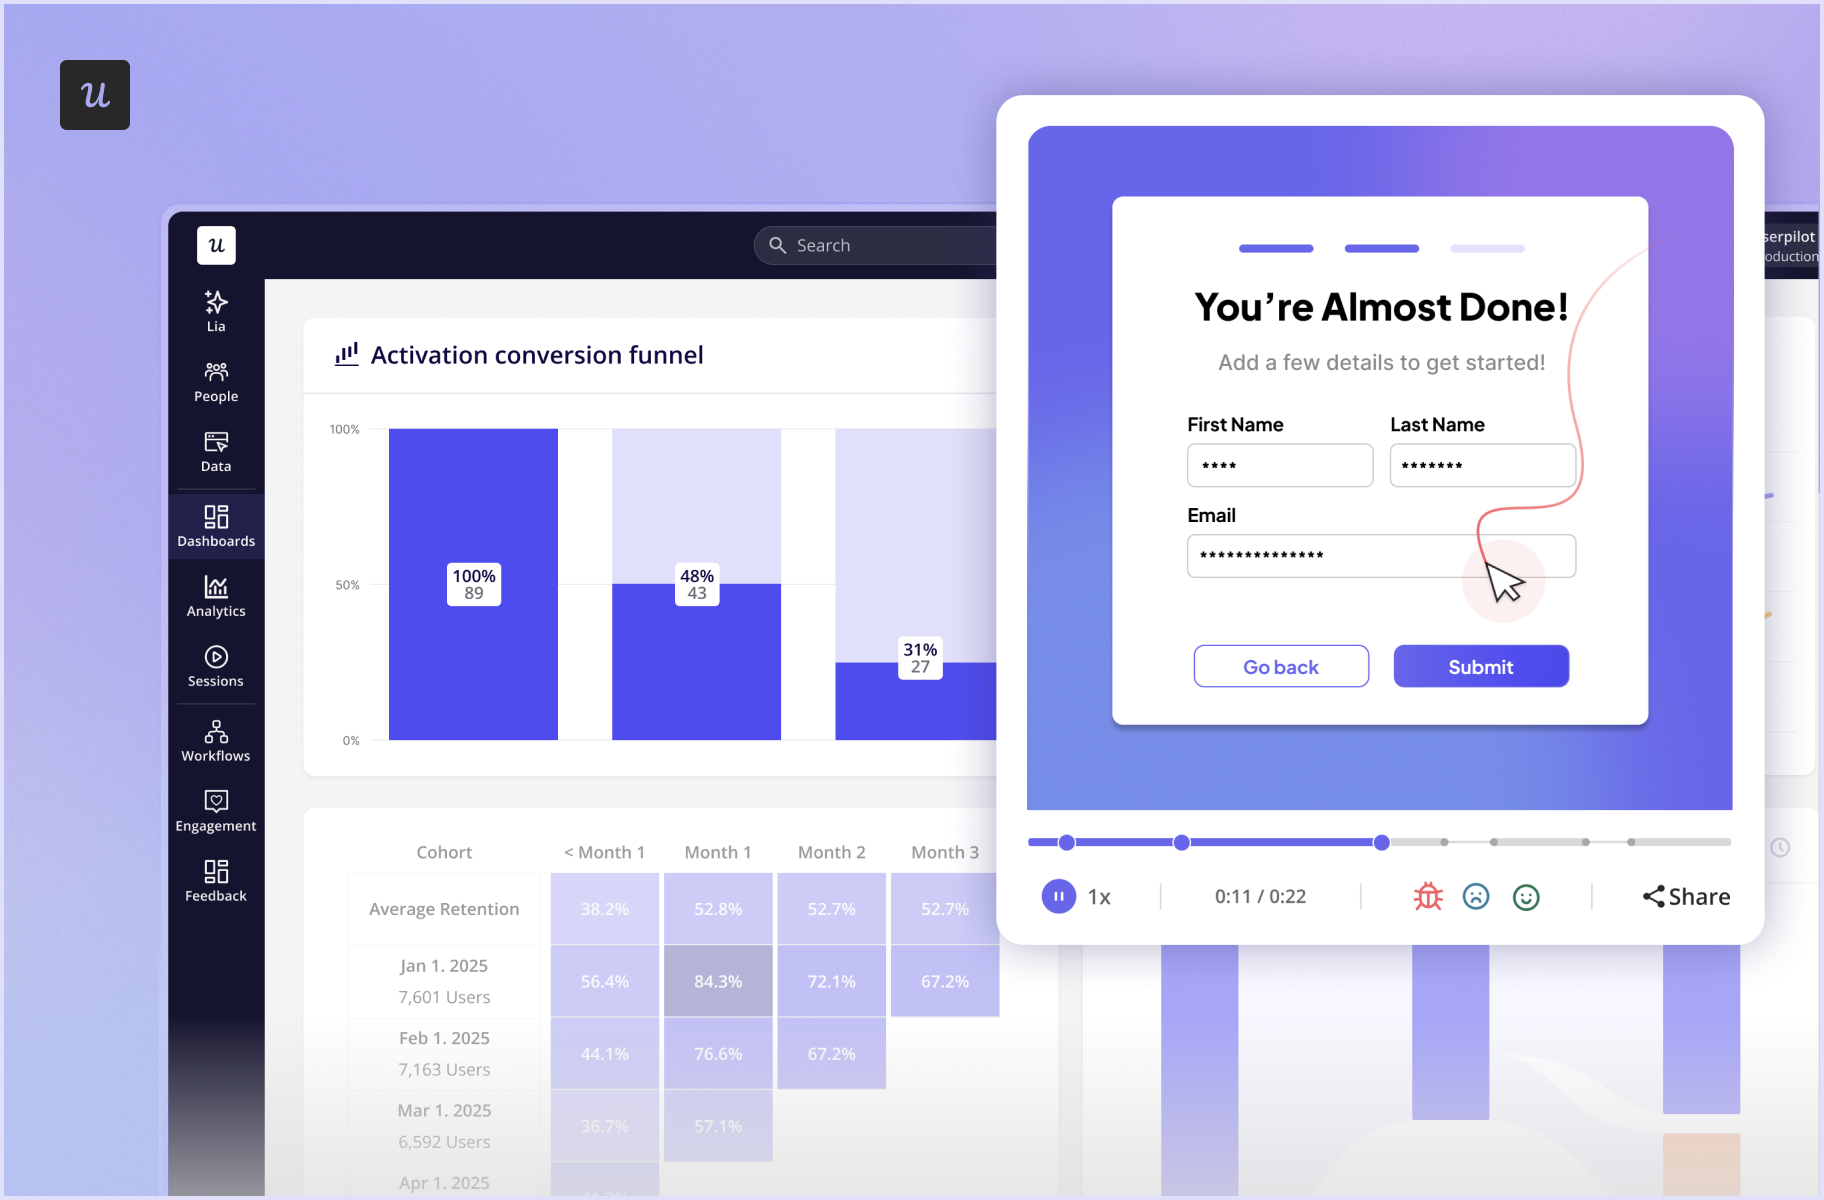
- Retention analysis (cohorts): This report groups users into cohorts (e.g., based on signup months) and tracks their retention over time. This lets you investigate cohorts with the lowest retention to identify potential causes of churn (such as a feature update or a bug).
- Custom dashboards and reports: Userpilot’s dashboards are customizable. You can create dedicated reports for feature and product adoption, or use the available templates if you prefer a predefined option.
- Trends: This standard chart shows trends over time for different events. It lets you spot dips in engagement for a specific feature or confirm whether adding an in-app guide improved a feature’s activation rate.
- Session replay: Once this is enabled, Userpilot records user sessions, so you can watch how users interact with different product elements. This tool also pairs well with other product analytics features like Funnels and Trends, helping you see where friction happens (e.g., users failing to use a promo code at checkout) and figure out your next steps.
What GA4 tracks inside your product (with additional setup)
Although Google Analytics isn’t dedicated to product analytics, it includes a solid set of features that can carry your team when you’re starting out.
If your engineering team has the capacity to configure a few custom events, you can maximize what GA4 has to offer:
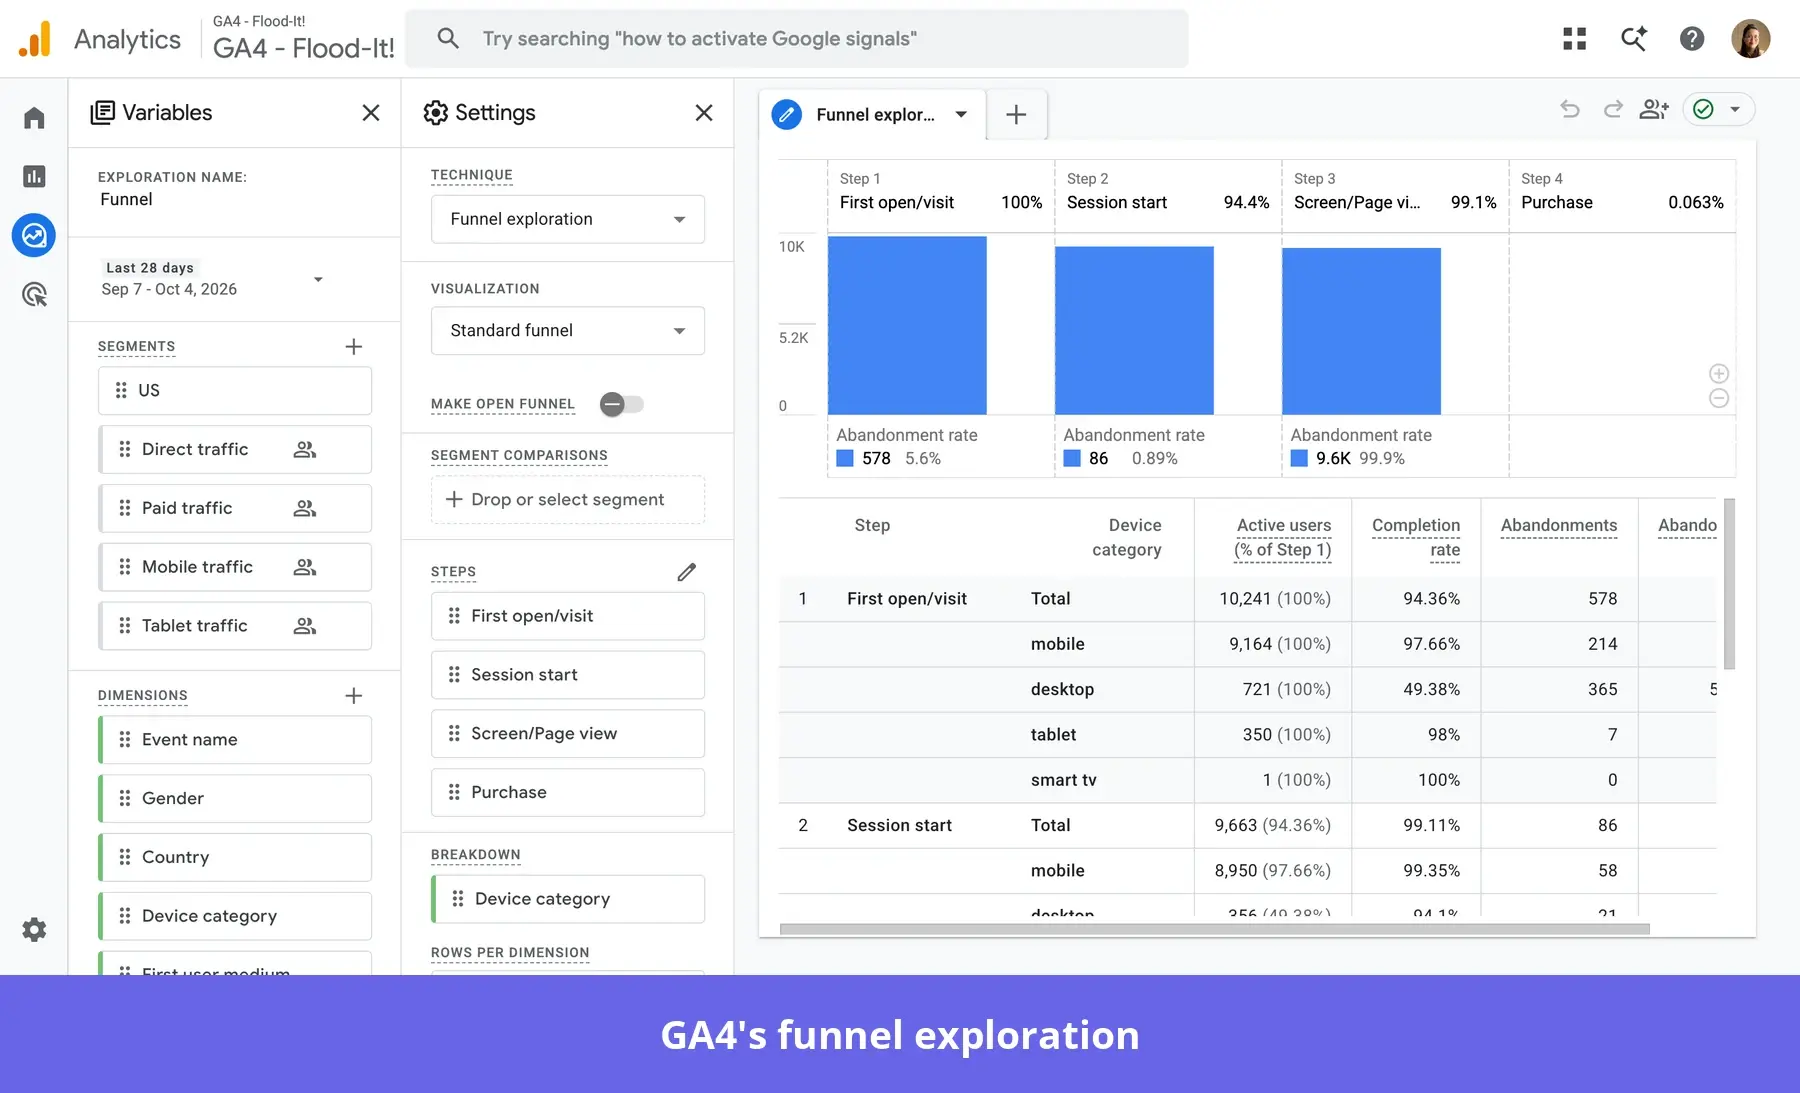
- Funnel exploration: GA4 lets you see where users tend to drop off. It supports open or closed funnels, conditions based on events/dimensions, and up to 10 funnel steps.
- Path exploration: GA4 can analyze event/page/screen sequences, even across sessions. It will break down the product journey for you so you can see where users go after signup or before an upsell.
- Cohort exploration: This feature tracks multiple user cohorts simultaneously. It lets you define the return event, such as a weekly purchase, that counts the user as retained.
- User lifetime: This tool analyzes behavior/value across the time someone remains a customer, including initial interaction, recent interaction, lifetime interaction, revenue/LTV, and predictive metrics. Combined with marketing attribution data, this chart shows you what campaigns led to higher LTV.
- User stickiness: This chart measures how many users engage consistently with your product over time. Depending on your product, this metric can be a leading indicator of user retention or churn.
- BigQuery: GA4 supports BigQuery export, with a 1 million-event limit for the daily batch export. So if you’re getting limited insights from GA4, you can query the same data in BigQuery via SQL.
Note: In GA4, analyzing by account means sending an account ID as a user property and registering it as a user-scoped custom dimension. For B2B products used by entire organizations, this makes account-level analysis more complex, especially when multiple users belong to the same account and their activity must be aggregated.
Userpilot vs GA4 for traffic analytics
Website traffic is the front GA4 was built for. It shows how people land, navigate, and convert inside your website before acquisition.
Userpilot, on the other hand, doesn’t track marketing performance. It’s built for tracking users after signup, through activation, product adoption, retention, and expansion.
With the Userpilot-Google Analytics integration, you can close the gap between marketing acquisition and product retention. It lets you send product experience data to GA4, so you can correlate in-app interactions with specific channels/campaigns and have a unified view of the whole user journey.
Userpilot for traffic analytics
You can create these dashboards on Userpilot to track “traffic” after acquisition:
- Feature engagement dashboards: Let you see what features are most visited/clicked, whether they use them successfully, and which ones are ignored. You can also filter the data by user segments or specific accounts to understand each persona’s feature needs.
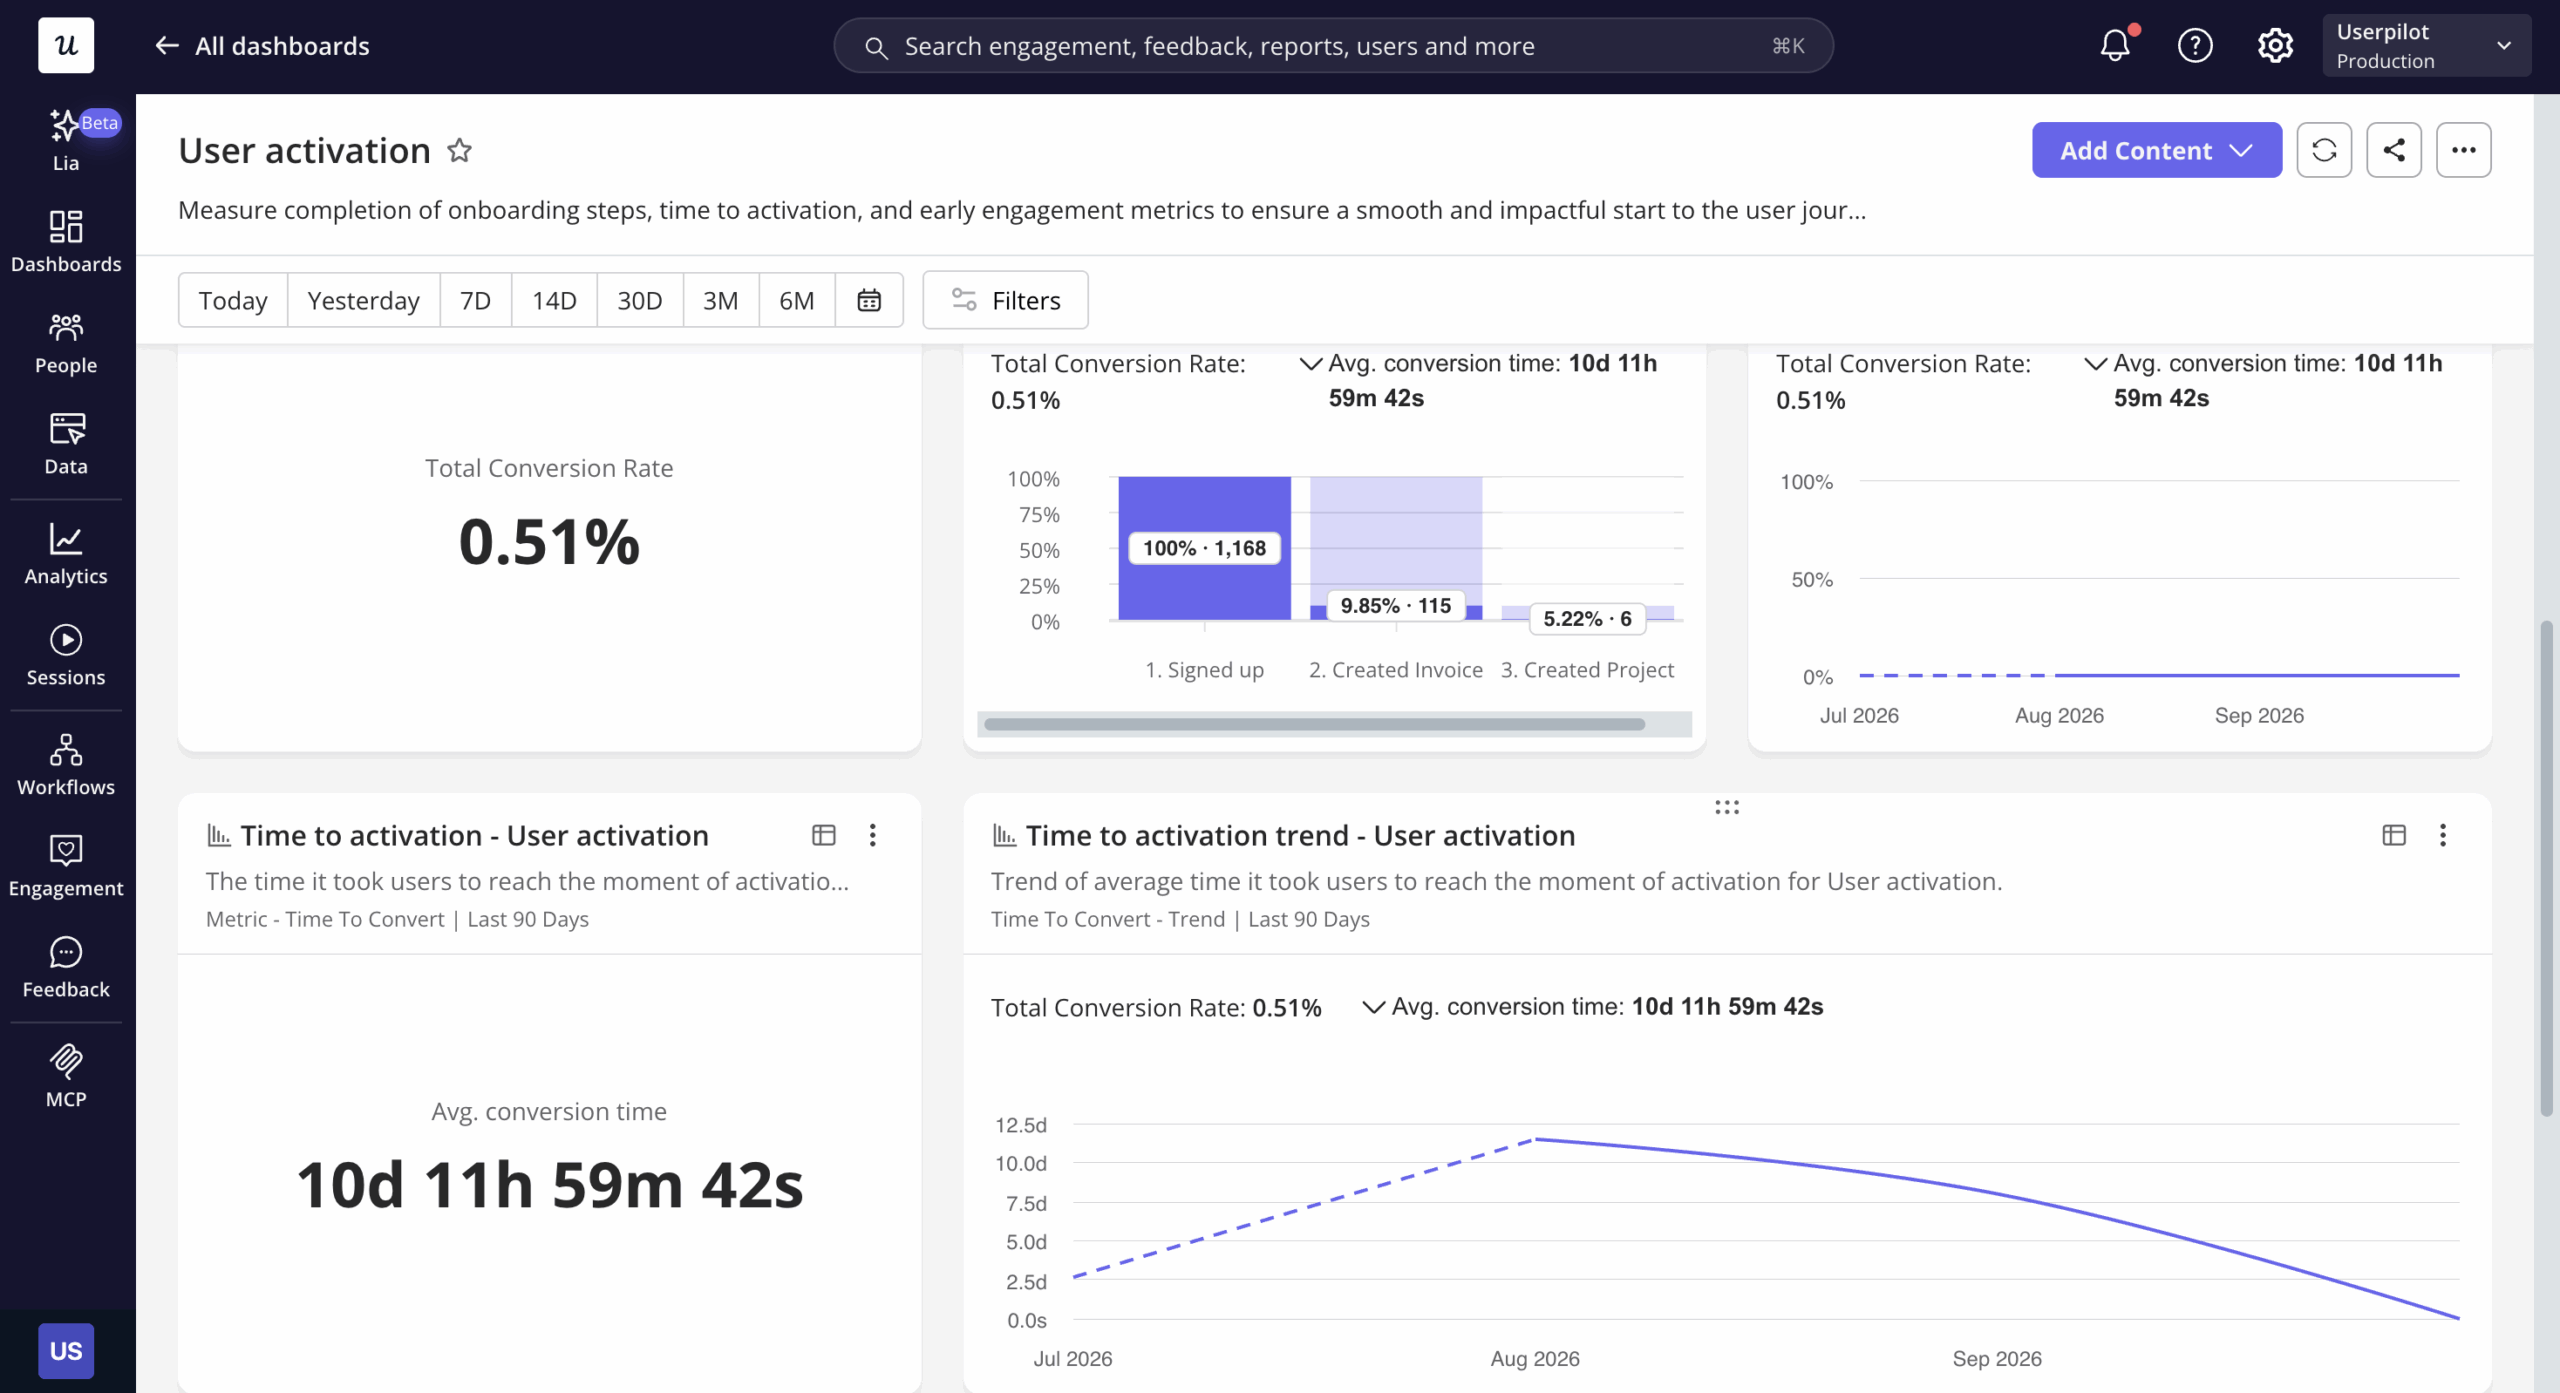
- Activation dashboard: It shows metrics that reflect how users behave from signup to the Aha! moment. You can see how many users reach the activation stage and how long it takes them to get there (time to activation).
- Product usage dashboard: Track active users and product stickiness (DAU/MAU) over time. This dashboard helps you establish the baseline for normal engagement with your product and track how each user persona uses it (e.g., admin users might use key features less often compared to invited users).
Google Analytics for traffic analytics
Although GA4 can track in-app events, its traffic analytics features focus more on marketing channels, campaigns, and landing pages and require less setup.
Now, even the default GA4 features are very expansive, so here’s a quick overview of how the platform tracks traffic:
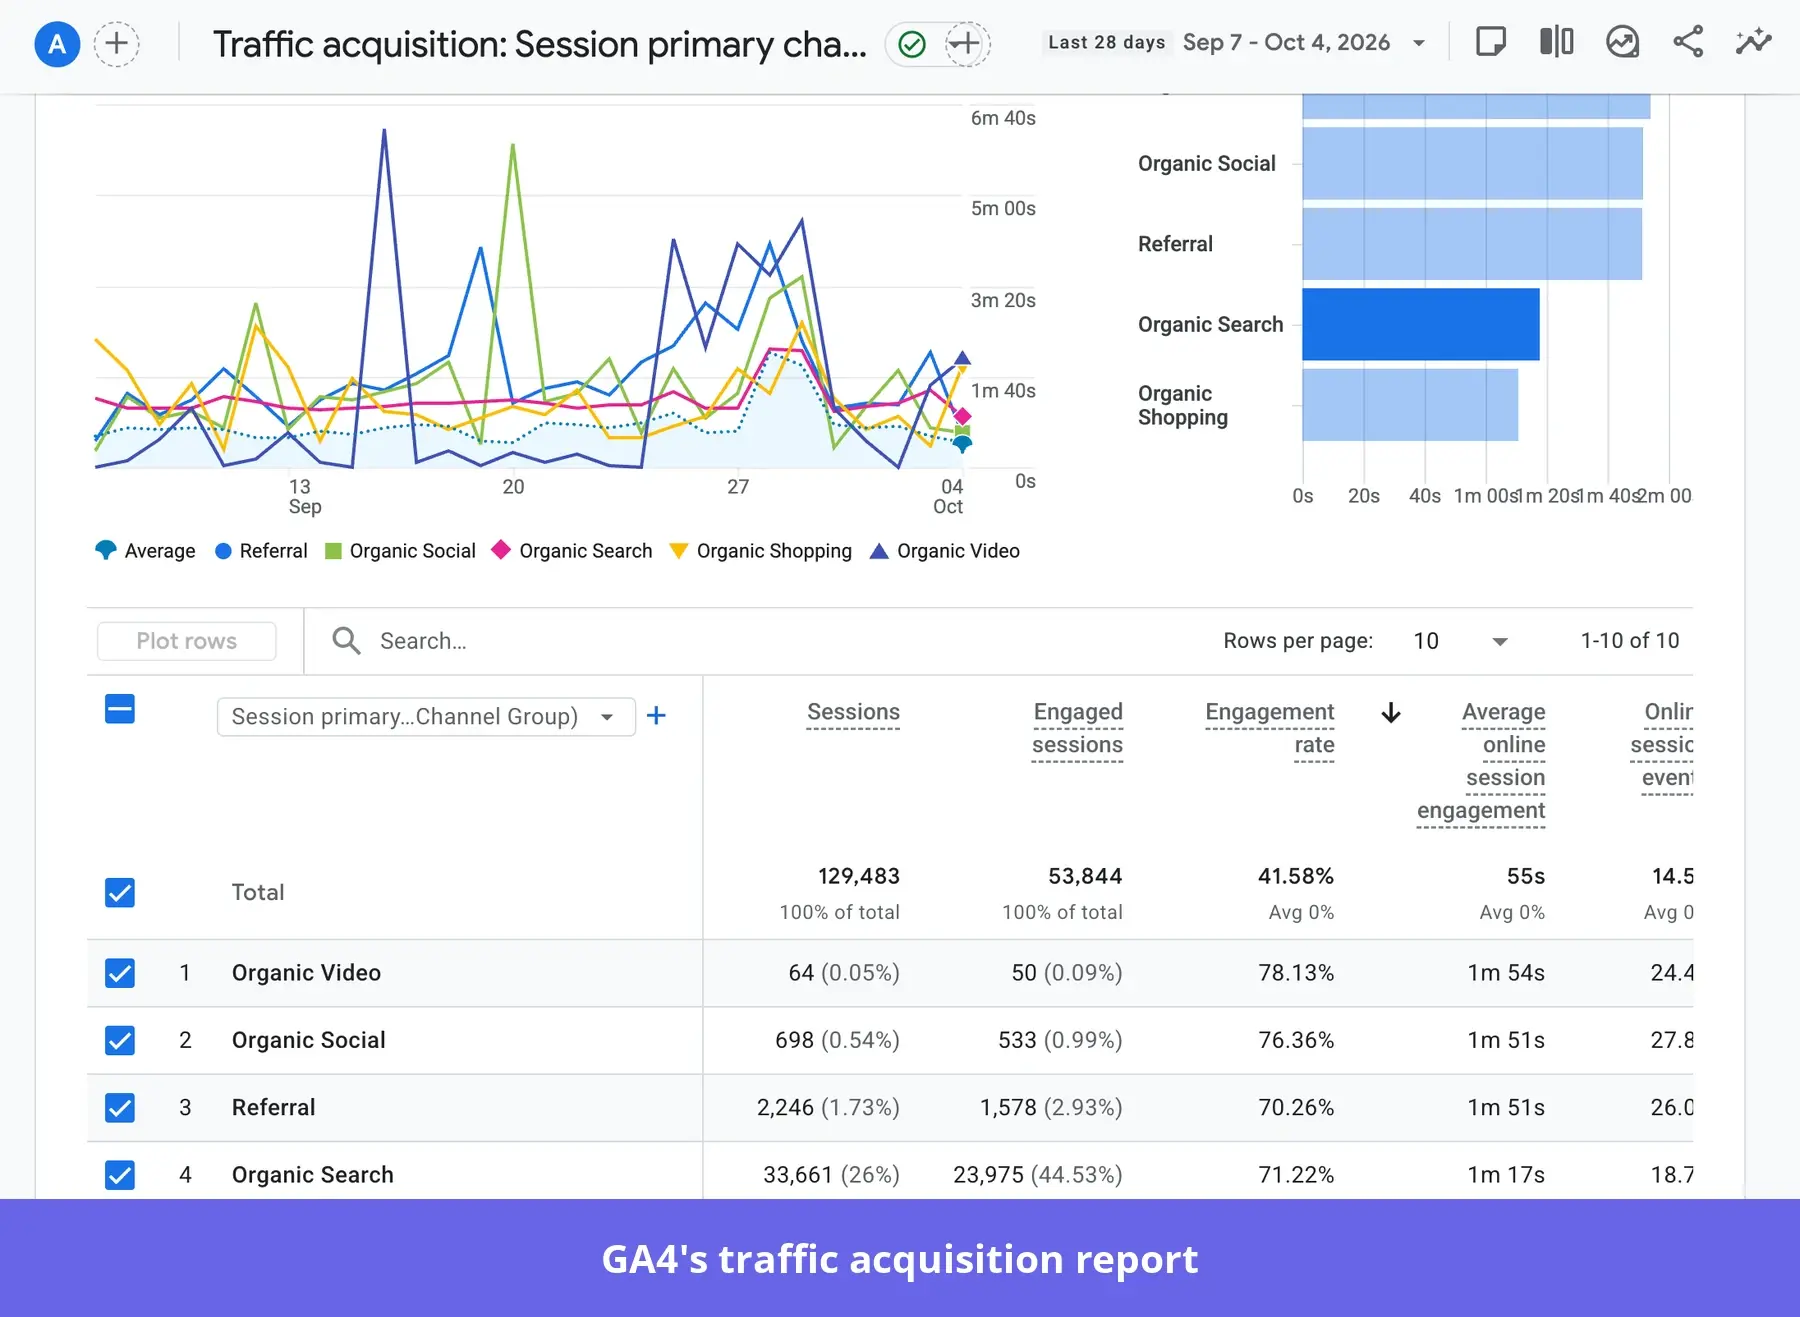
- Traffic acquisition report: GA4 sorts traffic sources into rule-based default channels such as Organic Search, Paid Search, Paid Social, Email, Referral, and Direct. It includes multiple dimensions (such as session campaign, medium, and source), as well as key metrics like engagement time, engaged sessions, engagement rate, sessions, and even revenue from purchases (you must set up the purchase event).
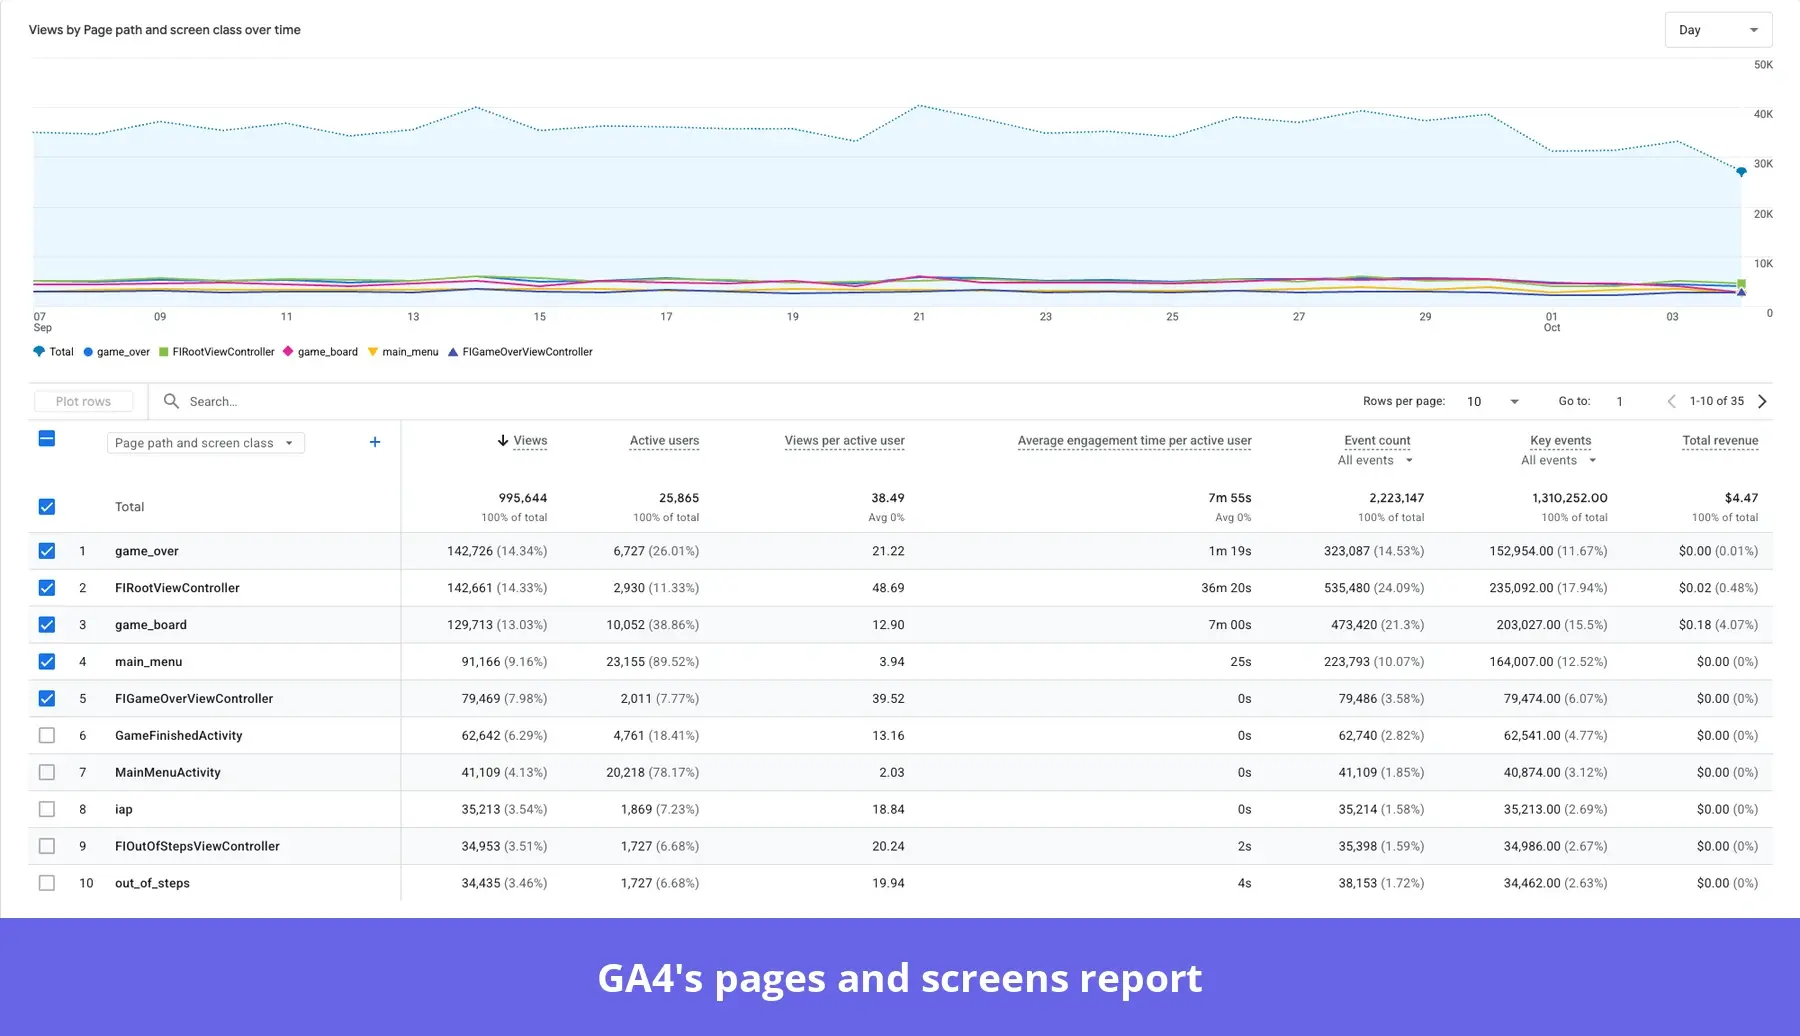
- Pages and screens report: Shows metrics about the pages on your website or screens on mobile apps, including views, active users, average engagement time per active user, key events, and total revenue.
- Landing page reports: Shows the first page of each session alongside sessions, new users, and key events. You can add session source/medium as a secondary dimension and see which channels send traffic to your best-converting pages.
- Key events (formerly Conversions) and sign-ups: You can see which channels and campaigns improve key events or sign-ups (you must mark the sign-up event as a key event). In addition to default key events like purchase, standard properties let you flag up to 30 key events and turn them into Google Ads conversions.
- Campaign tracking: Add UTM parameters such as utm_source, utm_medium, and utm_campaign to your links, and GA4 credits each visit to the right campaign, newsletter, or ad.
Userpilot vs Google Analytics for AI-centered analytics
Like all companies right now, both tools have developed AI features and capabilities. GA4’s AI flags anomalies and forecasts purchase and churn. Userpilot’s AI diagnoses in-product friction and builds the fix. Let’s break all of that down below:
How Userpilot uses AI
Userpilot’s AI toolkit revolves around automating tasks, enabling agents, and ultimately saving you time. On one side, there’s the agent analytics dashboard that measures how your users interact with your product’s AI assistant and proves its value (which is more necessary today, considering Gartner predicts that over 40% of agentic AI projects will be canceled by the end of 2027)
On another front, our AI agent (Lia) can answer questions about product usage, which you can also query directly from Claude via the MCP server.
| Feature | What it does | Use case | Plan |
|---|---|---|---|
| Agent analytics | Tracks satisfaction rate, topics, and frustrating conversations. Also compares retention for users who used the agent with those who didn’t. |
|
Add-on on the Growth and Enterprise plans |
| Lia | Analyzes your Userpilot data to find sources of friction. Also creates segments, reports, or dashboards as needed. |
|
All plans |
| MCP server | Connect Userpilot data to Claude, ChatGPT, Microsoft 365 Copilot, or Cursor. Answers questions about funnels, trends, retention, or specific users without opening Userpilot. |
|
All plans |
How Google Analytics uses AI
GA4 AI features focus more on finding anomalies across your website. This involves using AI models to detect unusual patterns or predict future revenue based on historical data.
Here’s what GA4 offers with AI:
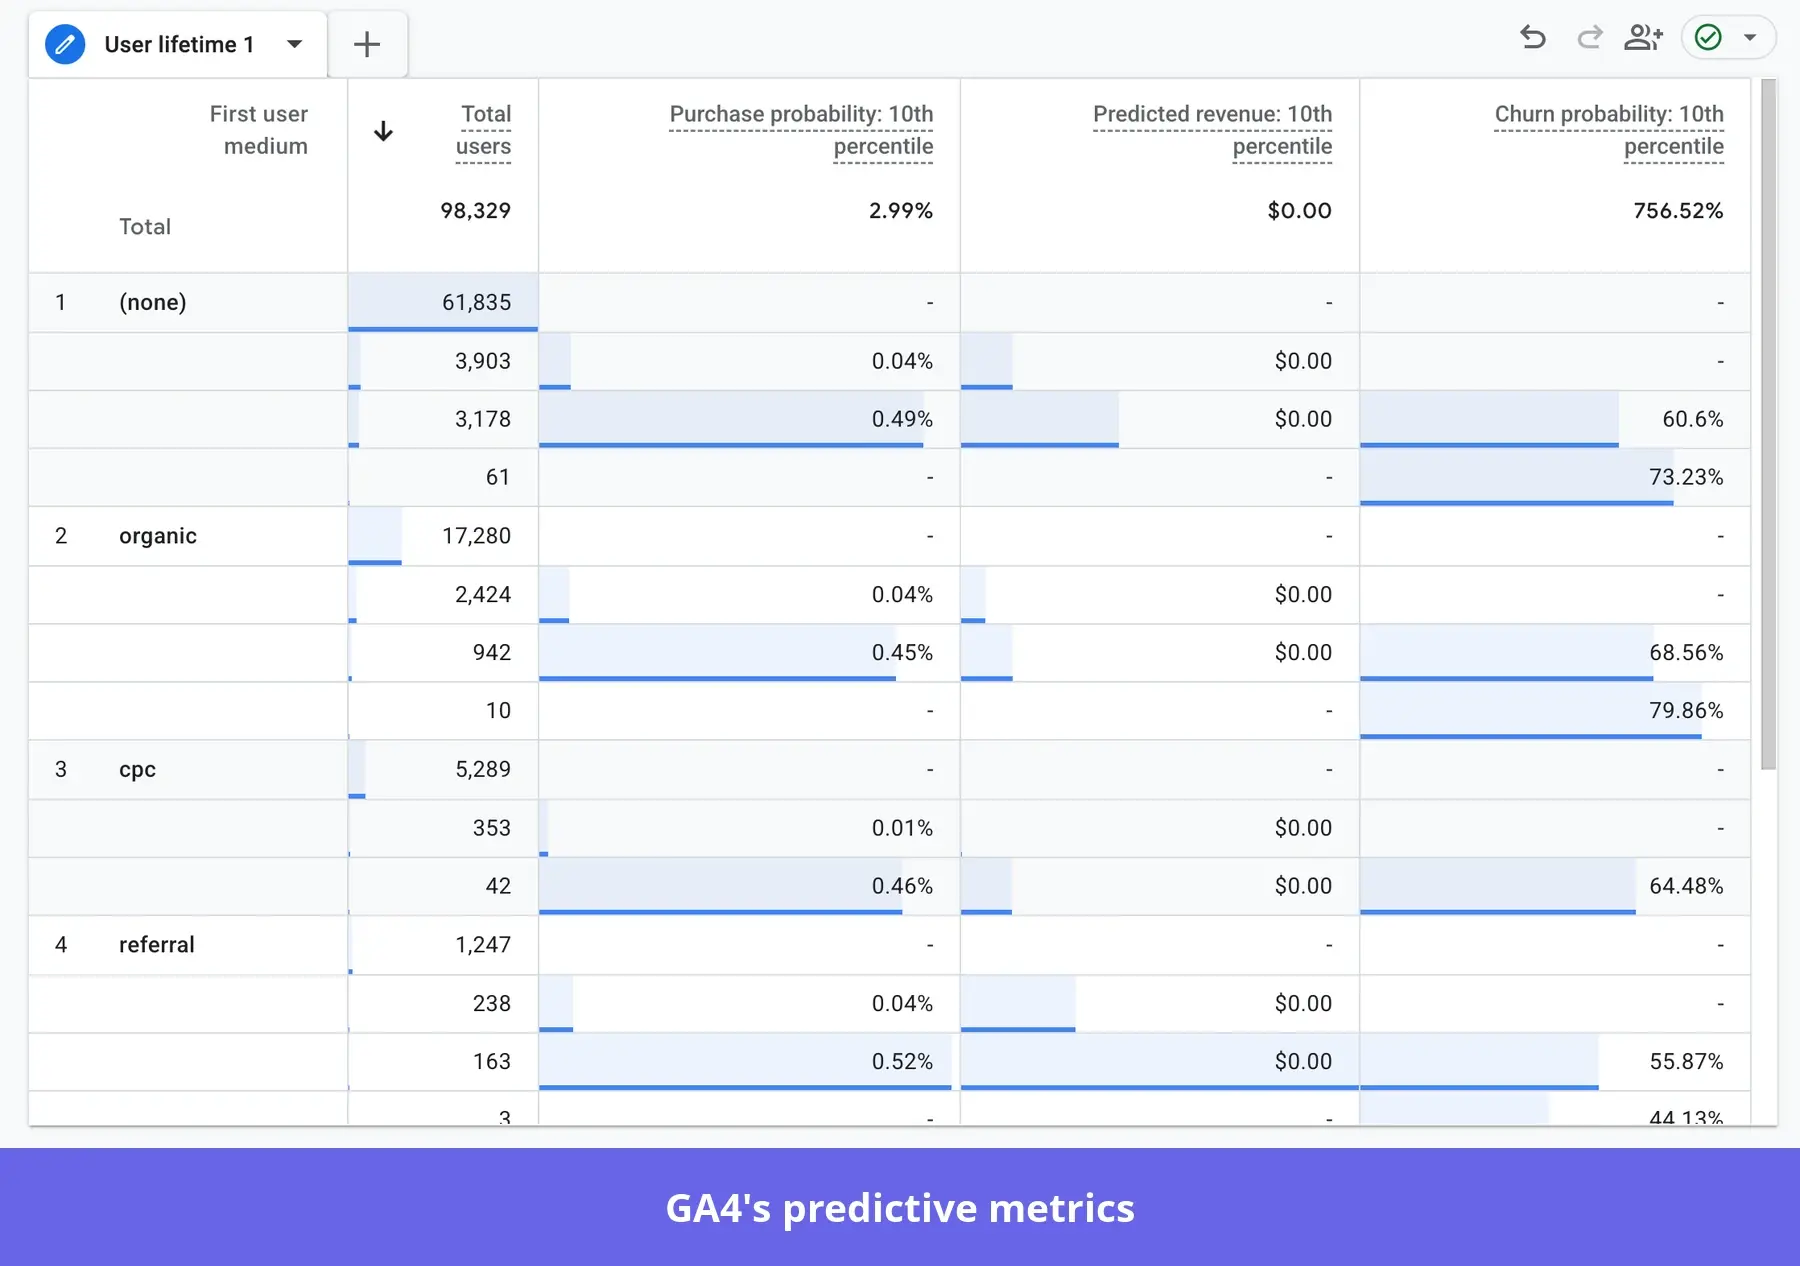
- Predictive metrics: GA4 estimates purchase probability and churn probability over the next 7 days, plus predicted revenue over the next 28 days. To be eligible for predictive metrics, your app or site must have at least 1,000 returning users who triggered the predictive condition (purchase or churn) and 1,000 returning users who did not, sustained over a 7-day window in the last 28 days.
- Anomaly detection: GA4 uses a Bayesian time-series model to flag data points that fall outside the expected range for any metric. To learn what’s normal and spot glitches, it must train on the last 2 weeks of data for hourly checks, 90 days for daily, and 32 weeks for weekly.
- Analytics Insights: This tool automatically flags unusual changes and emerging trends. You can set up to 50 custom insights per property, such as an email alert when 30-day active users fall by more than 20%.
- Ask Advisor (beta): A Gemini-powered assistant that answers questions about your property in plain language, such as why landing page conversions dropped.
- Google Analytics MCP server (read-only): It lets you query your GA4 data in natural language with your preferred AI tool. However, because it’s read-only, you can’t ask it to change any configuration or setting.
Userpilot vs GA4 for in-app behavior and action
My gripe with most product analytics tools (and GA4 isn’t an exception) is that they bring in many data points that look valuable but don’t help with decision-making.
Teams get overwhelmed and take no action because, although the tool shows users are failing, they can’t wrap their head around why or what product changes are needed.
Userpilot focuses on actionability. Its tools work together so you can go from insight to action fast, without needing help from devs.
So in this section, I’ll first cover what you can do in GA4 to get more actionable insights. And then, I’ll show you how Userpilot enables product adoption and growth with actionable analytics.
Where Google Analytics fits in in-app behavior and action
GA4 records what happens on each page or screen, which is enough to show you a drop-off. However, fixing a drop-off with GA4 alone usually means a ticket for custom tooltip code and a separate survey tool.
Here are a couple of ways you can get more actionable insights from GA4:
- Form interactions: Both form_start and form_submit events show when people begin a form and whether they finish it. If too many users don’t complete a form, you can re-evaluate the fields to improve completion rates.
- Real-time report: Checks which pages people are viewing and which events they’re triggering in the last 30 minutes. It’s actionable when you’re rolling out an update and want to pinpoint potential bugs for your team.
- Follow up with dropped-off users: Group users who reached a page but never completed the next key event, and share them with Google Ads for remarketing.
Where Userpilot fits in in-app behavior and action
Userpilot closes the gap between insight and action by offering more than analytics. It also offers in-app surveys, self-service support, session replays, in-app guidance, and agentic automation.
The analytics layer is only one part of the engine that helps teams improve product adoption. For instance, a dashboard shows a low adoption rate for a core feature, and an in-app survey of non-adopters says they didn’t know it existed. With Userpilot, you can add a targeted hotspot or tooltip on the feature to encourage discovery.
These are the tools you can use to address in-app friction:
- Interactive walkthroughs: Guide users through a multi-step setup or process, one step at a time.
- Checklists: List the onboarding tasks users complete at their own pace, with each item able to launch a flow on a click.
- Resource center: Give users self-service help 24/7, including videos and articles from your knowledge base.
- Spotlights: Point at one element with a tooltip, a hotspot that draws the eye, or a button that prompts users to take a specific action.
- Banners: Announce a change or a fix with a message that stays visible without blocking the page.
- Emails and Workflows: Emails communicate with users outside the app. Workflows can chain flows, spotlights, banners, checklists, emails, and surveys with conditions.
- In-app surveys: Ask users who dropped off about what stopped them during onboarding flows, with rating or open-text questions targeted at that segment.
Our own product team works this way. After we launched email in Userpilot, the data showed a large drop-off in the first two steps because users couldn’t verify their domain.
Within a few hours, I created a targeting tooltip, showed it to users, and highlighted the right steps so they knew what to do next. That helped reduce friction and support users in real time without involving our dev team.
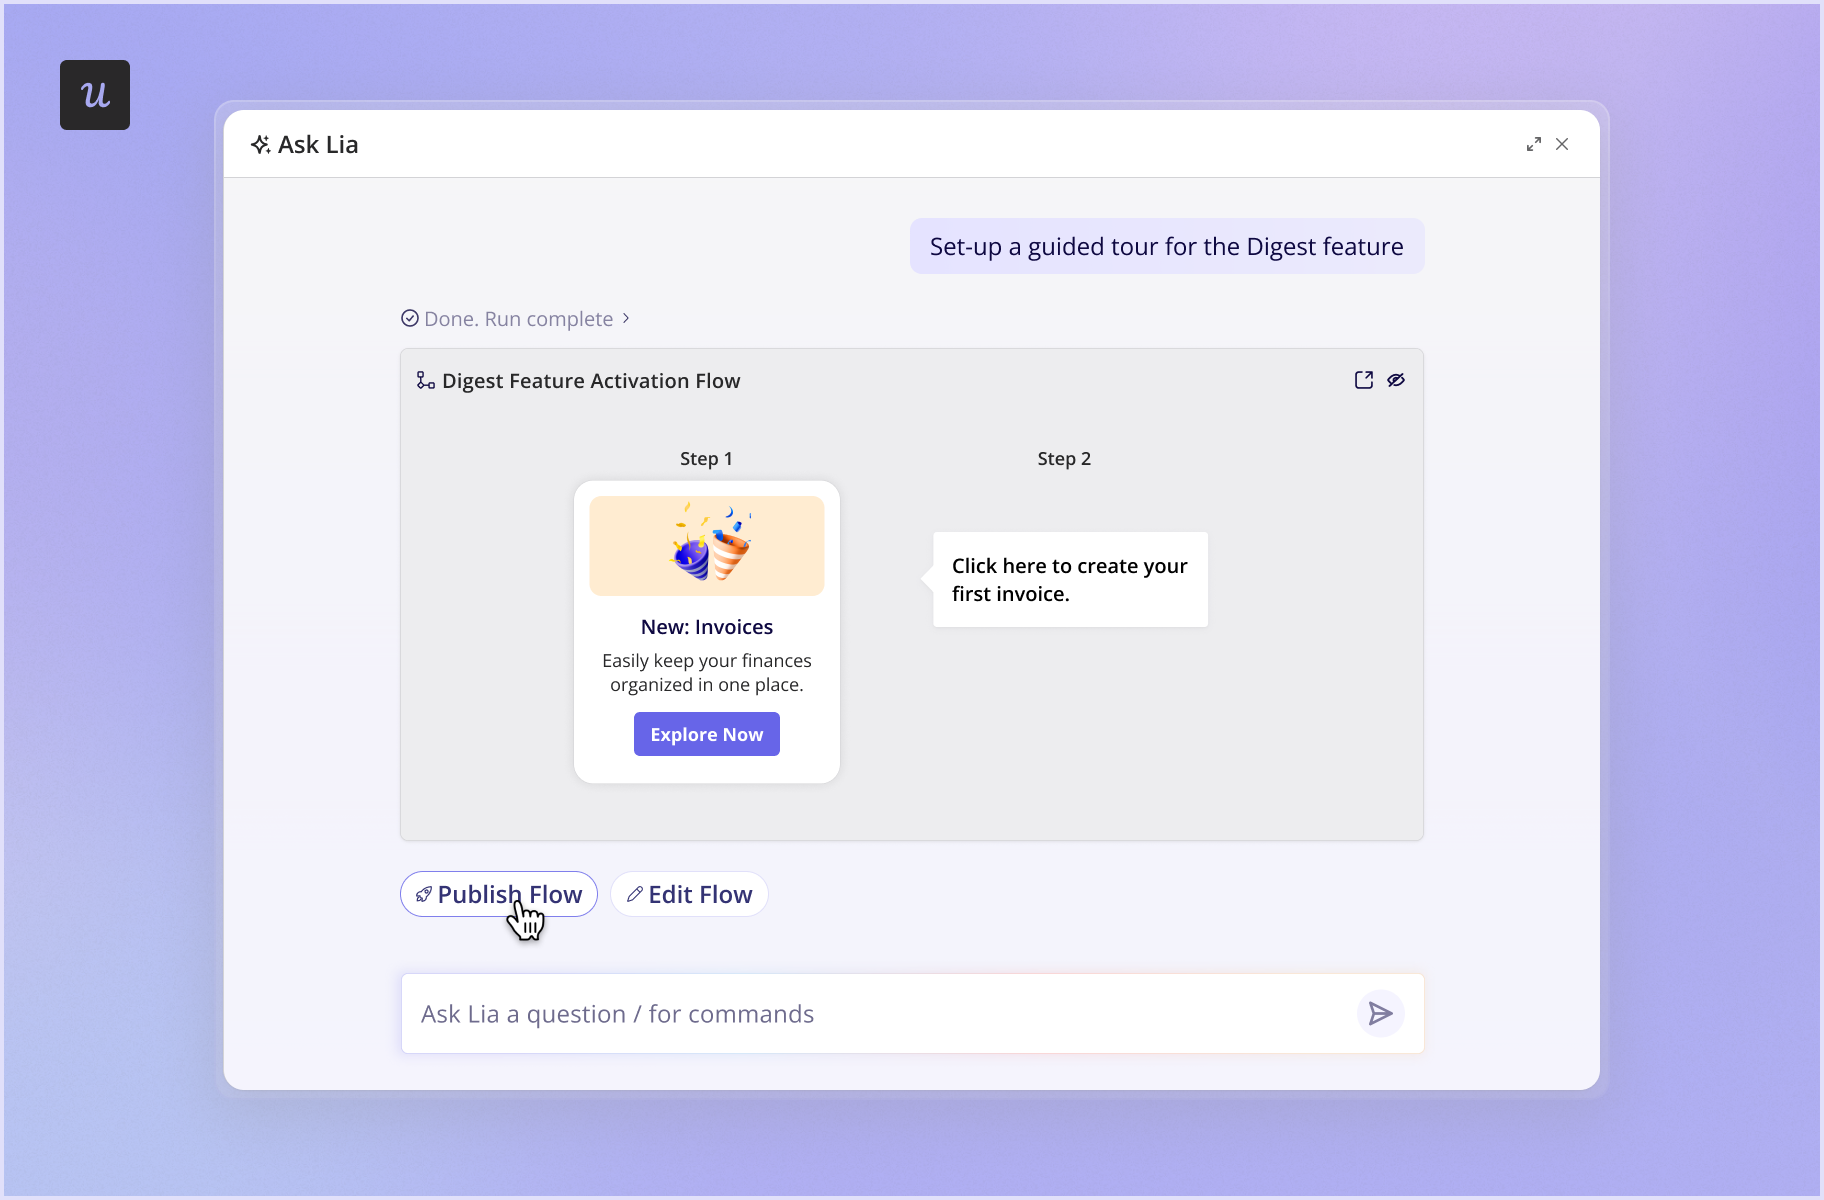
On top of this, Lia shortens the path from insight to action even more. For example, it can analyze conversion funnels, explain where users drop off, create a segment of stalled users, and draft an activation flow.
How do Userpilot and Google Analytics costs compare?
Userpilot is priced by monthly active users (MAU), while GA4’s standard version is free, with a paid upgrade (Analytics 360).
Here’s how Userpilot’s pricing plans work:
- Starter plan: $299 per month for up to 2,000 MAU and 3 seats. It includes in-app engagement, up to 10 segments, usage trends, NPS surveys, Lia, and the MCP server.
- Growth plan: Starting at $849 per month, from 2,000 MAU and scaling to 100,000. It adds funnels, paths, retention, custom dashboards, event autocapture, the resource center, advanced surveys, and more.
- Enterprise: Custom pricing, starting at 10,000 MAU. It adds mobile engagement, premium CRM integrations, data warehouse sync, a custom contract, and an SLA.
Both Growth and Enterprise plans also offer Agent Analytics as an add-on.
On the other hand, Google Analytics comes in two versions:
- GA4: Free, with limits such as up to 14 months of retention for explorations, sampling on queries over 10 million events, 30 key events, and a daily BigQuery export of 1 million events.
- Analytics 360: Paid and sold under contract with no public pricing. It raises those limits, with up to 50 months of retention, 50 key events, 100 parameters per event, and SLA coverage.
Although GA4 is mostly free, tracking behavioral data does come with a cost. Someone has to design and maintain the events in Google Tag Manager, and BigQuery exports cost money once you stream data or outgrow the free sandbox.
Userpilot also needs a developer, but only to install its script and identify users (maybe to set up some custom events later on). Plus, if you’re on a PLG team and already use GA4, Userpilot can replace several tools (like DAPs, user feedback tools, and session recordings). This may cost less than buying them individually.
Is GA4 not enough? Add Userpilot to see why users drop off
Product, CS, and growth teams tend to outgrow GA4 after a certain stage. They hit over 10 million events per query, the data no longer drives decisions, and analysis becomes a bottleneck in agile workflows (so teams keep shipping vibe-coded features with no data).
In those cases, Userpilot does more than cover product analytics. It provides tools to make analysis more accessible, surface insights that drive product decisions, and improve adoption.
So if your team could benefit from combining product analytics with other PLG tools, book a Userpilot demo. It’s free, and you’ll be able to experience its analytics + engagement suite yourself.
FAQ
Can GA4 track in-product behavior and funnels?
Yes, GA4 can track both once you set it up.
But tracking specific feature actions needs custom events and registered custom dimensions. Plus, funnel and path explorations only reach back as far as your retention setting (up to 14 months on standard properties), and queries over 10 million events are sampled.
Do I need a product analytics tool alongside GA4?
Yes. Especially if you work with a scaling SaaS company that will eventually outgrow GA4.
GA4 is designed around acquisition and conversion, with limited tools for tracking product interactions and identifying drop-offs. But dedicated product analytics tools like Userpilot add feature-level analytics, advanced segmentation, and session replays, which can be key for growing your product.
Can I use Userpilot and Google Analytics together?
Yes, the Userpilot-Google Analytics integration is available on all Userpilot plans and turns on with a single click. It sends Userpilot experience events (such as a flow started, completed, or step seen) into Google Analytics, so you can see how users from each channel and campaign engage with your in-app experiences.
About the author