Inside Product Analytics: Why Most Teams Have the Data and Still Get It Wrong


Why do we need product analytics in the era of MCPs and AI agents doing the heavy lifting? Well, for starters, we are shipping more software than ever, and half of it is going unused.
GitHub Copilot now generates 46% of the code developers write. With vibecoding, features that took weeks, ship in days, but the attention available to check them hasn’t scaled.
Most PMs can’t tell whether a feature failed because of the product or the onboarding, whether users never found it, or found it and left.
Another problem is that AI agents are using SaaS products on behalf of human users through MCP integrations, APIs, and automated workflows. An agent doesn’t click or scroll. It executes. The metrics built around human behavior will increasingly misread agent-heavy accounts. The PMs who get ahead of this are already rethinking what and how they track.
Both problems have the same root: measuring the wrong things, or not acting on what the data is already saying.
I talked to people who live with this problem daily. That meant conversations with Abrar Abutouq, our PM, and Kevin O’Sullivan, our Head of Product Design. I also read everything I could find from people like Olga Berezovsky and Corinna Stukan, who have spent years thinking seriously about this space.
What came out of those conversations is this guide. The timing also felt right because product analytics has changed more in the last three years than in the last decade.

What product analytics actually is and why the old definition no longer cuts it
Most definitions of product analytics start with tools and end with dashboards. But what product analysts actually do is harder to summarize and more valuable than any tool stack.
It starts with understanding how a product generates data, how tracking is implemented, what gets captured, and why it differs across product types. A mobile app generates different signals than a browser extension. A self-serve SaaS product has different instrumentation needs than an API-first platform.
“The real work, as Abrar puts it, isn’t recording that users did something — it’s understanding the conditions under which they did it, what they were trying to accomplish, and whether they got there. That context is what separates analysis that drives data driven decisions from analysis that fills slides.”
The biggest challenge in product analytics isn’t capturing user actions. It’s interpreting how those actions come together to form behaviors, and understanding what those behaviors actually mean. Expertise in this discipline comes from context: understanding the product, the user, and the lifecycle that connects them. That understanding takes time to build and can’t be shortcut with a better dashboard.
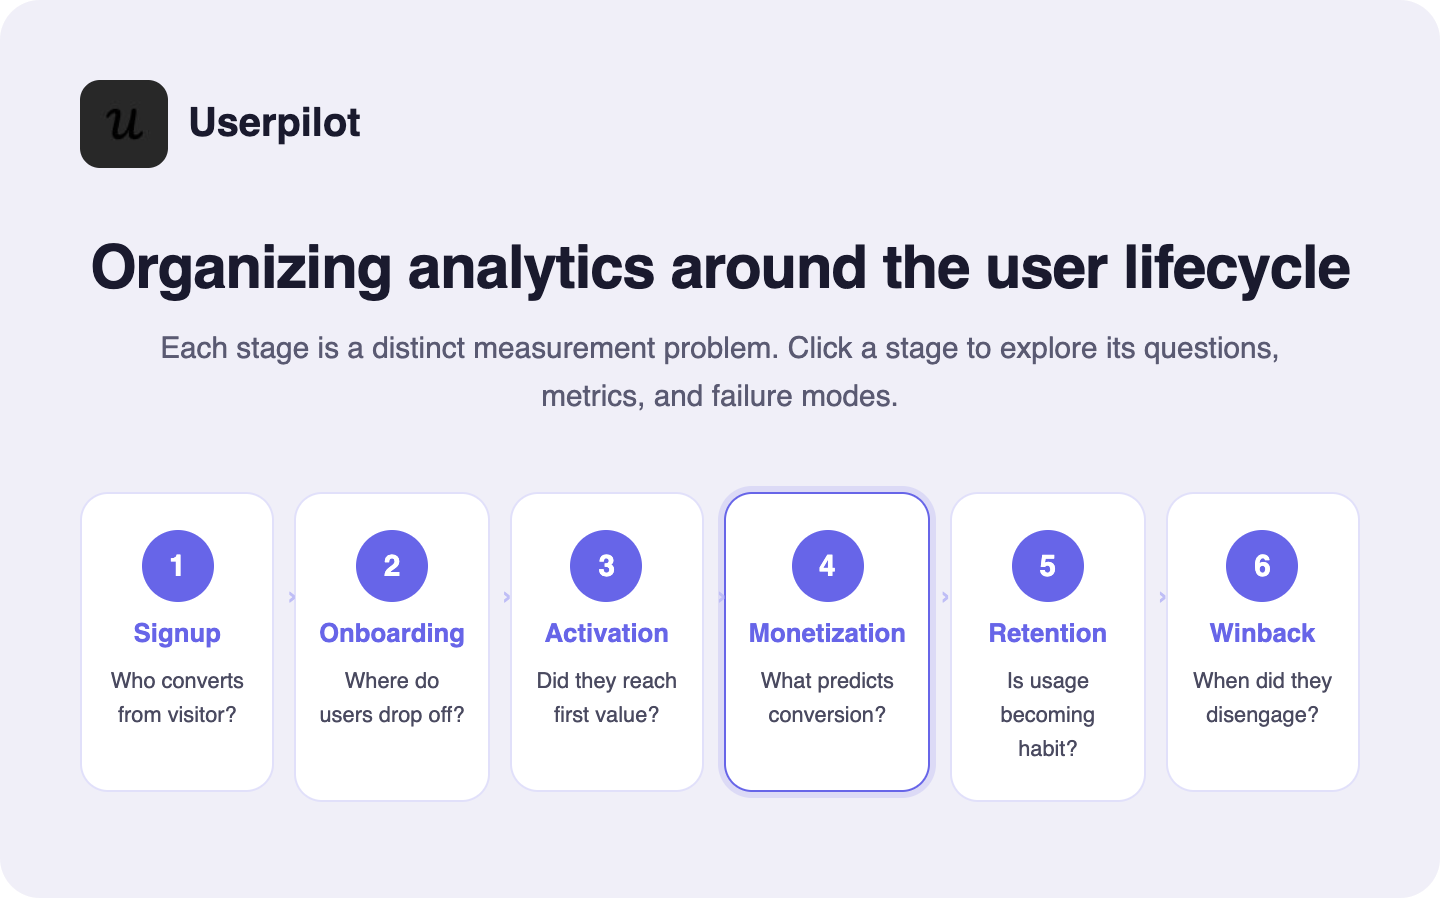
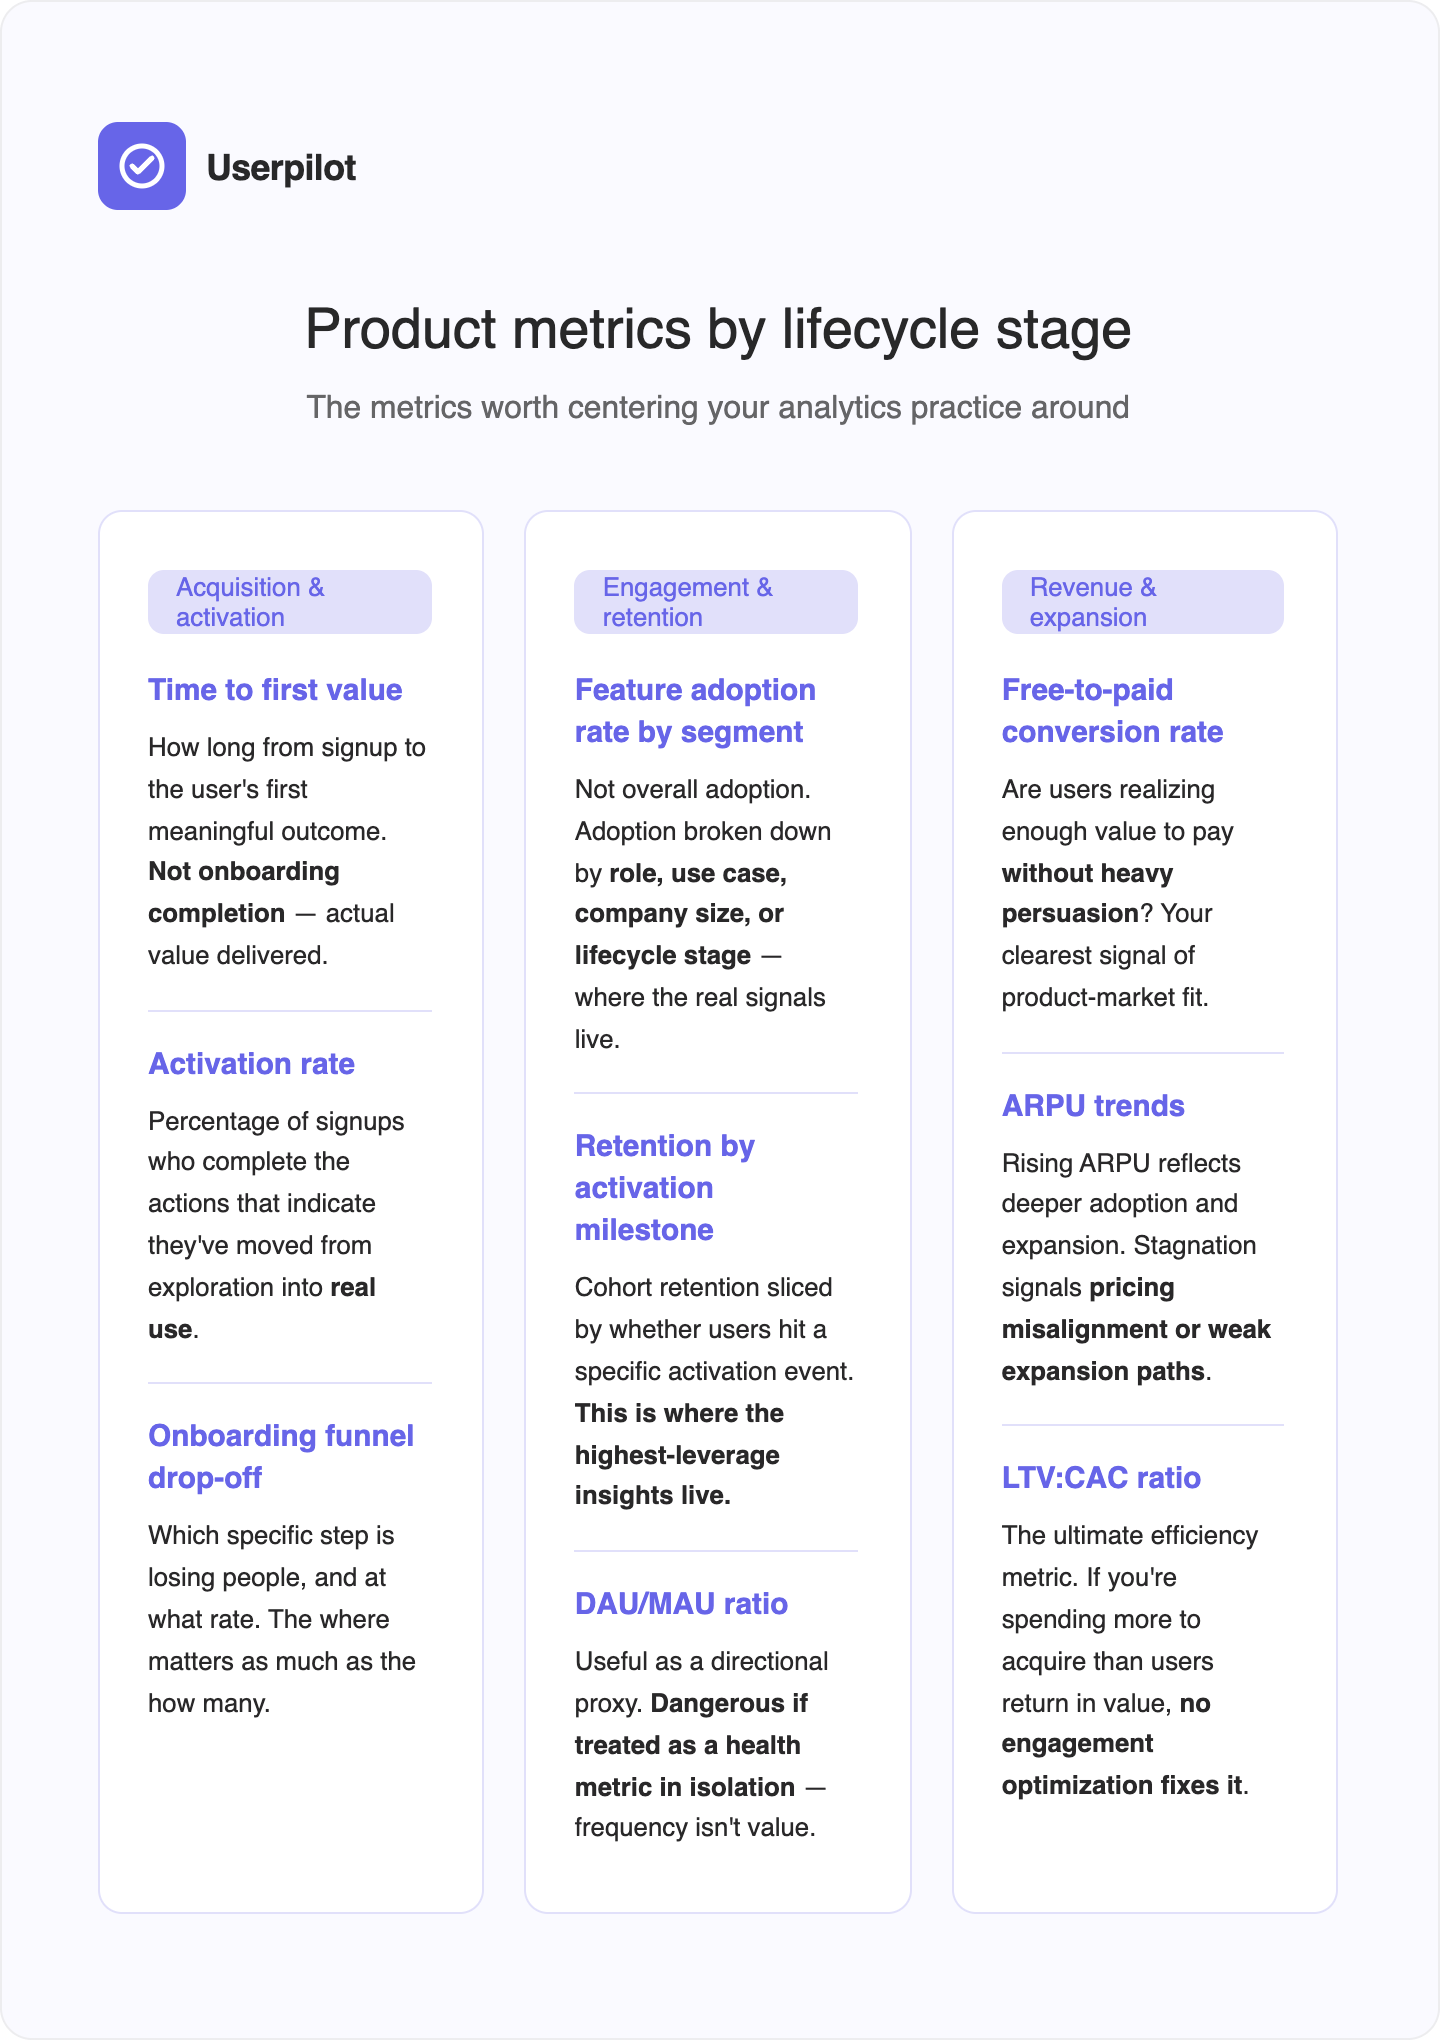
Product analytics in the context of the user lifecycle
The most useful way to organize your data is to implement product analytics around the user lifecycle. It forces you to ask the right question at each user journey stage.
The standard lifecycle looks like this: signup → onboarding → activation → monetization → retention → winback. But as Olga Berezovsky notes, the entire user journey looks different depending on what you’re building. Mobile apps don’t really have “signups”; the journey starts with a download. Browser extensions often define activation around a successful installation.
The PM’s job is to set up measurements for each stage appropriate for your specific product, then translate business KPIs into product metrics that actually reflect reality:
- Monthly retention → MAU
- MRR/ARR → Successful transactions
- Churn → Net new cancellations
- Subscription renewals → Successful payments
Each lifecycle stage has its own analytical questions and its own failure modes:
Product analytics vs. web analytics vs. marketing analytics vs. BI
A lot of teams treat these interchangeably. They’re not.
Elliot Latil has one of the clearest explanations I’ve come across. He frames it as three different questions:
- “Are we attracting the right traffic at the right cost?” That’s marketing analytics. The focus is on acquisition, attribution, ROAS, and LTV. The analyses are about channel performance, ad attribution, marketing funnel drop-offs, and incrementality.
- “Are users finding value and sticking around?” That’s product analytics. The focus is on analyzing user behavior, engagement, retention, stickiness, and time-to-value. The analyses are feature adoption, user journeys, retention cohorts, A/B tests, and activation metrics.
- “Are we converting demand into revenue efficiently?” That’s ecommerce or revenue analytics. The focus is conversion, checkout flows, product performance, and pricing.
Each area answers different questions and uses different KPIs, product analytics software, and analytical lenses. The takeaway Elliot draws, and I agree with it, is that high-performing teams don’t choose one but connect all three.
Business intelligence sits above all of these: it’s the layer that aggregates data from multiple sources for executive reporting and strategic decision-making. It answers the company-level “how are we doing?” question. Product analytics answers the user-level “what are people actually doing, and why?” question.
Why product analytics matters more than most teams realize
Product analytics gets treated as a reporting layer that you check after something goes wrong, or as the slide you pull up in a quarterly review to show the board a trend line. That framing undersells it by an order of magnitude.
Here’s a more accurate way to think about it: product analytics is the only function in your organization that can tell you what users are actually doing inside your product, as opposed to what they say they’re doing.
Product analytics is the difference between building fast and building right
Shipping velocity has never been higher, and the numbers are striking. As we stated, GitHub Copilot alone now generates 46% of the code developers write, and over 90% of Fortune 100 companies have adopted it. The volume of code reaching production has increased dramatically. The volume of human attention available to review it has not. AI-assisted development has compressed the time from idea to production, and PLG teams are releasing faster than ever. But speed without signal is just expensive guessing. You can ship ten features in a quarter and have no idea which one moved the needle or whether any of them did.
Without product analytics, your product roadmap is built on intuition and whoever made the most persuasive argument in the last planning meeting. With it, you have evidence: which features are actually used, which onboarding steps lose people, which user segments are expanding, and which are quietly disengaging.
“We had a huge drop-off with the first two steps of the email feature — users had access but they weren’t activating their domain. By checking the dashboard, I created a checklist to walk them through each step.” — Abrar Abutouq
Analytics reveals the gap between acquisition and real value
Most growth metrics stop at acquisition. Signup is the beginning of the story, not the end. The question that actually matters is whether users reached real value, and how quickly.
Product analytics is the only way to answer that. It shows you the path from signup to first meaningful outcome, where users drop off, and what successful users did differently. That’s the foundation of better onboarding, smarter segmentation, and a clearer, more complete picture of which users are worth investing in.
It also helps answer one of the hardest diagnostic questions in product work: when feature adoption is low, is it a product problem or an onboarding problem? They look identical in the data but require completely different responses. One needs engineering. The other can be fixed with in-app guidance the same day.
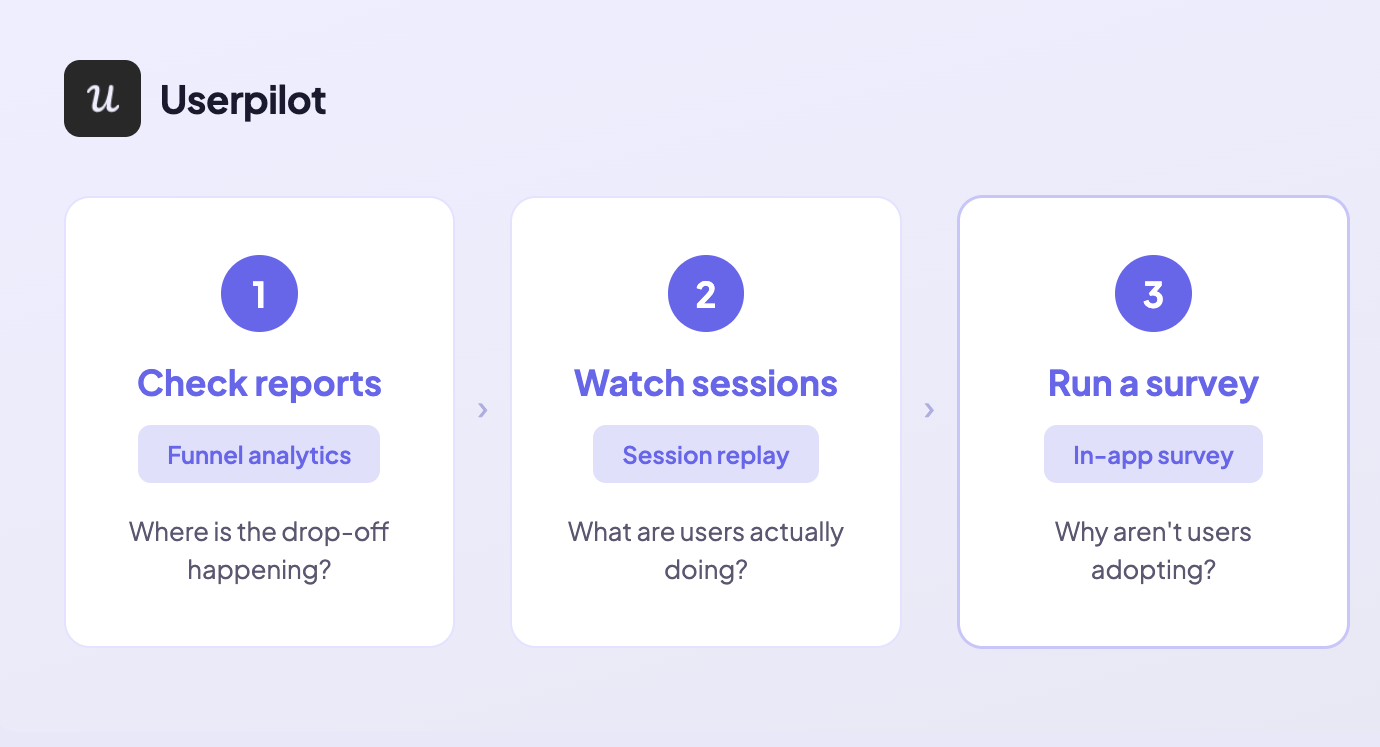
Abrar’s triage framework cuts through this cleanly: start with reports to find where the drop-off is happening, then watch session replays to see what users are actually doing at that step, then run a survey to understand why.
“Session replay reveals the real friction points and shows how users actually interacted with the feature,” she says. “There can be many reasons why users don’t adopt as expected — sometimes they don’t understand the value, sometimes the setup is complex.” Each layer of the framework narrows the diagnosis until the right fix becomes obvious.
Product analytics surfaces the uncomfortable truth about your data security
Here’s the part that rarely makes it into the sales pitch for analytics platforms: product data is genuinely difficult to trust.
Unlike transactional data, behavioral event data comes from the client side before any verification layer has touched it. Bots, internal test accounts, QA profiles, duplicate sessions, and unverified signups all show up in your event stream exactly how real users do.
A 15% spike in DAU might be a successful campaign. It might be a bot flood. It might be a new integration double-firing your session event. You need judgment to know the difference before it reaches a stakeholder.
This is where a lot of teams fail. Not because they lack the data, but because they don’t interrogate it carefully enough before acting on it. Building confidence in your numbers isn’t a technical task. It’s a discipline.
When Kevin’s team at Userpilot released auto capture, for example, they had to act fast when the data came back unexpected. “Within two weeks, the data showed customers weren’t comfortable with CSS selectors — so we added the visual labeler.”
Two weeks of behavioral data drove a product pivot. But that only works if you trust the data in the first place. Trust is something you build through validation, not assumption.
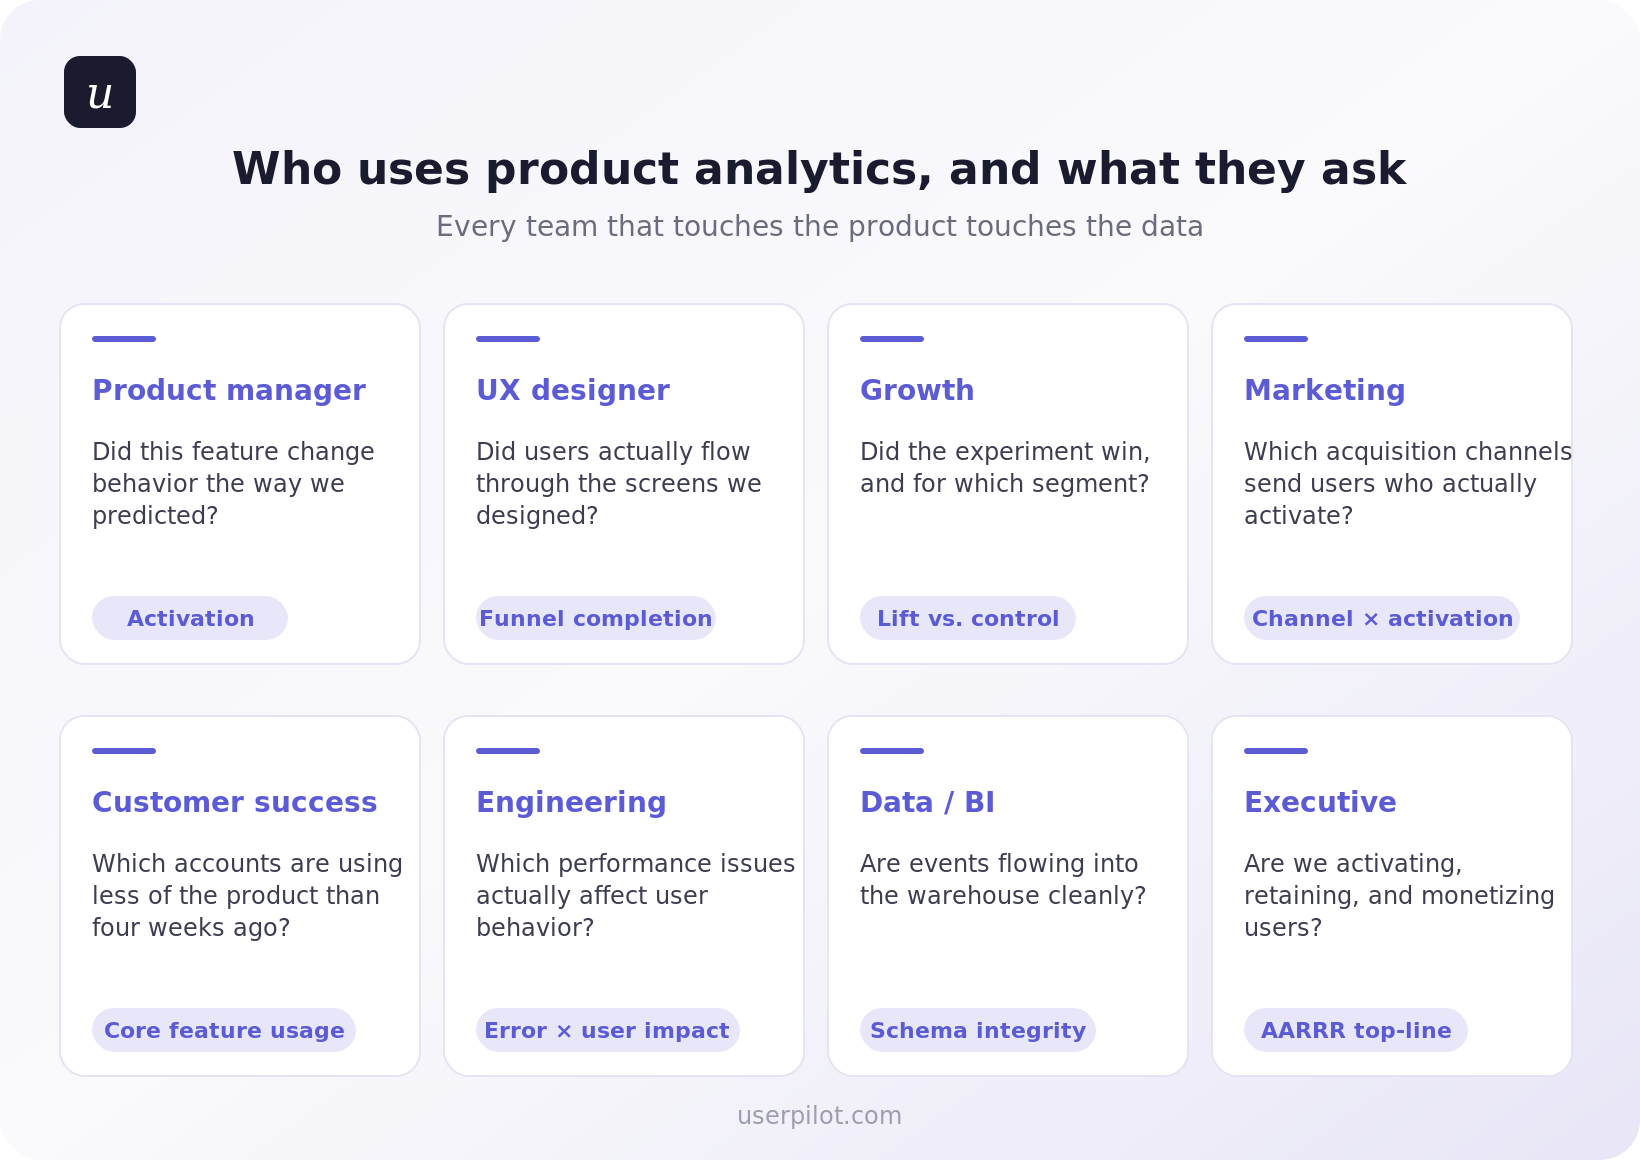
Analytics makes every product function more effectively
Product analytics doesn’t just benefit the product team. When it’s set up correctly and connected to the right systems, it improves every function that touches the customer.
Customer success teams can see which accounts show user engagement patterns that predict expansion, or disengagement patterns that predict churn, before either outcome is obvious. Marketing can stop optimizing for acquisition metrics that don’t correlate with long-term user retention. Sales can prioritize accounts based on actual product-qualified signals rather than form fills and time-in-trial.
The companies that treat product analytics as infrastructure, not a reporting layer, are the ones that stop making the same mistakes twice.
Product metrics every PM should track and how they connect to the business
Tracking product metrics is one thing. Connecting them to business outcomes is what separates PMs who ship features from PMs who drive growth.
Corinna Stukan, author of The Insights-Driven Product Manager and one of the sharper voices on product business acumen, puts the gap plainly: nearly 60% of product leaders believe business acumen will be the most critical skill for PMs over the next two years, according to Productboard’s 2024/2025 State of Product Management report. And yet most PMs still treat financial metrics as “someone else’s responsibility.”
Her framework is worth internalizing. Business metrics are operational health metrics that describe whether you’re running a healthy, efficient business. Product metrics tell you whether people are using your features. The PM’s job is to connect the two.
That means being able to say, as Corinna puts it: “By improving this specific user behavior, we expect to increase the Lifetime Value of this customer segment, which supports our 10% annual revenue growth goal.”
That’s the language of the C-Suite. It starts with understanding which product metrics map to which business outcomes.
The metrics worth centering your practice around, organized by lifecycle stage:
Two metrics worth deprioritizing:
DAU/MAU ratio gets more attention than it deserves in B2B SaaS. A user who logs in once a week to run a high-value report is worth more than one who logs in daily to check a dashboard they ignore.
James Mitchinson, our Head of Customer Success, had a case that illustrates this exactly:
“There was one [account] where it was clear progress wasn’t being made, but there were still a lot of logins. Being able to look at the difference between those two things gave us the opportunity to have a frank conversation with the executive stakeholder.”
High logins, zero outcomes. The standard health metric missed it entirely.
Session length has the same problem. Long sessions can mean deep user engagement, or they can mean confusion. Without context, it’s noise.
Product analytics in practice: Catching the features nobody uses before they ship and fixing them after
Most teams don’t have a shipping problem. They have an adoption problem. And most of the time, they don’t know which features are failing, or why, until it’s too late to do anything about it without great cost.
What follows is how we actually deal with that at Userpilot, drawn from the people who use the product daily to build and improve it.
Understand user behavior with session replays to inform your product decisions
The fastest way to build features nobody uses is to rely on assumptions about what users do inside your product. The traditional alternative, user research, requires recruiting, scheduling, and incentivizing. It’s slow, expensive, and biased toward users who are willing to talk to you.
Session replay closes that gap without requiring either.
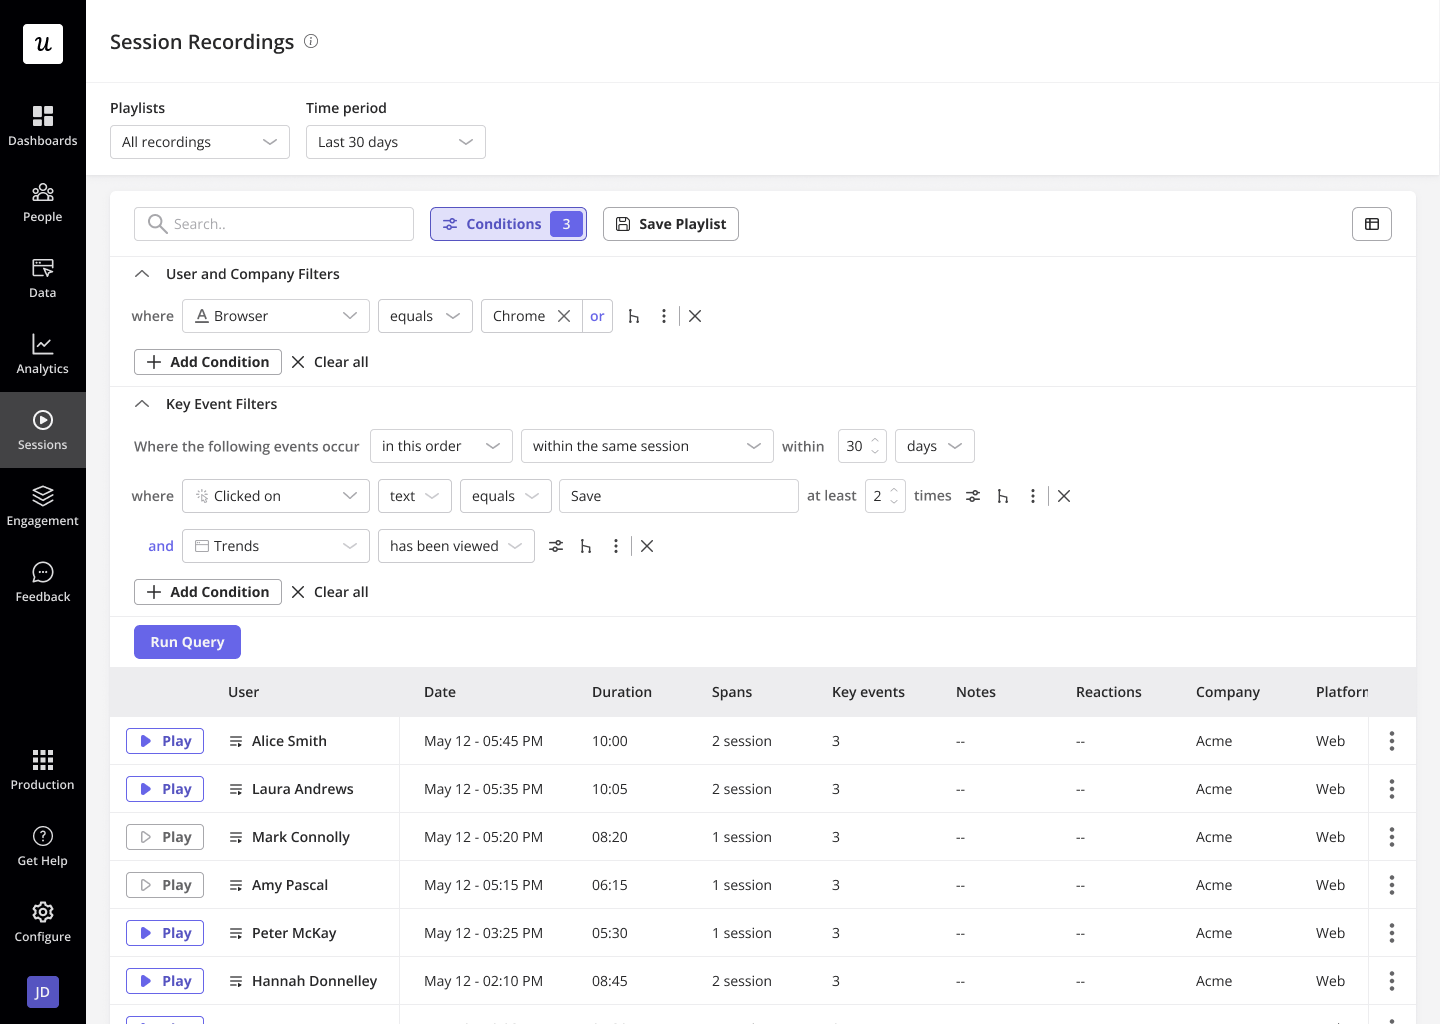
Kevin O’Sullivan, our Head of Product Design, uses session replay as an always-on qualitative data layer instead of watching how users interact with features post-launch, rather than waiting for scheduled research cycles. The payoff was clearest when his team was considering removing the distribution chart from Userpilot’s analytics interface. It looked underused. Session replay told a different story.
The payoff was clearest when his team was considering removing the distribution chart from Userpilot’s analytics interface. It looked underused. Then, session replay told a different story and showed a view of how many users used a feature.
“We were nearly going to completely ax the distribution chart — then session replay pulled us back. Around 10% of users were actually hovering on it. If we scale that up, 10% is quite a lot.”
The feature stayed. Katie Kelly, our UX Researcher, draws the broader principle: “A lot of the time, designers and PMs feel like they’re getting closer to the truth — rather than actually getting there. That’s where behavioral data really comes in handy. You’re filling the gaps rather than using your own mental models.”
Identify where users drop off with funnel analysis so you can prioritize what to fix
Poor feature adoption usually has a specific address: a step in a flow where users stop, get confused, or give up. The problem is that most teams don’t know which step it is. They see low adoption numbers and either rebuild the feature from scratch or add more onboarding, both expensive guesses.
Funnels tell you exactly where people are stopping. Session replay tells you why.
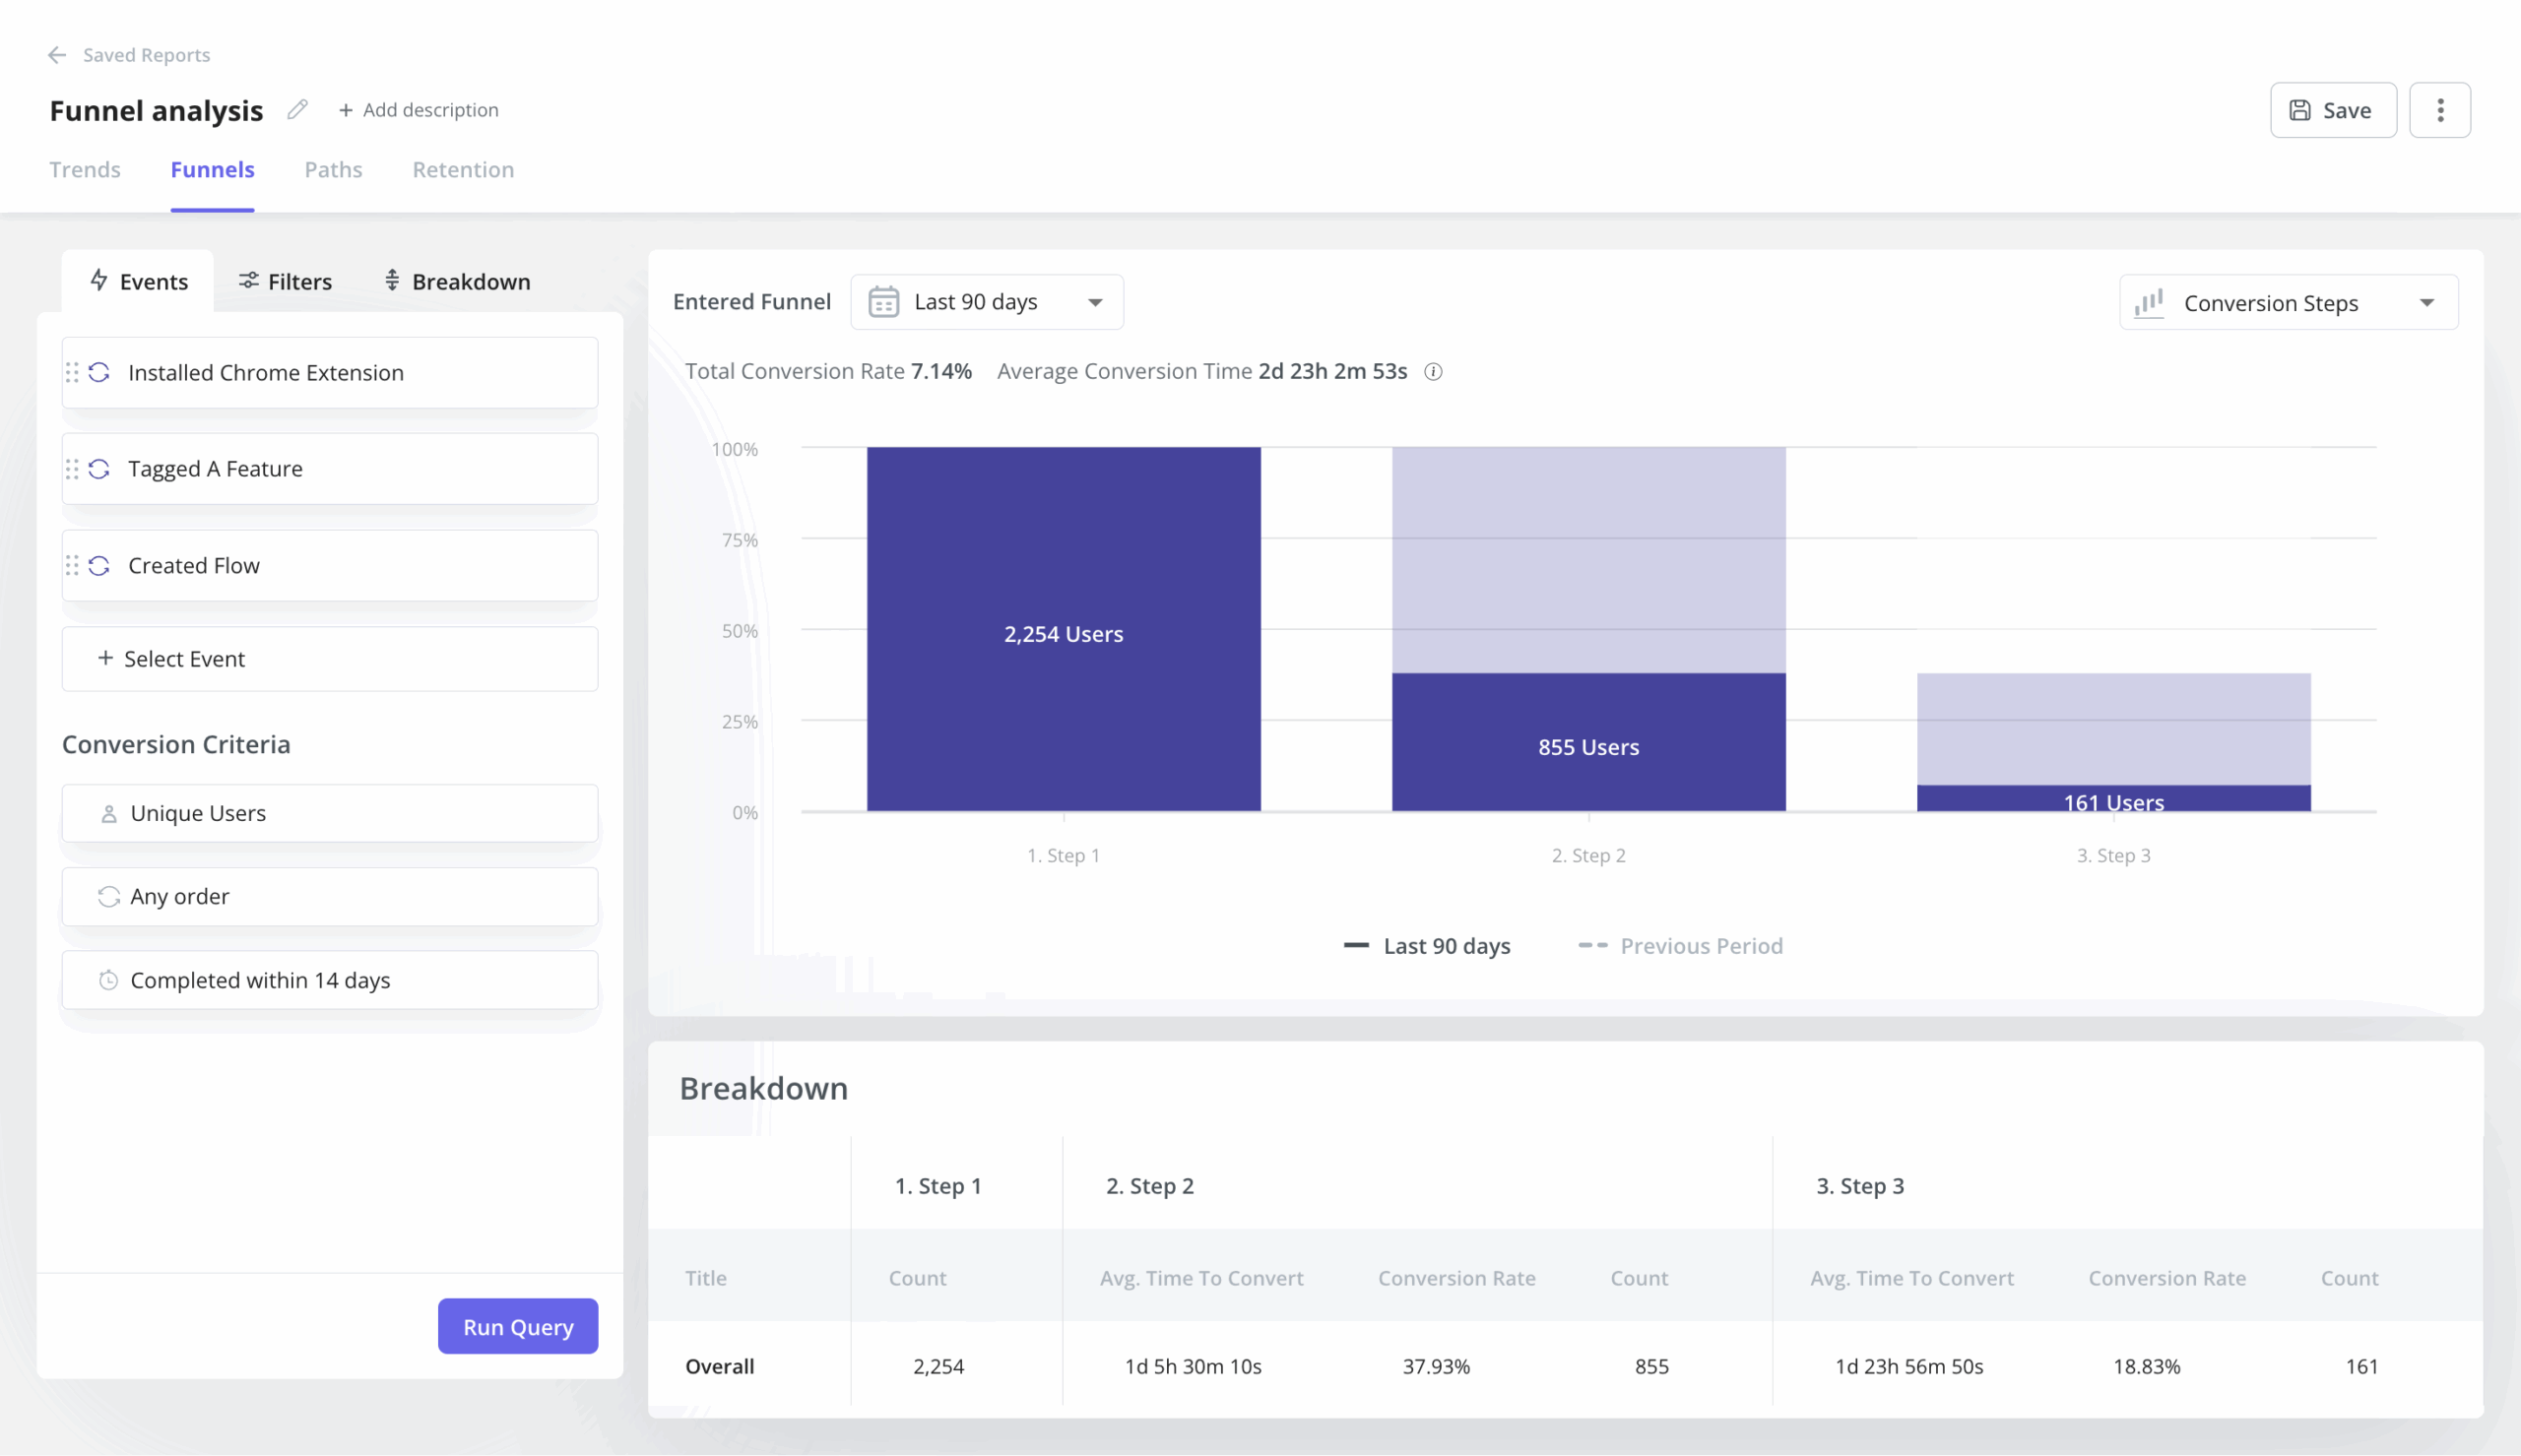
Starting with funnels gives you a specific step to investigate, which makes session replay dramatically more useful.
Abrar runs the same sequence from the PM side:
“The first thing I would do is check the reports and dashboards related to that feature. I look for where the drop-off is happening and which step users are getting stuck on.”
The email feature story: Turning funnel data into an in-app fix without engineering
Abrar noticed a significant drop-off in the first two steps of Userpilot’s email feature. Users had been given access, but they weren’t activating their domain, a step that was required to unlock the feature entirely. He didn’t need to guess where the problem was. The dashboard told him exactly which step was losing people.
“We had a huge drop-off with the first two steps of the email feature. Users had access but they weren’t activating their domain. By checking the dashboard, I created a checklist to walk them through each step,” she says.
Session replay confirmed the why. Users weren’t lost; they were stuck on a technically demanding step with no guidance. The fix didn’t require a dev ticket. Within hours of identifying the problem through analytics, there was an in-app solution live for users.
The mobile feature story: One survey question that reframed the data entirely
When Userpilot launched support for mobile applications, early adoption numbers looked bad. From quantitative data, only 10% of customers were using the mobile feature. Abrar resisted the obvious interpretation.
“One important insight I discovered was that not many of our customers actually had a mobile application yet. So I validated that by simply creating a survey and asking users just one question: “does your company support a mobile application at the moment?”
The answer changed everything. “Instead of saying only 10% of all our customers were using mobile, I could say we have about 25% of customers who actually had a mobile application and are using the mobile feature. Do you see the difference? A more meaningful perspective.”
From there, she segmented:
- Exclude customers without mobile apps from mobile-related messaging entirely.
- Target the ones who had mobile but hadn’t tried the feature yet with a targeted nudge and an activation checklist.
Recruit the right users for research without the painful outreach process
Katie’s previous research recruitment process looked like most teams’: cold outreach, slow responses, and participants who didn’t match what she needed.
Targeting surveys to users who had already interacted with a specific feature changed the hit rate entirely. Every participant was relevant before the first question was asked.
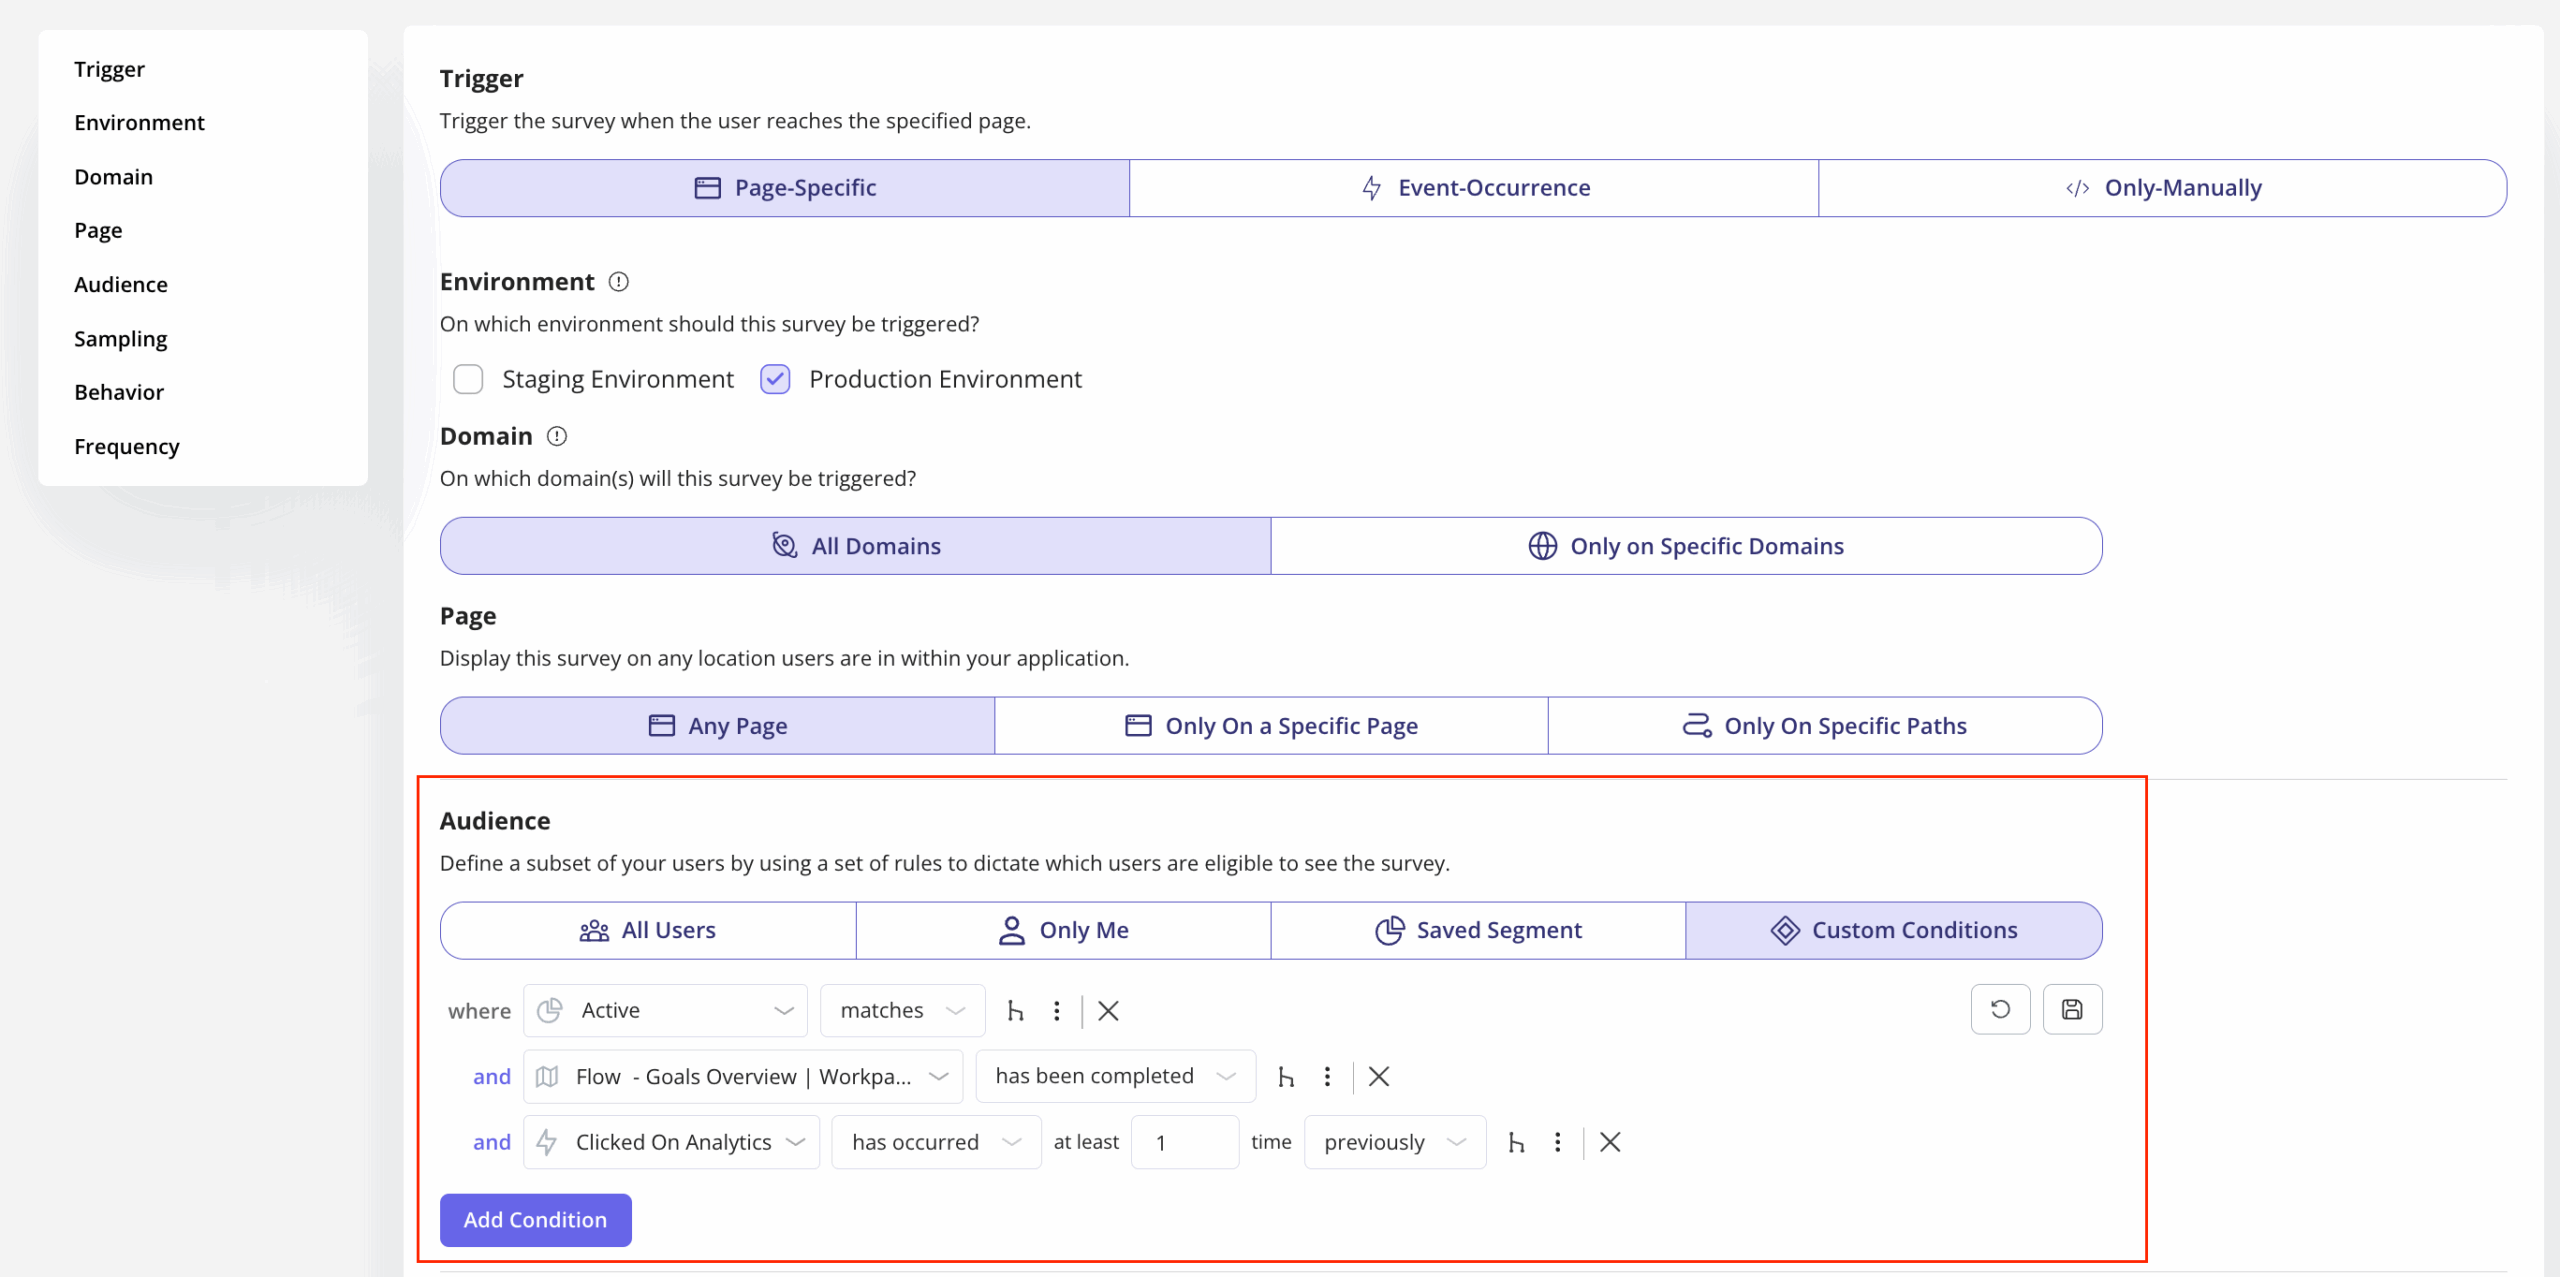
Amal Al-Khatib, our Product Designer, adds a practical layer to this: Userpilot’s survey conditions let her exclude users who have already participated in a previous round of usability testing.
Do you even need a product analytics tool in 2026?
It’s a fair question. AI agents can now query your data, surface anomalies, and generate insight summaries without a PM opening a single dashboard. So what’s the role of a dedicated product analytics platform when the analysis layer is increasingly automated?
The short answer: the tool matters more, not less. AI agents are only as good as the data they sit on top of. If your instrumentation is incomplete, your event taxonomy is inconsistent, or your data hasn’t been cleaned and validated, the agent surfaces confident-sounding answers built on bad foundations. Garbage in, hallucinated insight out.
There is no shortage of product analytics tools. There is a shortage of teams who use the right product analytics data to actually fix the problem: features get shipped, adoption doesn’t follow, and nobody has clear enough data to know whether the issue is the product or the onboarding.
Here’s how the main tools differ and which teams they actually serve.
| Tool | What it’s best at | Best for | Strength | Limitation |
|---|---|---|---|---|
| Amplitude | Behavioral cohort analysis at scale. Complex queries like “users who completed onboarding but haven’t used Feature X” in a few clicks. | Scaling SaaS | Best-in-class cohorts | Cost ramps fast. Steep learning curve. |
| Mixpanel | Event-based product analytics solution. 20M events/month free. Intuitive for PMs who want self-serve depth. | Mid-size teams | Affordable, intuitive | No in-app guidance. See the problem, can’t fix it here. |
| PostHog | Open-source, self-hostable. Analytics, session replay, feature flags, A/B tests, and surveys in one place. | Engineering-led teams | Everything bundled, generous free tier | Setup complexity. Needs engineering bandwidth. |
| Heap | Auto-capture removes manual event tagging. Define events retroactively (useful when you don’t yet know what to measure). | Early-stage teams | Fastest to get started | Slow queries at scale. Events need regular auditing. |
| LogRocket | Session replay alongside JS errors and network requests. Answers “product problem or technical problem?” directly. | Debug-focused teams | Connects behavior to technical errors | Narrow focus. Not a full analytics platform. |
| Google Analytics 4 | Web analytics and acquisition attribution. Free, widely understood, handles traffic source analysis well. | Teams starting out | Free, familiar, handles acquisition well | No behavioral product analytics depth. Cohort analysis and feature-level adoption require something purpose-built. |
| Gainsight PX | Product usage connected to account health, renewal risk, and expansion signals. | Enterprise CS teams | CS and analytics in one view | Less suited for pure product analytics work. |
| Userpilot | Connects insight to action in the same platform. A funnel drop-off triggers an in-app checklist, tooltip, or survey (no dev ticket needed). | Analytics + adoption | See the problem and fix it in one place | Not a pure deep-analytics tool like Amplitude. |
What none of these tools can replace is the judgment to know which question to ask and the discipline to interrogate the data before acting on it.
Where product analytics is heading
The two problems this article opened with: teams shipping features nobody uses, and not having the data to know why, are not getting easier. They’re getting harder. Here’s why, and what to do about it.
AI is moving analysis from descriptive to predictive
The traditional workflow: something happens, you notice it in the data, you investigate, you act, takes days or weeks. AI-assisted analytics compresses it: anomaly detection flags issues before you notice them, pattern recognition surfaces actionable insights without manual queries, and predictive models identify churn risk before it’s behaviorally visible.
Abrar describes what this shift means for PM time allocation: instead of spending hours going through reports, session replays, and working out why users aren’t interacting with a feature as expected.
“AI could monitor product health, highlight unusual patterns, analyze feedback, and give you next steps.”
That frees the PM to focus on strategic thinking and problem discovery rather than operational monitoring.
Amal makes the sharper point about why product-native AI matters more than general-purpose tools:
“Lia will be trained on your whole data, and it has the context of Userpilot — that’s what tools like ChatGPT lack. It doesn’t know the full context of your product and your data. Every time, you have to write a long prompt to give it context, and sometimes you still won’t get optimal results.”
That’s the real unlock: not AI as a bolt-on, but AI that already understands your product, your users, and your data and can surface the one or two insights worth acting on from the noise.
The agentic shift is breaking traditional behavioral metrics
As AI agents start using SaaS products on behalf of human users (through MCP integrations, APIs, and automated workflows), behavioral data starts to look different.
An agent completing a task doesn’t browse, hover, or scroll. It executes. DAU and session-length metrics built around human behavior will increasingly misread agent-heavy accounts.
The PMs who get ahead of this are already rethinking their event taxonomies to capture task completion and outcome quality, not just interaction signals.
FAQ
What is the difference between data analytics and product analytics?
Data analytics is a broad field used to interpret data across business functions. Product analytics is a focused approach to understanding in-product interactions, usage trends, and behavioral patterns within digital products. It helps product managers make informed decisions to improve the user experience and drive outcomes.
What are the 4 types of data analytics?
The four types of data analytics are: descriptive analytics (what happened), diagnostic analytics (why it happened), predictive analytics (what’s likely to happen), and prescriptive analytics (what action to take). These methods support smarter planning across product and business strategy.
What are the levels of product analysis?
Product analysis operates on three levels. User-level analytics track individual user interactions and retention. Feature-level analytics measure how users engage with specific features. Business-level product analytics connect usage data to revenue metrics, customer lifetime value, and overall growth impact.
About the author