User Behavior Tracking: Best Tools & Tracking Methods


Behavior tracking? And where do you start?
Search no further. In this article, I’ll cover what user analytics means, the right metrics to track, and the best tools in the market right now.
After reading this, you will be equipped to track user behavior on your website and app. More importantly, you’ll know what to do with the data you get.

What is user behavior?
User behavior describes all the actions a user performs on a website or mobile app. It includes user engagement factors like time on the page, the number of pages visited, how people interact with different features, and also friction they encounter while using the product.
What is user behavior tracking?
User behavior tracking is about digging deeper than surface-level analytics. You need to know why users interact with your product or website, not just what they’re doing. Standard analytics tools like Google Analytics show traffic and page views, but they leave the crucial ‘why’ unanswered.
This is where tracking user behavior data makes sense. By recording user actions—clicks, scrolls, form submissions—and analyzing the resulting data, you can uncover patterns and pinpoint friction points. This reveals the user’s journey, allowing you to optimize for conversions and improve the overall experience.
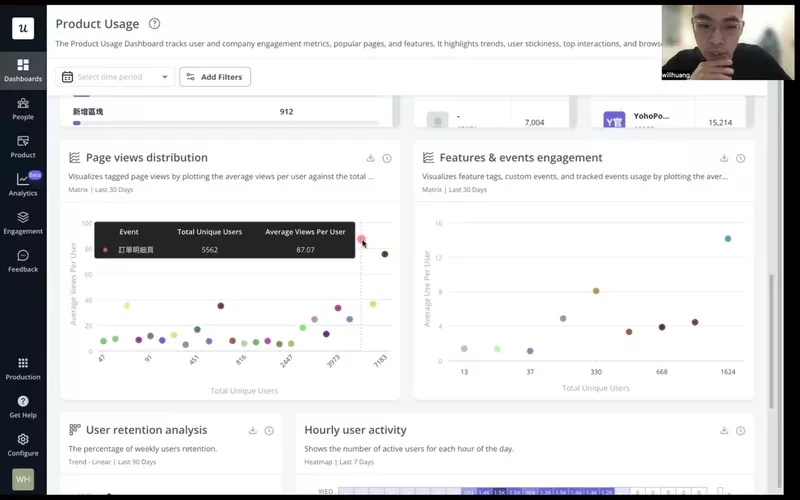
💡 For example, CYBERBIZ, during their admin panel redesign, needed to understand how users interacted with their interface. They used Userpilot’s product analytics to track page view performance, user interactions, and session durations. This revealed which features were most used and where users experienced friction, allowing them to make data-driven improvements.
Now, there’s a distinction worth noting: behavior analytics versus behavioral analytics vs user behavior analytics (UBA).
- Behavior analytics focuses on understanding and improving the current user experience, using observed actions;
- Behavioral analytics aims to predict future user behavior;
- User behavior analytics (UBA), often used in security contexts, analyzes user activity to detect anomalies and potential threats.
In the following sections, I’ll break down various user behavior tracking techniques and tools, enabling you to conduct effective user behavior analysis.
What are user behavior metrics?
User behavior metrics are analytics data that tell you how visitors engage with your website or app.
Key metrics to look out for as you track user behavior include:
- Conversion (turning website visitors into trial users, then into paid users, etc).
- Leading trial users to the “aha” moment and the activation point—the point where they instantly see how your tool makes life easier for them.
- User activation.
- Complete adoption.
Tracking each of these metrics tells you what points are flexible in the customer journey, places where users encounter friction, and what creates value for customers.
Types of user behavior analytics data you can track
There are different types of user analytics. I will go over three vital ones in this section and why I believe every product marketer should be tracking them.
Product and feature engagement tracking
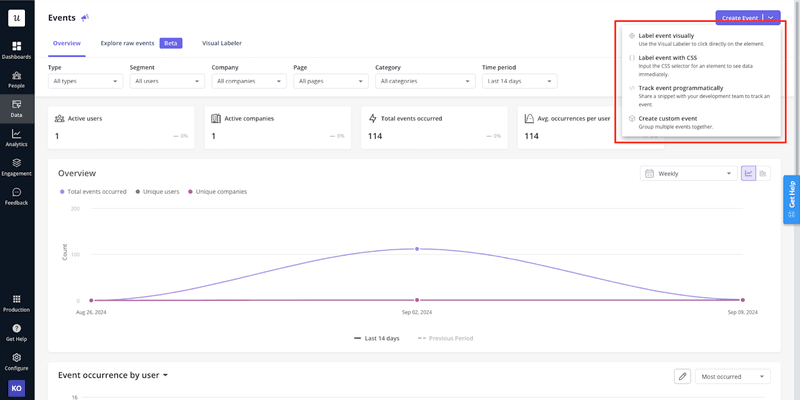
These are event-based analytics that track user interactions across the app and allow you to see which UI elements users engage with the most.
You’ll be able to track user interactions such as clicks, hovers, or inputs to get an accurate behavioral view of specific features.
User sentiment data
User sentiment data dives into the emotional landscape of your customers’ experiences, offering a deeper understanding of their feelings.
It uncovers the positive and negative emotions customers experience while using your product. It also collects valuable product improvement suggestions directly from the users.
By closely monitoring and evaluating user sentiment, businesses can pinpoint areas that delight customers and may require refinement. This feedback loop is crucial for driving product improvements and enhancing customer satisfaction.
Session replays
These are replays of user behaviors that you can watch to see what the users did in a specific session.
Session recordings can work well with product engagement analytics to provide more detailed information.
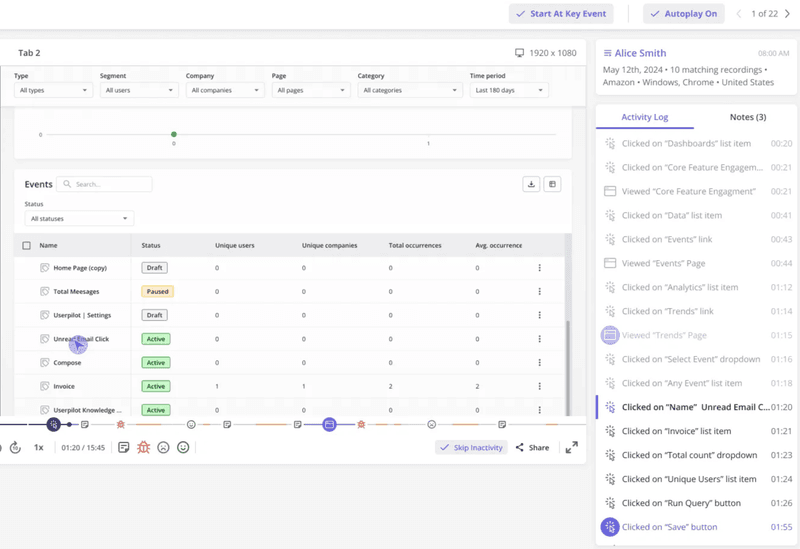
For instance, engagement analytics can tell how many product clicks happened per session, but session recordings make you see the reason for the clicks.
By watching those recordings and combining them with behavior reports, you can quickly identify rage clicks vs. normal clicks. The data will enable you to quickly know when there’s a bug or point of friction that needs urgent attention.
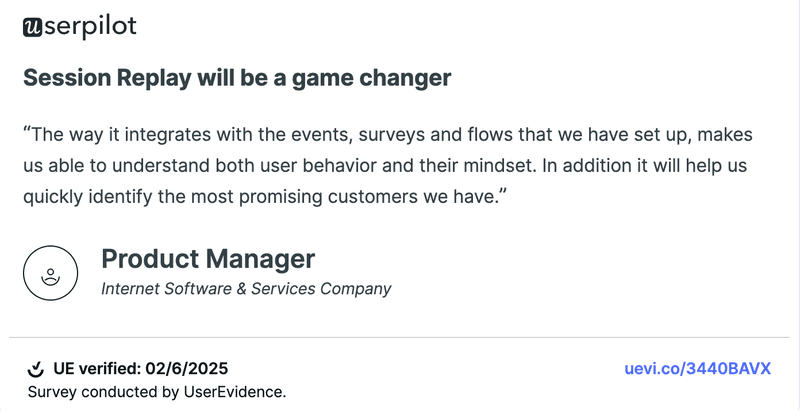
As our customer put it:
User experience analytics
This tracks customer experience on both your website and app with the end goal of enhancing usability.
There are two main types of user behavior insights to watch here:
- Qualitative attitudinal metrics: This uses factors like loyalty, usability, and satisfaction to measure how customers feel about your product. Customer feedback is an essential tool for measuring qualitative data.
- Quantitative behavioral metrics: This goes beyond user experience to measure how users interact with your product. Key product experience indicators here are retention rates, abandonment rates, churn rates, and task success.
So many factors make up the entire product experience that it can be hard to determine which to track.
Below are 7 of the most important user experience metrics to fix your gaze on:
- Customer satisfaction score
- Time per task
- Customer churn rate
- Customer retention rate
- User error rate
- Customer effort score
- Net Promoter Score (NPS)
How to analyze user behavior in SaaS
So far, we’ve discussed what user behavior tracking is and the different types and metrics to look out for.
We’ve also hinted at a few benefits of tracking user behavior. Below are more detailed benefits of taking intentional steps to analyze and understand user behavior.
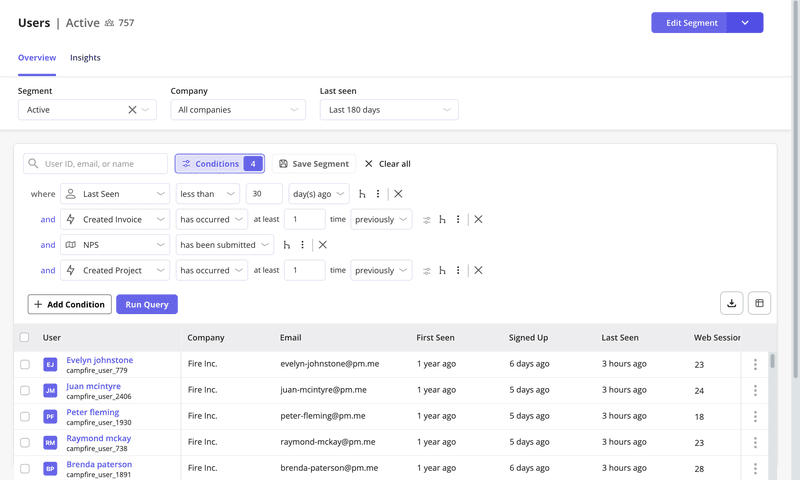
Understand what brings value to different users with segmentation
All things being equal, users will stick to a product if it solves their problem.
Tracking the features that customers spend the most time on will tell you what’s most valuable to them. You can use this information to enhance long-term product engagement.
For instance, segmenting users based on engagement makes it easier to understand what brings value to each user group.
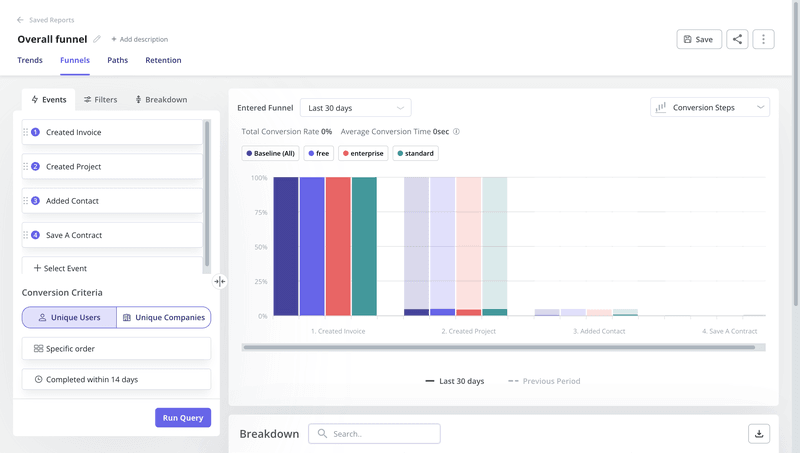
Identify friction points in the user journey with funnel analysis
Funnel analysis lets you keep track of your customers’ progress through different stages of the journey. With it, you can identify drop-off points and then investigate them to determine where obstacles lie in the user experience.
Combining funnel analysis with session recordings or interviews will help you understand why users are dropping off.
Done right, funnel analysis will help you make data-driven decisions and optimize your strategy to serve customers better.
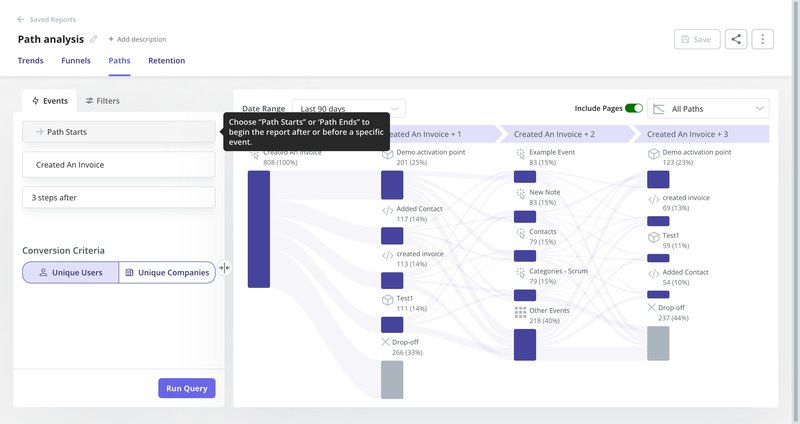
Use path analysis to identify the happy path
Since the customer journey does not always follow a linear path, funnel analysis isn’t a suitable method in many situations.
This is where path analysis comes in. It allows you to choose a starting point and examine the steps users take to (or from) that point to achieve a goal.
With it, you can examine all the existing paths users take inside your product and identify the one with the lowest drop-off rates.
Document the sequence of events involved in achieving successful outcomes to understand the process that helps users complete their goals.
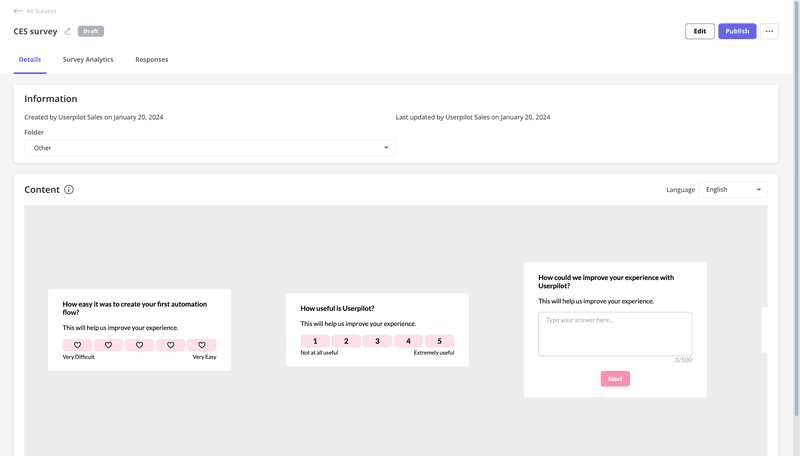
Analyze user experience with user feedback surveys
You can analyze data quantitatively and try to guess the whys behind user actions. But that’s nothing compared to hearing directly from the horse’s mouth.
There are different types of micro surveys used to collect user feedback at various points in the user journey:
- Onboarding surveys that collect data on users’ jobs to be done and help segment them;
- NPS surveys that measure customer loyalty to the brand;
- Customer satisfaction surveys measure how much a user is satisfied or dissatisfied at a certain point;
- Customer effort score surveys measure the perceived effort of a user when completing a specific task;
- Feature feedback surveys collect feedback on a feature’s usability and user experience.
Best tools for user behavior tracking
This section will cover three of the best tools to monitor and analyze user behavior.
We’ll go over features, who the product is ideal for, how much they cost, and their rating on Capterra and G2.
Userpilot: Best for in-app behavior tracking
Behavioral analytics help you understand how users engage with your product — what they do, where they drop off, and what keeps them coming back.
You can track in-app customer behavior on both mobile and web apps, without heavy setup:
- Autocapture automatically records feature clicks, page views, and other key actions — no manual tagging required. You get clean, ready-to-analyze data from day one.
- Session replay lets you watch real user sessions to see where they click, how they navigate, and where they get stuck — ideal for spotting usability issues and misunderstandings.
- Funnel reports help you track how users move through key workflows and identify the steps where they drop off.
- Trends reports show how behaviors evolve over time, broken down by device, location, signup date, and more.
- Path reports visualize the actual journeys users take through your app, helping you uncover common flows and friction points.
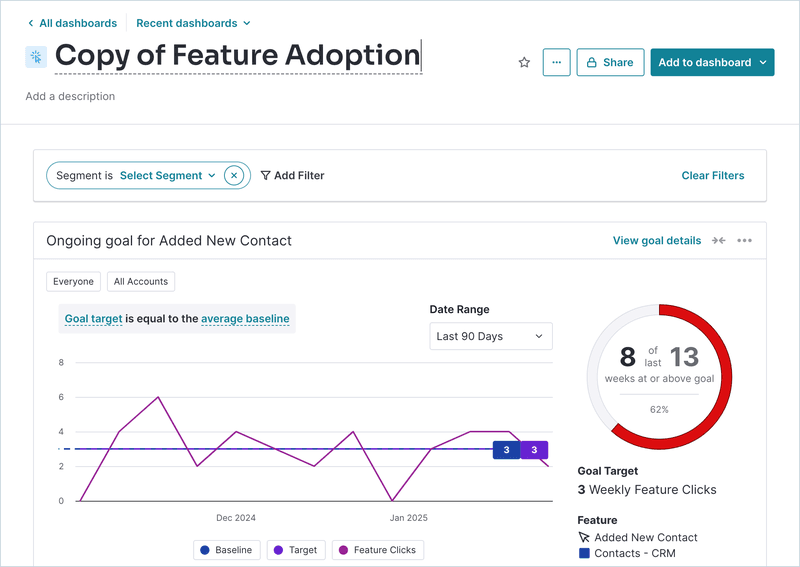
- Analytics dashboards give you a centralized view of core product metrics like activation, engagement, and retention.
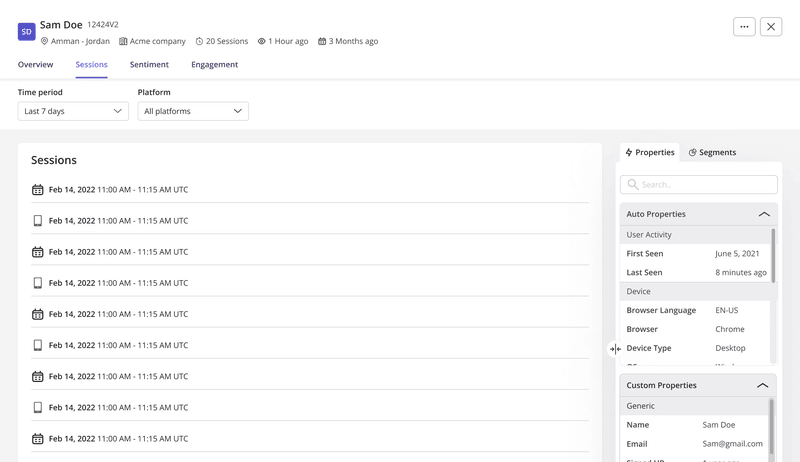
- User analytics let you zoom in on specific users or accounts, so you can see top events, pages, and sessions on an individual level to support customer success and proactive outreach.
Userpilot pricing
Userpilot’s transparent pricing ranges from $299/month on the entry-level end to an Enterprise tier for larger companies.
Furthermore, the entry-level plan includes access to all UI patterns and should include everything that most mid-market SaaS businesses need to get started.
Userpilot has three paid plans to choose from:
- Starter: The entry-level plan starts at $299/month (billed annually) and includes features like segmentation, product analytics, reporting, user engagement, NPS feedback, and customization.
- Growth: The Enterprise plan starts at $849/month (billed annually) and includes features like resource centers, advanced event-based triggers, unlimited feature tagging, AI-powered content localization, EU hosting options, and a dedicated customer success manager.
- Enterprise: The Enterprise plan uses custom pricing and includes all the features from Starter + Growth, plus custom roles/permissions, access to premium integrations, priority support, custom contract, SLA, SAML SSO, activity logs, security audit, and compliance (SOC 2/GDPR).
UXCam: Best for turning behavior insights into action
UXCam is a user behavior analytics platform built for mobile and web apps, helping teams quickly visualize and act on real user experiences.
With automatic event tracking, session replays, and journey mapping, UXCam makes it easy to uncover hidden friction points and optimize products without needing heavy manual setup or multiple tools.
It delivers both a high-level view of user trends and deep insights into individual user behavior to drive product improvements faster.
The main features of UXCam include:
- Automatic event capture: UXCam records key user interactions out of the box, helping you monitor critical events, spot trends, and optimize flows with minimal setup effort.
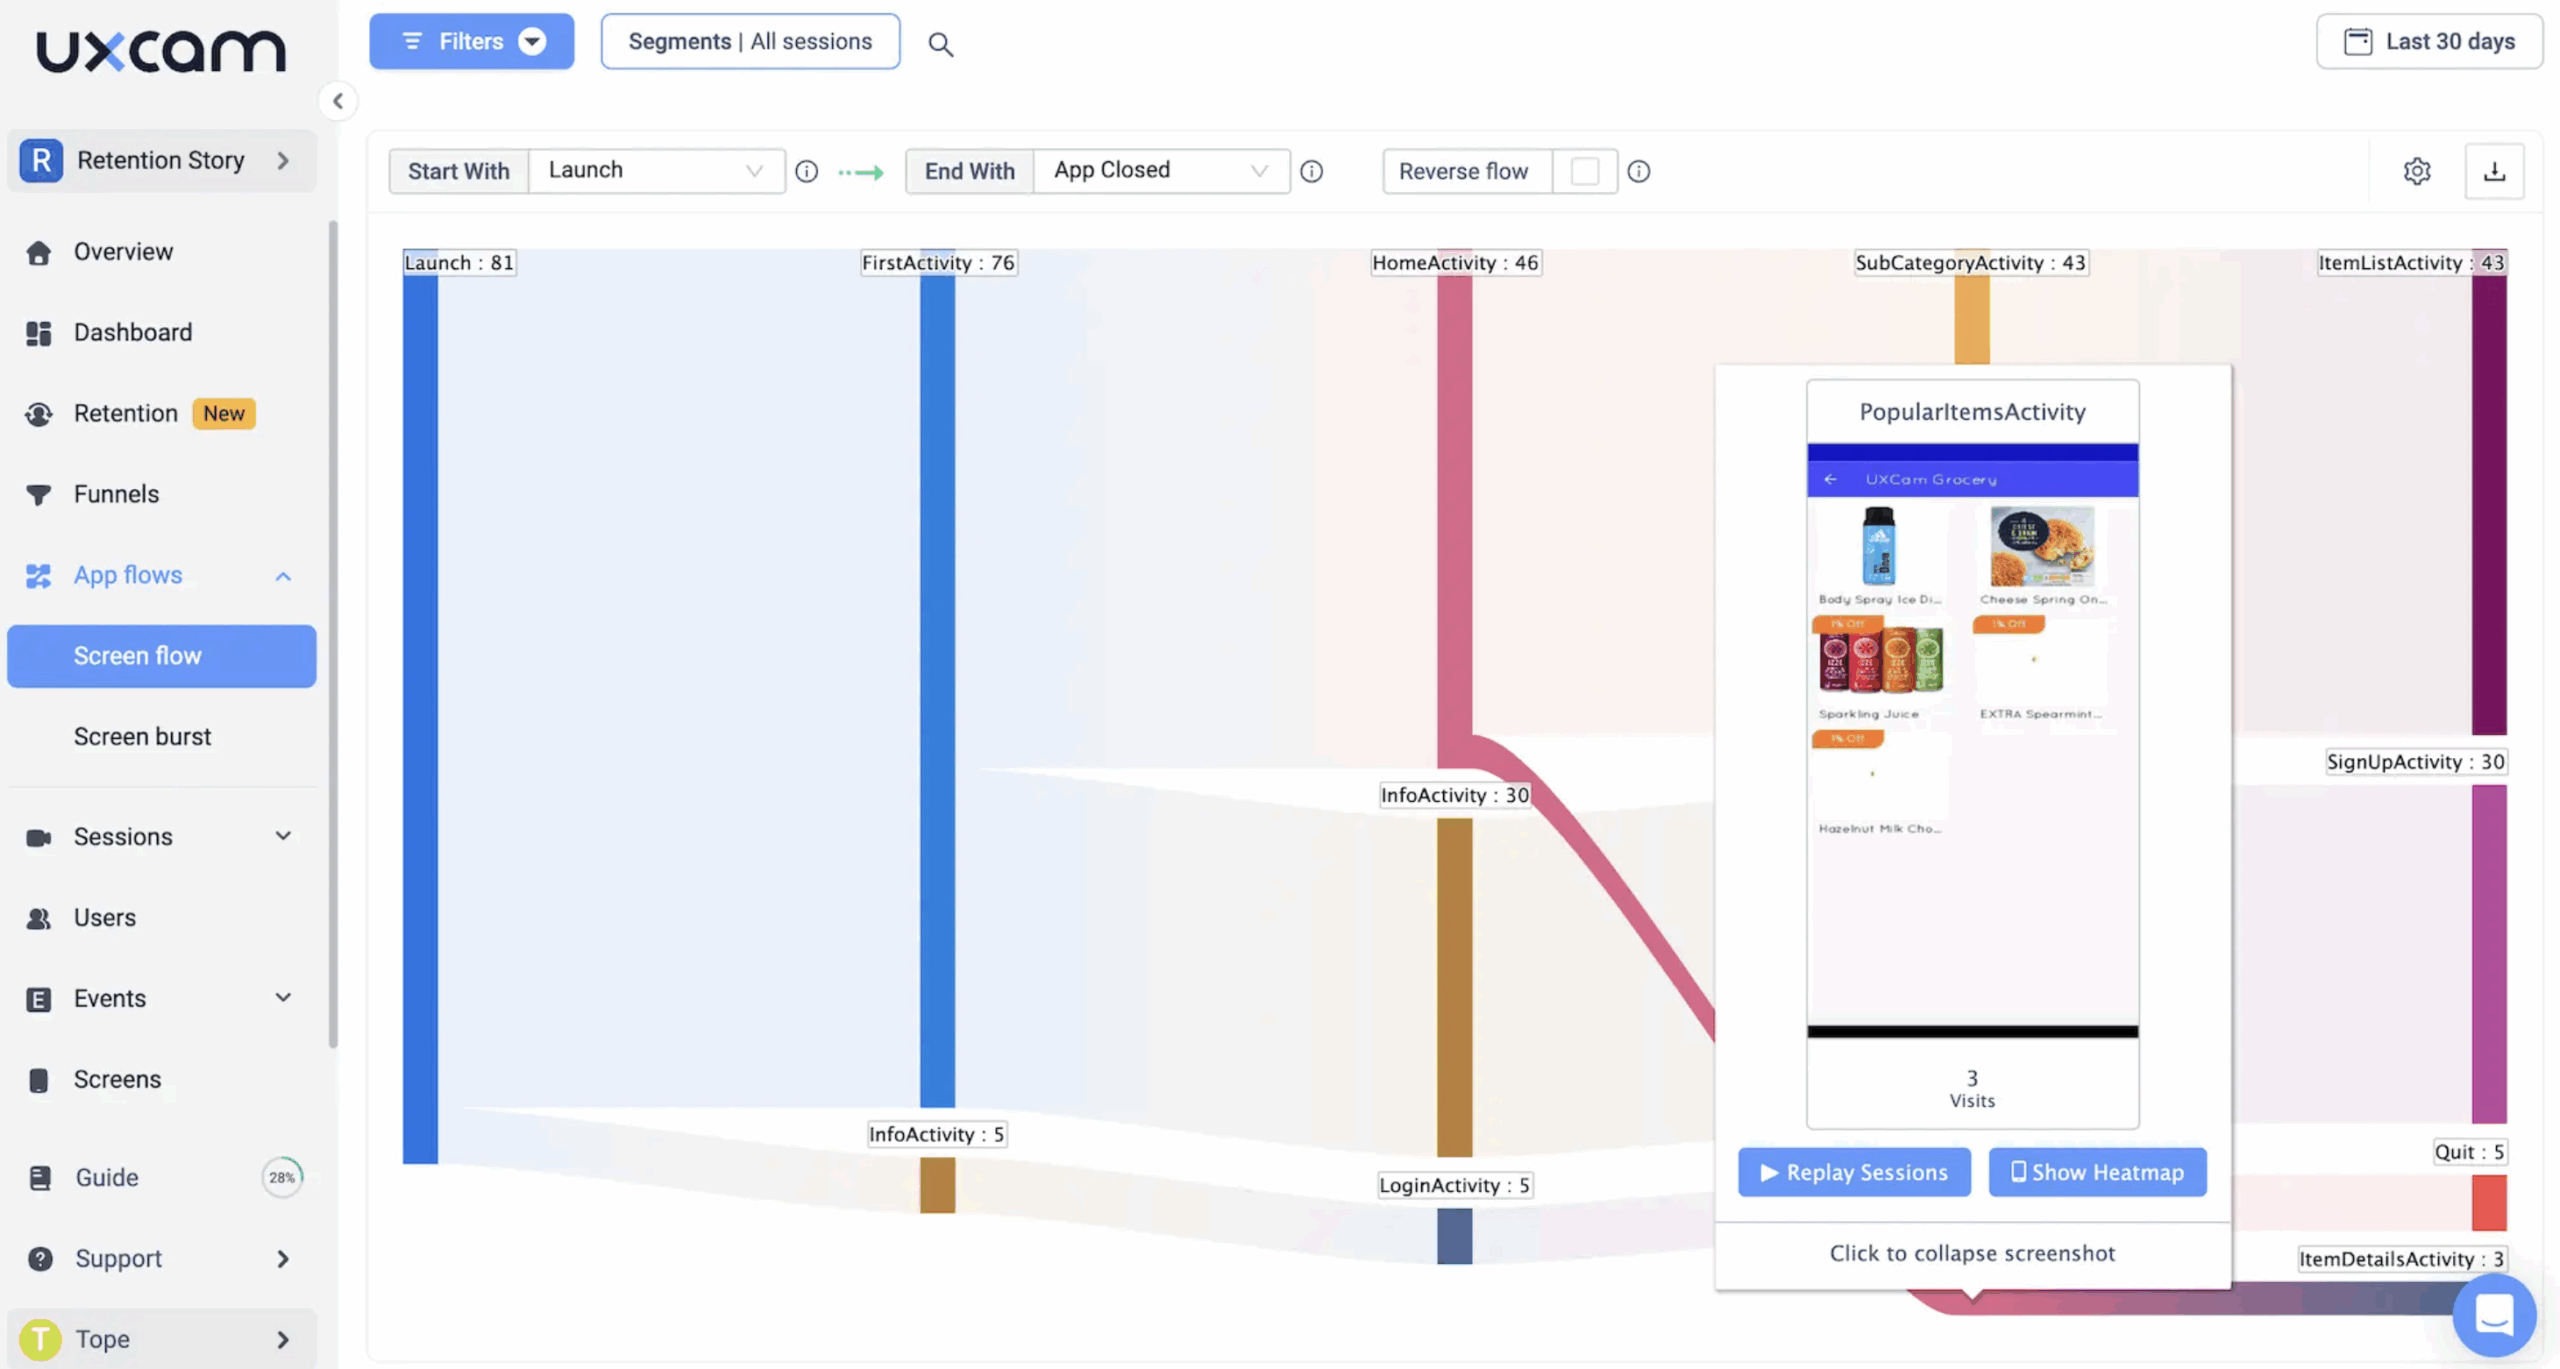
- Journey and funnel analysis: Visualize complete user journeys, discover where users drop off, and understand how behaviors vary across different segments and devices.
- Session replays and heatmaps: Watch real-time replays of user sessions and view mobile gesture heatmaps to directly observe usability challenges and improve the user experience.
UXCam pricing
UXCam offers a free plan for up to 3000 monthly sessions. They also offer a Starter plan that covers essential analytics and session replay for smaller teams. To unlock advanced features like funnels, retention analysis, and anomaly detection, you can upgrade to Growth or Enterprise plans.
Growth and Enterprise plans come with flexible, custom pricing and provide full access to advanced user behavior analytics, journey mapping, and secure data management.
Amplitude: Best for customer journey mapping
Amplitude is a product and website analytics tool that’s great for customer journey mapping.
Its combination of brilliant analytics features, like user interaction and time-on-site tracking, makes it a good choice for identifying users in real time.
Amplitude’s secure data governance makes sure user data is safe by using randomly generated IDs to represent real users.
The main features of Amplitude include:
- Event segmentation: Amplitude enables you to track and visualize user interactions in your product easily. See which events are most performed, analyze how many users complete certain events, and create charts to visualize your findings.
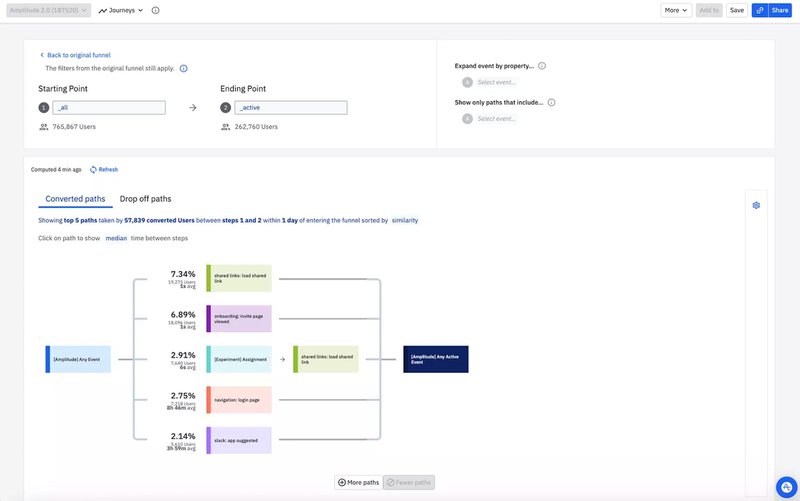
- Customer journey visualization: Gain visibility into your different user journeys. You can check individual user paths and view the most common sequence of events completed by users.
- Retention analysis: Calculate user retention data using pre-specified events and compare retention rates over time using a simple retention chart.
Amplitude pricing
Amplitude has a starter-free plan that includes core analytics and unlimited events tracked for up to 100K Monthly Tracked Users. To get access to more in-depth analytics like cohorts, journeys, and retention prediction, you’ll need a Growth or Enterprise plan.
Growth and Enterprise plans come with custom pricing and give you access to advanced features and real-time monitoring for analyzing user behavior.
Hotjar –Best for session recordings
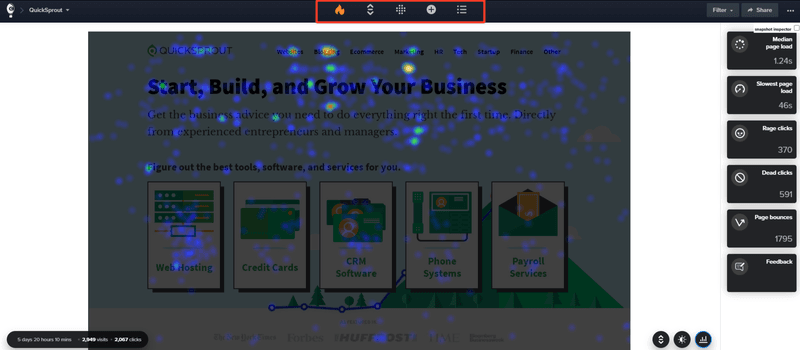
What makes Hotjar stand out is its focus on visual data. The tool uses heat maps and session recordings to show you real-time users’ behavior flow on your mobile app or web page.
Both beginners and experienced teams will find Hotjar useful for analyzing websites and product usage.
The analytics tool has a wide range of applications aside from its ability to directly monitor user behavior, so designers, marketers, and customer experience teams will find use cases for it.
Here are some of the main features of Hotjar:
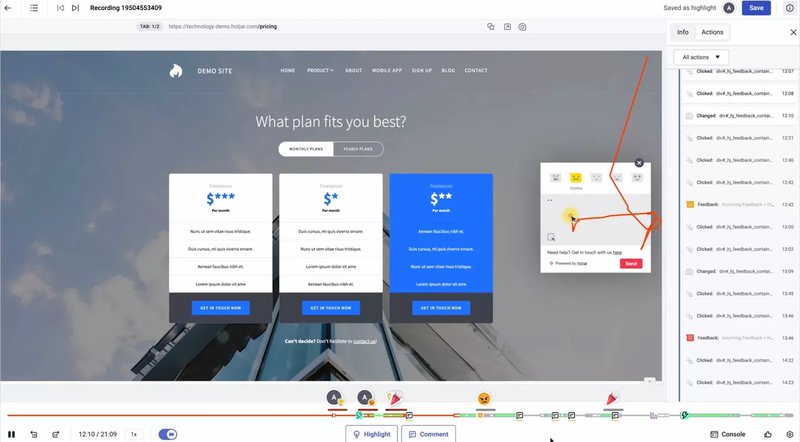
- Session recordings: Hotjar provides real-time recordings of users’ and website visitors’ sessions. You can see how they scroll, where they click, and how they progress from page to page.
- Heatmaps: Hotjar aggregates these session recordings into heatmaps showing which parts of your web pages users are interacting with and which features they miss.
- Feedback collection: Directly ask users what they think about your website. You can create surveys, send survey invitation links to customers, or launch feedback campaigns on the site.
Hotjar pricing
Hotjar has 3 pricing tiers, including a free forever tier:
- Basic: This forever-free tier supports up to 500 daily session recordings and unlimited heatmaps.
- Business: Starting at $80/month, you get support for 500 daily sessions, custom integrations, and more.
- Scale: Designed for enterprise users, this plan starts at $171/month for 500 daily sessions. It supports funnel analysis, trend analysis, and more.
Pendo: Best for mobile user behavior tracking
Pendo is one of the best tools on the market for tracking the behavior of mobile users.
Here are the Pendo features you can use to track user behavior:
- Funnel charts: Pendo’s funnel reports show you the number of users that enter a funnel, the percentage that completes each stage, and the average completion time. You can also see the overall conversion rate, which helps you identify any underperforming user funnels.
- Retention analysis: The Retention dashboard can show you the percentage of each cohort that’s retained on a month-to-month basis. This will help uncover any behavioral patterns between cohorts and make it possible to perform a correlational analysis as well.
- Path reports: Pendo’s path reports help you visualize the paths that your users take when coming from a certain page. You can share these reports with other people on your team, zoom in on each step to get deeper insights, or download the path chart as a CSV file if needed.
Pendo pricing
Pendo offers a free-forever plan for up to 500 monthly active users, which includes basic analytics and in-app guides, though branding and feature limits apply. The Starter plan starts at around $7,000/year for 2,000 MAUs and unlocks features like NPS analytics, but still excludes advanced integrations and support.
Beyond that, things get murky. Pendo’s Growth and Portfolio plans don’t have public pricing — they’re entirely quote-based. According to Vendr on Pendo pricing, customers typically pay anywhere from $17,000 to $132,000 per year, with a median around $47,000.
Want to track more than one app (say, web and mobile)? You’ll need the Portfolio plan. Also worth noting: implementation fees can run high, and renewals often come with 5–10% price uplifts unless you negotiate them down.
Crazy Egg – Best heatmap analytics software
Crazy Egg is an easy-to-use user behavior analytics tool focused on heatmap analysis. With this tool, you can investigate buyers’ journeys on your website, identify usability issues, and test new options to see how they perform.
Crazy Egg’s main features include:
- Heatmaps: Crazy Egg uses heatmaps to help you see which parts of your page receive the most and least attention. You can also compare the performance of different web pages by comparing their heatmaps.
- Reports: In addition to heatmaps, Crazy Egg supports other forms of data visualization reports, including scrollmaps, confetti, overlay, and list reports. They track user behavior analytics through clicks, scrolls, and other pattern insights.
- Recordings: Record user sessions and replay them to see users’ interactions with your website. These recordings also help you see what motivates visitors to stay on or leave a page.
Crazy Egg pricing
Crazy Egg offers five paid plans (from Basic’s $29/month to Pro’s $249/month). Should you need more than their typical offering, you can build your subscription plan with Enterprise (at $499/month). You can also get a free 30-day trial for every plan.
Try Userpilot for user behavior tracking!
User behavior tracking is an excellent method for boosting product experience and increasing your retention rates, among other benefits.
As we’ve discussed earlier, incorporating both quantitative and qualitative analytics will give you better results than choosing just one approach. There are many tools on the market to help you with this.
Want to get started with user behavior tracking? Get a Userpilot Demo and start seeing how users are interacting with your tool.
About the author