Product Adoption in 2026: A PM’s Playbook for the Agentic Era


Hi, I’m Abrar Abutouq, a Product Manager at Userpilot, and most weeks I’m debugging at least one product adoption problem inside our own product.
A few months ago I shipped an email feature I was proud of. Two weeks later, the analytics told a story I didn’t expect: plenty of customers had access, almost none had set up a domain. The adoption I assumed would happen on its own had stalled on a single technical step. (Full debugging story below, with the fix I shipped that week.)
That’s adoption work in 2026. Less “build a great feature and watch users find it.” More “watch the funnel show me exactly where it dies, then ship the in-app fix before anyone files a support ticket.”
Two things have changed about that work in the last six months. Features are shipping faster than humans can land them: AI now writes a meaningful share of the code our engineers commit, and a release that used to take me three months now goes live in two weeks. And a second user class has arrived: AI agents using SaaS through MCP. They execute tasks. They don’t click, scroll, or fire the events most analytics tools were built around.
Both shifts break the same thing: the funnel model of product adoption that the rest of the internet’s adoption guides still teach. The funnel was designed for a single user class doing a predictable set of actions at a predictable pace. Neither half of that assumption holds anymore.
I wanted to write something more useful than another templated adoption guide. So instead of writing it alone, I sat down with three people I work with daily: James Mitchinson, our Head of Customer Success; Kevin O’Sullivan, our Head of Product Design; and Yazan Sehwail, our CEO. This post does four things:
- Defines product adoption the way I actually use it in 2026, cleanly separated from activation.
- Walks through the measurement maturity ladder sourced from James.
- Names the two metrics I’ve stopped using and the two new signal streams I’ve started tracking, with the agentic reframe Yazan is steering Userpilot toward.
- Shows the playbook I run when adoption stalls, with three real debugging stories from inside Userpilot (including one where Kevin’s team almost killed a feature before they watched the sessions).
Product adoption in 2026 – Summary:
For those of you who don’t have the time to read (or your agents 😅), here’s a quick summary of this post:
The new definition of product adoption
- Product adoption is the work of getting users to repeatedly experience value, not the work of getting them to sign up or activate. Those are upstream stages.
- In 2026, “users” includes a growing share of AI agents calling your product through MCP. They produce a different signal set than humans, and most analytics dashboards are blind to it.
- Feature velocity has roughly tripled because of AI-assisted development. The adoption gap has widened, not closed.
- Wes Bush, founder of ProductLed, has been tracking this as the PLG 1.0 to 2.0 to 3.0 transition. Adoption looks different in each era. Most teams are operating in PLG 1.0 with a 2026 problem.
The triage I run when a feature isn’t getting adopted
- Funnels first to find the where: Drop-off between steps is the most reliable signal you have.
- Session replay for the why: Watch 20 to 30 sessions for the friction step. Don’t react to one.
- In-app survey at the friction point: Asks the user to state the blocker in their own words.
- Fix in-app first: A checklist or a contextual nudge can resolve 60 percent of adoption gaps without an engineering ticket.
The two metrics I’ve stopped trusting
- DAU/MAU ratio: Optimizes for repeat logins, not for outcomes. A customer who logs in three times a week and never finishes a task is not adopted. James from CS has the sharpest version of this: “high logins, zero outcomes.”
- Raw session length: AI-assisted users finish faster. Agents finish in milliseconds. Longer sessions used to be a positive signal. In 2026, they’re often a friction signal.
Readiness checklist: Is your adoption motion ready for 2026?
- Can you tell adoption from activation in the same dashboard? If they’re in one “engaged users” bucket, you can’t diagnose either.
- Do you have a funnel for every shipped feature? If not, you’re flying blind on half the team that just released something.
- Are you watching sessions at the friction step before you brief engineering? Most “adoption problems” are onboarding problems you can fix in-app.
- Have you started tracking task completion alongside event counts? Agent users need an outcome metric, not a click metric.
- Do CS and product see the same adoption signals? James’s team and ours look at the same dashboards. That alone changes the conversation.

Product adoption in 2026: What’s changed and what hasn’t
The core definition still holds. Product adoption is the process by which users discover a product, understand its value, reach activation, and integrate it into their routine. It covers everything from first awareness through long-term retention, and it’s the strongest single predictor of SaaS revenue health.
What’s changed is the texture of every word in that definition.
“Users” now includes AI agents. Wes Bush, founder of ProductLed, has been tracking what he calls the move from PLG 1.0 (human-led product onboarding) to PLG 2.0 (AI-assisted onboarding) to PLG 3.0 (agent-to-agent commerce). Most adoption playbooks are still written for 1.0. Kyle Poyar at OpenView has reported that 27 percent of AI app spend now flows through PLG motions, roughly four times the rate of traditional SaaS. The motion got faster, the product got smarter, and the user got a teammate.
“Discover” looks different, too. Elena Verna’s recent writing on agentic onboarding makes the point that in many products, the first session is no longer a human exploring. It’s an agent setting things up on a human’s behalf. The “Aha!” moment lives somewhere else now.
And “value” is the term I’ve reframed hardest. James Mitchinson, our Head of CS, put it to me plainly when I was reporting this piece: A customer can be logging in every day, hitting every event you track, and still get zero outcomes from the product. That customer is not adopted. They’re active. The two are not the same.
What hasn’t changed is the underlying job: get users (human or otherwise) to a state where the product is part of how they get work done. Everett Rogers’ five attributes of adoption (relative advantage, compatibility, complexity, trialability, observability) still describe why some products spread and others stall. They’ve held up for sixty years. What’s new is which of them breaks first in 2026: trialability has been collapsed by freemium and AI-assisted setup, observability has been amplified by social proof, and compatibility now has to account for AI agents in the user’s existing workflow. Everything below is how I work each of these levers as a PM.
Product adoption vs. product activation
Product activation and product adoption sit next to each other in every PLG funnel, which is exactly why teams (including mine, at times) collapse them into one bucket. They’re different work, owned by different people, measured on different time horizons. Mixing them up is the most common reason adoption dashboards lie.
| Aspect | Product activation | Product adoption |
|---|---|---|
| Definition | The moment a new user first experiences real value (the “aha moment”). | The ongoing process where users repeatedly get value and integrate the product into their workflow. |
| Stage in the journey | Early: immediately after signup or onboarding. | Later: after users have activated and begin using the product consistently. |
| Goal | Help new users quickly reach meaningful value. | Turn activated users into long-term, habitual customers. |
| Measured by | Activation rate, time-to-value (TTV), and onboarding completion. | Feature adoption, retention cohorts, task completion, and expansion revenue. |
| Time horizon | Short-term (minutes to days). | Medium- to long-term (weeks to months). |
| Signals | First project created, first file uploaded, first integration connected. | Repeated usage, deeper feature exploration, stable or increased activity over time. |
| Ownership | Growth PMs, onboarding teams. | Product teams, customer success, lifecycle marketing. |
Why these two concepts get confused:
- Both relate to value: Teams often assume that once users experience value for the first time (activation), they’ll continue experiencing it over time (adoption). That assumption is rarely true without intentional product guidance.
- PLG funnels place the two stages side by side: Activation and adoption appear consecutively in funnels like Signup -> Activation -> Engagement -> Retention. Dashboards often merge them into one “engaged users” category, even though they represent different levels of commitment.
- Both are now under pressure from agents: An agent can “activate” a product in seconds by completing a setup task on a human’s behalf. That tells you nothing about adoption. Activation that bypasses the human user is not the same as adoption you can build on.
The product adoption process (still six stages, with one big update)
The product adoption process still moves through six stages from first discovery to long-term engagement. Some sources collapse it to five (awareness, interest, evaluation, trial, adoption); I keep activation as its own stage because the work of getting a user to the aha moment is materially different from the work of getting them to come back.
Whichever count you use, the customer journey is the same. What’s new in 2026 is that every stage now has a human flavor and an agent flavor, and the tactics to influence product adoption are different for each.
| Stage | What it is | Goal at this stage | Common tactics |
|---|---|---|---|
| 1. Awareness | The moment a user (or their agent) first discovers your product through marketing, referrals, research, or an MCP server listing. | Communicate the problem your product solves and spark curiosity. | Paid ads, SEO content, social proof, comparison pages, clear positioning, MCP server presence. |
| 2. Interest | The user begins exploring your product to understand whether it might fit their needs. | Make it easy for prospects (and the agents researching for them) to learn about your product and its value. | Landing pages, demo videos, feature explanations, pricing clarity, user education, machine-readable docs. |
| 3. Evaluation | The user compares your product to alternatives and decides whether it’s worth trying. | Reduce friction and eliminate doubts that block signups. | Free trials, transparent pricing, case studies, live demos, competitor comparison pages. |
| 4. Trial | The user gets hands-on with the product for the first time. Increasingly, an agent does this on their behalf. | Guide users quickly to their first moment of value. | Onboarding checklists, interactive walkthroughs, welcome surveys, contextual tooltips, simplified setup flows. |
| 5. Activation | The user reaches their “aha moment” and clearly experiences value. | Shorten time to value and drive users toward the activation milestones that matter. | Personalized onboarding paths, action-triggered guidance, goal-based checklists, contextual help. |
| 6. Adoption | The user repeatedly returns and integrates the product into their workflow (or trusts the agent to integrate it for them). | Build long-term engagement and reinforce recurring value. | Feature discovery prompts, usage nudges, lifecycle messaging, secondary onboarding, advanced tips, in-app surveys, NPS. |
The maturity ladder of product adoption measurement
When I asked James how he thinks about catching at-risk accounts before they churn, his answer was a maturity ladder. Most CS and product orgs sit on a rung of it, and the rung you’re on determines what kind of adoption work you can actually do. I think it applies just as well to product teams measuring feature adoption as it does to CS teams managing accounts.
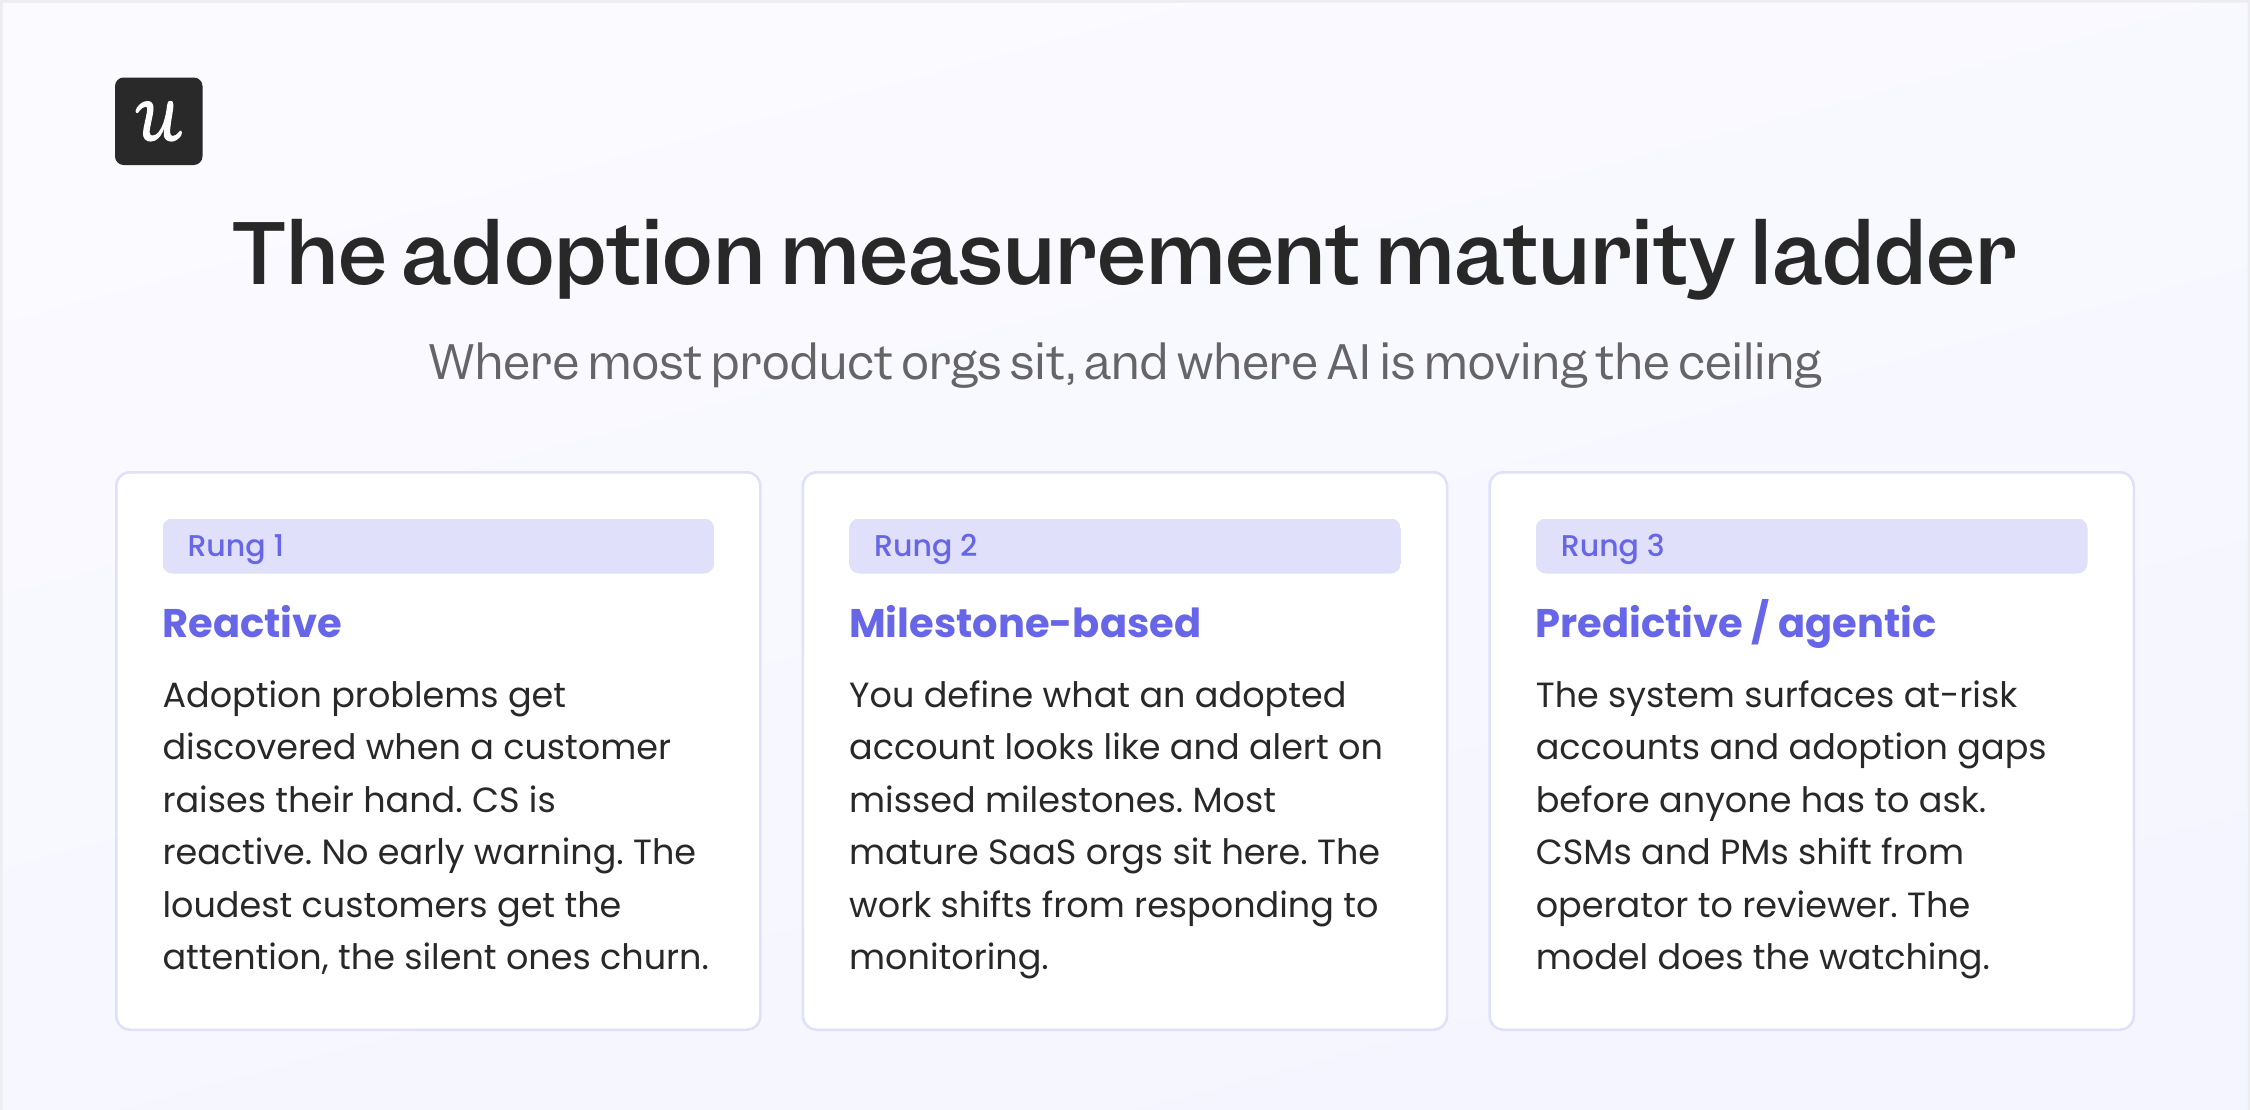
Rung 1 is reactive
Adoption problems get discovered when a customer raises their hand. Tickets go up. CS gets the call. Product finds out a feature isn’t landing because someone tweeted about it. This is where every immature org starts, including ours, years ago.
The problem with reactive monitoring is that the customers who eventually churn aren’t always the loud ones. James gave me the canonical example of this: “If a customer has a lot of tickets, it can look like they have concerns about the platform. But an even bigger indicator of churn risk is when a customer is submitting tickets, and then suddenly that stops.”
Rung 2 is milestone-based
You define what an adopted account looks like (published a flow, set up a dashboard, completed setup), and you alert on accounts that miss the milestones. This is where most mature SaaS orgs sit. It’s a real upgrade from rung 1 because you can act before the customer raises their hand. James again: “If a customer has not engaged with a particular part of our platform, like installing the Chrome extension or having published a flow, those can be great early signals that there are problems.”
Rung 3 is predictive
The system watches usage patterns across thousands of accounts, learns what correlates with churn (or with successful adoption), and surfaces accounts that fit the at-risk profile before the CSM has to ask. This is the rung Userpilot is moving onto right now with Lia, our AI agent.
Yazan Sehwail, our CEO, described the design intent to me as inverting the workflow: “You no longer have to worry about monitoring, building the reporting, building the dashboard. It’s all being done for you, automatically.” The CSM (or the PM) shifts from operator to reviewer.
One honest note from James about all of this. He told me the hardest part of the rung-3 work, even with AI, isn’t building the model. It’s defining what an “adopted” customer actually looks like for a product as broad as Userpilot. “Is it that the customer’s published a flow, or set up a dashboard, or launched the resource center, or watched a session replay? There’s a million different things you could look at, and our product usage measures are not always ideal.”
If you can’t define adoption for your own product, no model on earth is going to predict it for you. The work of writing the definition is the work.
The metrics that matter for product adoption in 2026 (and two that are starting to break)
Most adoption posts list the same dozen metrics. I’ll list them too, because the basics still work. Then I’ll be direct about the two I’ve stopped trusting.
The metrics that still earn their place:
- Adoption rate: Shows the percentage of users who begin using your product or a specific feature. Formula: (users who adopted / total eligible users) × 100.
- Activation rate: Measures how many new users reach their first meaningful value moment. Formula: (activated users / total new users) × 100.
- Time to value (TTV): Tracks how long it takes new users to experience value for the first time. Formula: average time between signup and activation.
- Feature adoption rate: Indicates how many users use a particular feature. Formula: (active users for the feature / total eligible users) × 100.
- Customer retention rate: Shows the percentage of users who continue using your product over time. Formula: (users active at the end of the period / users active at the start) × 100.
- Churn rate: How many users stop using your product over a specific timeframe. Formula: (users lost during the period / users at the start of the period) × 100.
- Customer lifetime value (CLV): Estimates the total revenue a customer generates over their relationship with your product. Formula (SaaS): ARPU / churn rate.
- Net revenue retention (NRR): How revenue from existing customers grows or declines over time. Top SaaS performers hit 115 to 125 percent NRR, per SaaS Capital’s benchmark data; the median sits around 102 to 106 percent.
- NPS, CSAT, CES: The qualitative side of adoption. Necessary, not sufficient.
Two new metrics I’ve started tracking in 2026:
- Task completion rate (separated by human and agent users): The share of users (or agent sessions) that finish the workflow they started. This is the metric that survives the agent-era reframe, because it measures outcomes, not clicks.
- Time-to-second-value: Time from activation to the second value moment. Olga Berezovsky has written that the second value moment is the strongest predictor of long-term retention, more so than the first. If your TTV is fast but your time-to-second-value is missing from the dashboard, you’re tracking signup quality, not adoption.
Two metrics worth deprioritizing:
This is the part of the post most adoption guides won’t write. Some of the metrics in the standard PLG toolkit are starting to misread accounts in 2026. The two I’ve personally stopped relying on as primary adoption signals:
- DAU/MAU ratio: Built to measure stickiness in consumer products where login frequency correlates with value. In B2B SaaS, especially in 2026, that correlation is breaking. A user who logs in once a week to run a high-impact workflow is more likely to adopt than one who logs in daily to check a dashboard they ignore. James’s “high logins, zero outcomes” account is the worked example: the team intervened only because they were watching outcomes, not login counts. Watch DAU/MAU if you want, but don’t make a roadmap decision on it.
- Raw session length: Used to be a positive signal (“users are spending time in the product”). In an AI-assisted era, longer sessions are increasingly a friction signal: someone is stuck, an AI is taking too long to complete a task, or the workflow has more steps than it needs. Agent sessions are measured in milliseconds, and lumping them in distorts the average either way. Replace it with task completion rate, and you’ll be looking at the same surface from a more honest angle.
How to measure product adoption: The triage I actually use
The standard answer to “how do you measure product adoption” is a list of dashboards. The honest answer is that measurement is half the work. The other half is the triage you run when a metric flags a problem. This is where most teams give up too early, because the dashboard tells you what’s broken but not why.
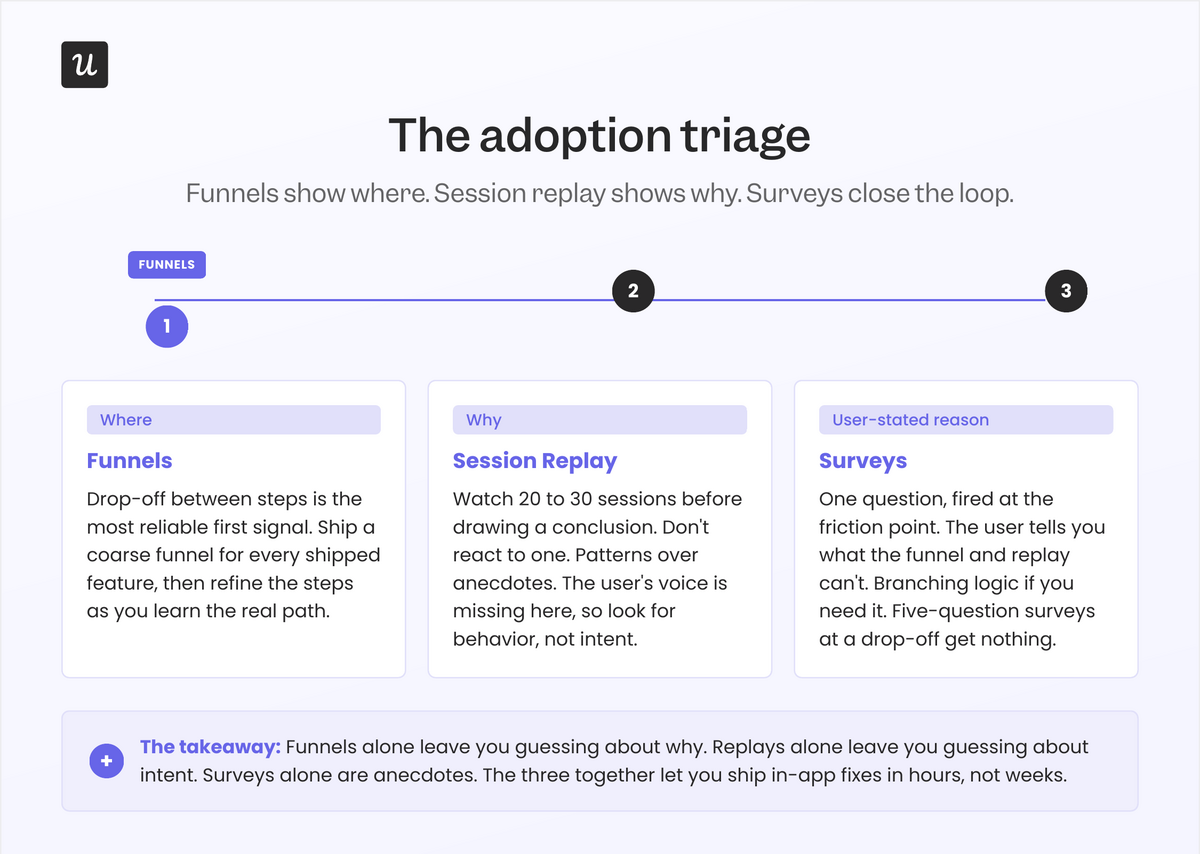
Here’s the triage I run, sourced from how our product and design teams actually work. The pattern is the same one Kevin O’Sullivan, our Head of Product Design, codified for the broader analytics workflow: funnels show where, session replay shows why, surveys close the loop with user-stated reasons. Three tools, three different angles on the same problem.
Step 1: Funnel report (where the drop-off is)
Set up a funnel for every shipped feature. For most features, that’s a 3 to 5 step funnel from “user has access” to “user completes the core task.” Don’t try to build the perfect funnel on day one. Ship a coarse version, then refine the steps as you learn what the real path is.
- Use Raw Events Auto-Capture so Userpilot is tracking clicks, form submissions, and inputs from day one without manual instrumentation.
- Convert captured raw events into labeled events (e.g., “Published Flow”, “Invited Teammate”) for the funnel steps.
- Use Tracked Events (via API) for backend-driven actions the front end won’t surface (e.g., webhook fired, domain verified).
- Set up a Paths report alongside the funnel. Funnels show the linear path you expected. Paths show what users actually do, which is usually different.
The funnel is the most reliable first signal you have. When I shipped Userpilot’s email feature, the funnel showed the drop-off between “feature access granted” and “domain verified” within hours. The decision wasn’t whether the feature was broken; it was where in the setup the friction lived. The funnel narrowed the search.
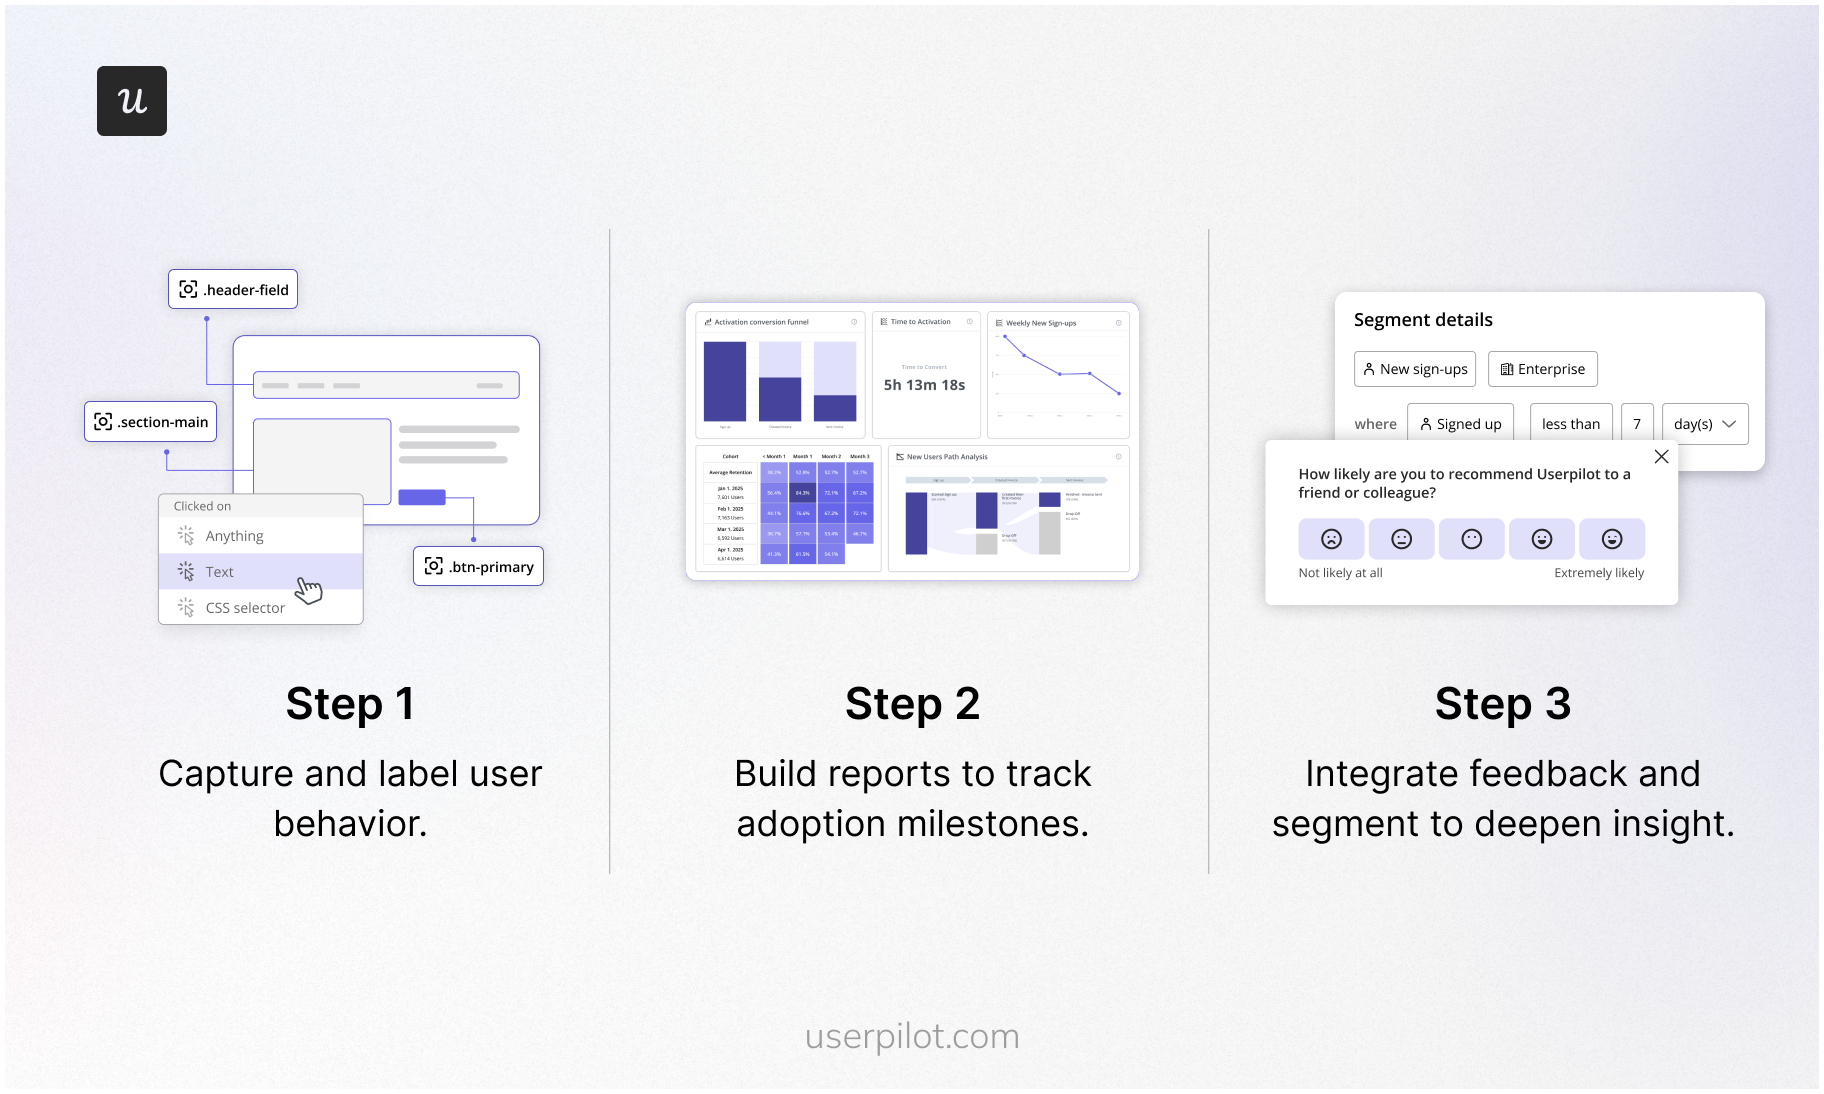
Step 2: Session replay (why the drop-off is happening)
Once the funnel narrows the search to a specific step, watch sessions. Don’t react to one. Kevin made this point to me when I was reporting the piece, and it stuck: “One of the challenges with session replay is the skill of spotting patterns and not zoning in on just one session and having that influence you. Session replay is devoid of the user’s voice. Trying to have that skill of watching many sessions and seeing patterns is where AI is going to be incredibly powerful.”
His rule of thumb: 20 to 30 sessions before you draw a conclusion. The example he gave was the event occurrence distribution chart in our analytics product. His team’s prior was that it wasn’t adding value, and they were ready to remove it. They watched sessions instead. About 10 percent of users were hovering over the chart for several seconds, which, when scaled out across thousands of users, amounts to a lot of people getting silent value. They didn’t kill it. They made it collapsible. That’s a redesign that only happens if you watch the sessions before you trust your gut.
Step 3: In-app survey (the user-stated reason)
The third leg of the triage is asking the user. Once you’ve watched 20 to 30 sessions and have a hypothesis about the friction, fire a contextual microsurvey to users who match the friction pattern. One question. Branching logic if you need it. Don’t ship a five-question survey at a drop-off point; you’ll get nothing back.
- Microsurveys at the friction point: “What’s stopping you from finishing this step?” (open text or 3 to 4 prefilled options).
- CES surveys: To measure effort on the workflow you just fixed.
- NPS: To read overall sentiment and segment by adopted or not.
- Feature-level surveys: After a user has had a chance to try something a few times.
The triage matters because each tool answers a different question. Funnels alone leave you guessing about why. Replays alone leave you guessing about intent. Surveys alone are anecdotes. The three together usually let you ship the in-app fix in hours, not weeks. More on that next.
Two streams of adoption signal: Human users and agent users
This is the part of the post that doesn’t exist in the 2025 version. It’s the most important update.
If you talk to anyone shipping software in 2026, the conversation about “users” splits in two. There are the humans we’ve always optimized for, and there’s a second class of users that didn’t exist five years ago: AI agents acting on a human’s behalf, calling SaaS products through MCP and other agent-to-agent protocols.
An agent doesn’t click. It executes. It doesn’t scroll a dashboard; it pulls the data it needs through an API and moves on. The metrics built around human behavior, the click counts, the scroll depths, and the session lengths will increasingly misread agent-heavy accounts. They’ll look “low engagement” by every traditional measure, while the customer is in fact getting more value from the product than ever.
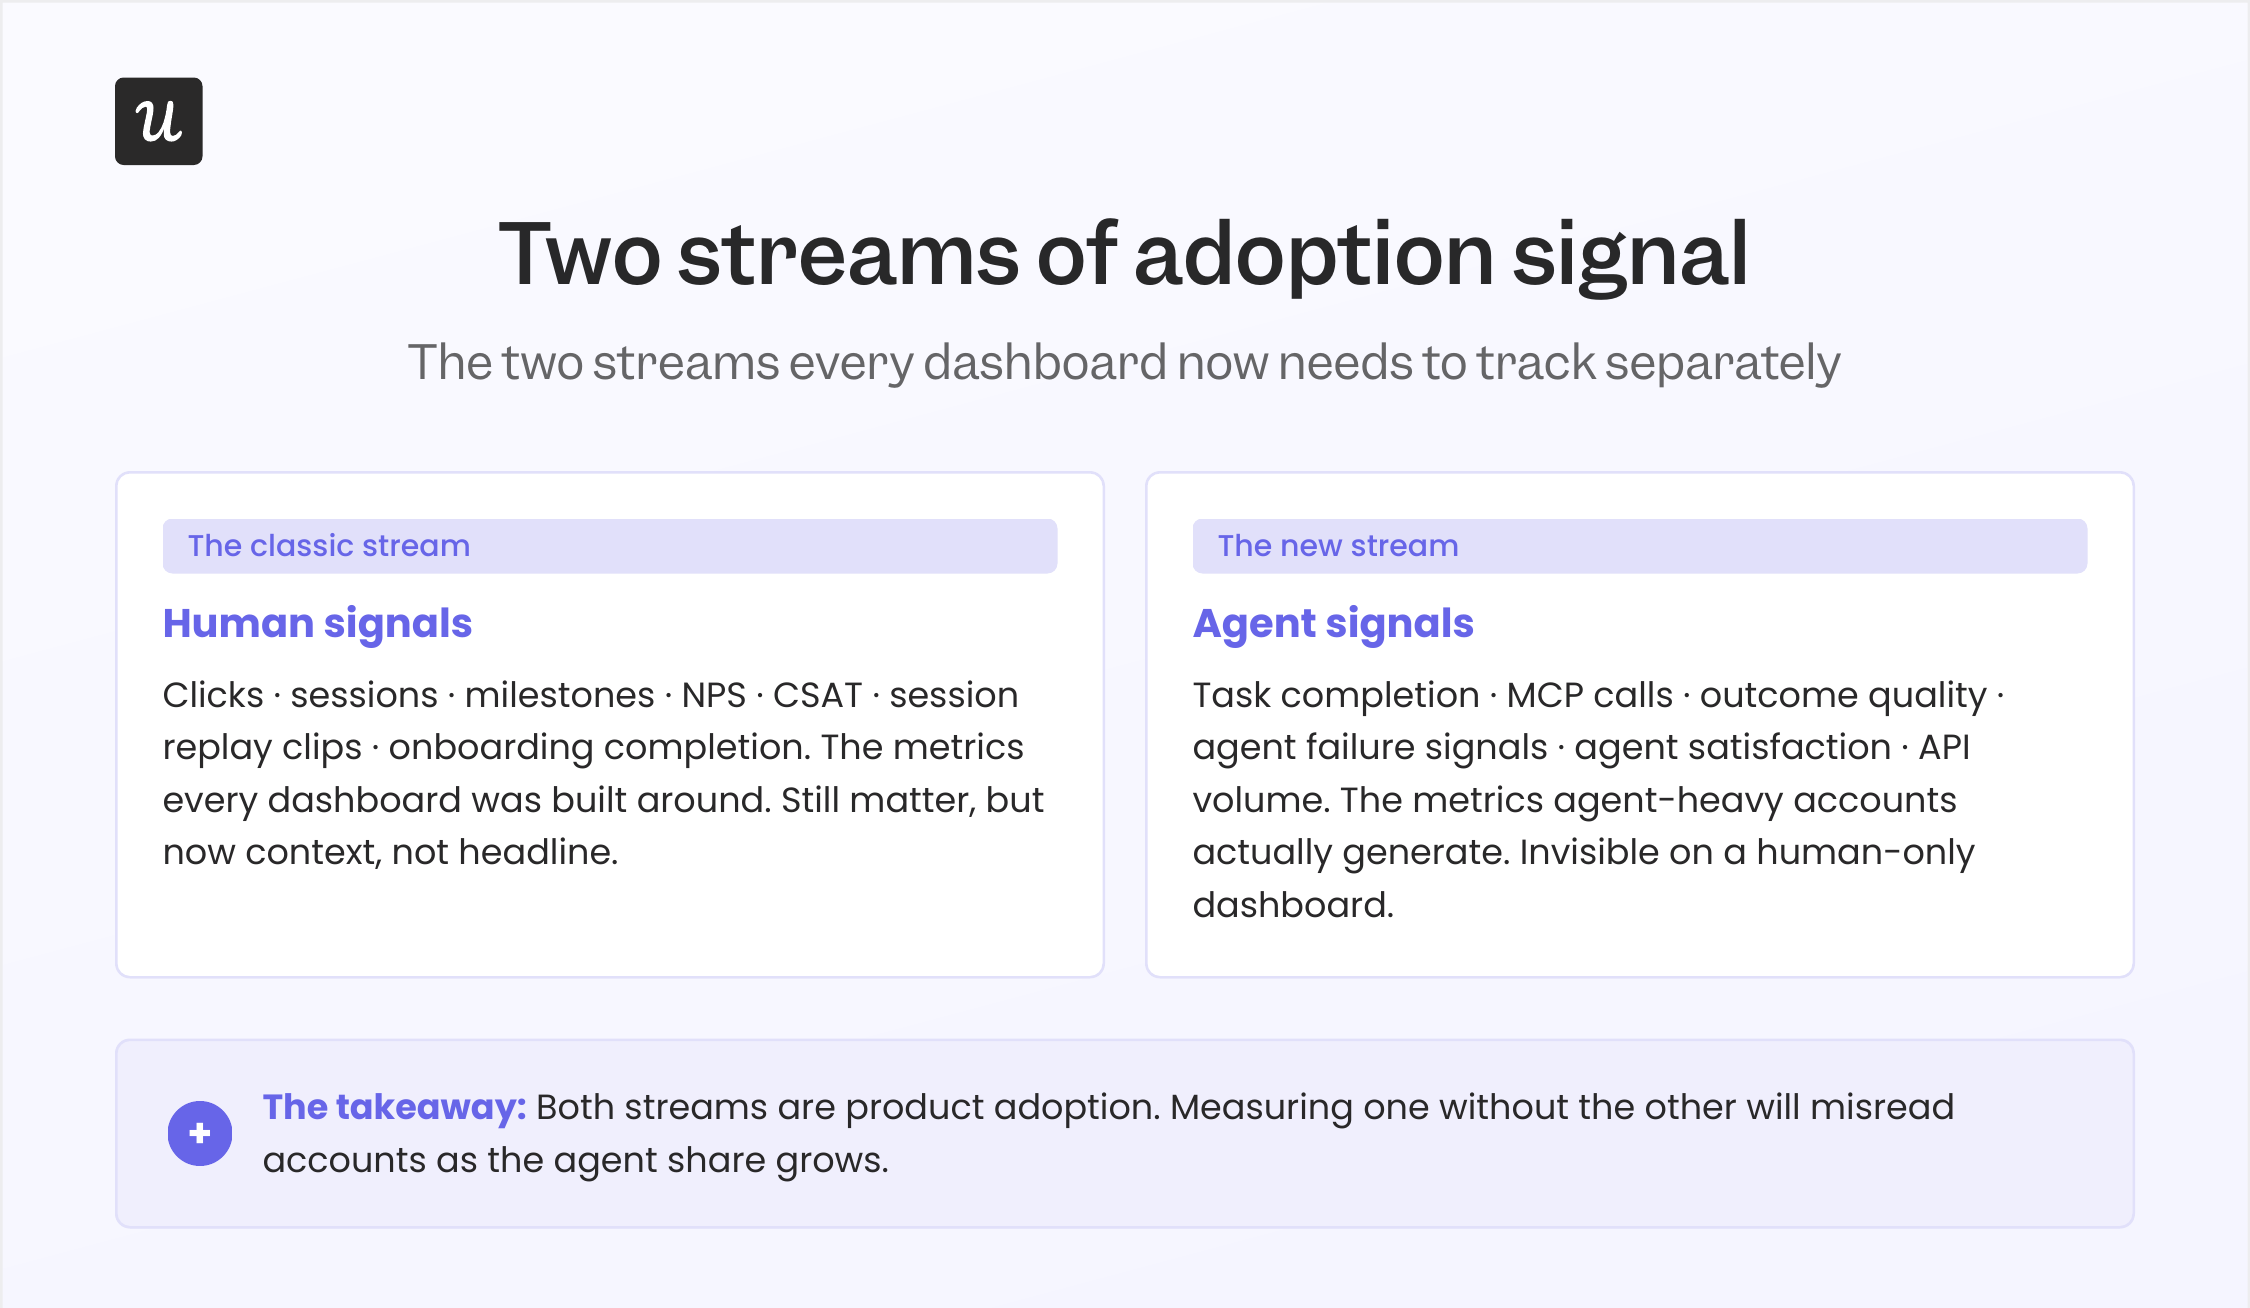
The fix isn’t to throw out human-signal metrics. They still matter for the human half of the user base. The fix is to start tracking two parallel signal streams.
Human signals (the ones you already track):
- Active users (DAU, MAU), but as context, not headline.
- Feature-level click counts and funnel completion.
- Session length and session count (with the caveat above).
- Session replay clips at friction points.
- NPS, CSAT, CES.
- Milestones and onboarding completion.
Agent signals (the ones to start tracking):
- Task completion rate per agent session.
- MCP call volume and pattern per customer.
- Outcome quality (did the agent finish the task the human asked for?).
- Agent failure signals (where the agent gave up or hallucinated).
- Agent satisfaction (the new equivalent of CSAT, measured at the API).
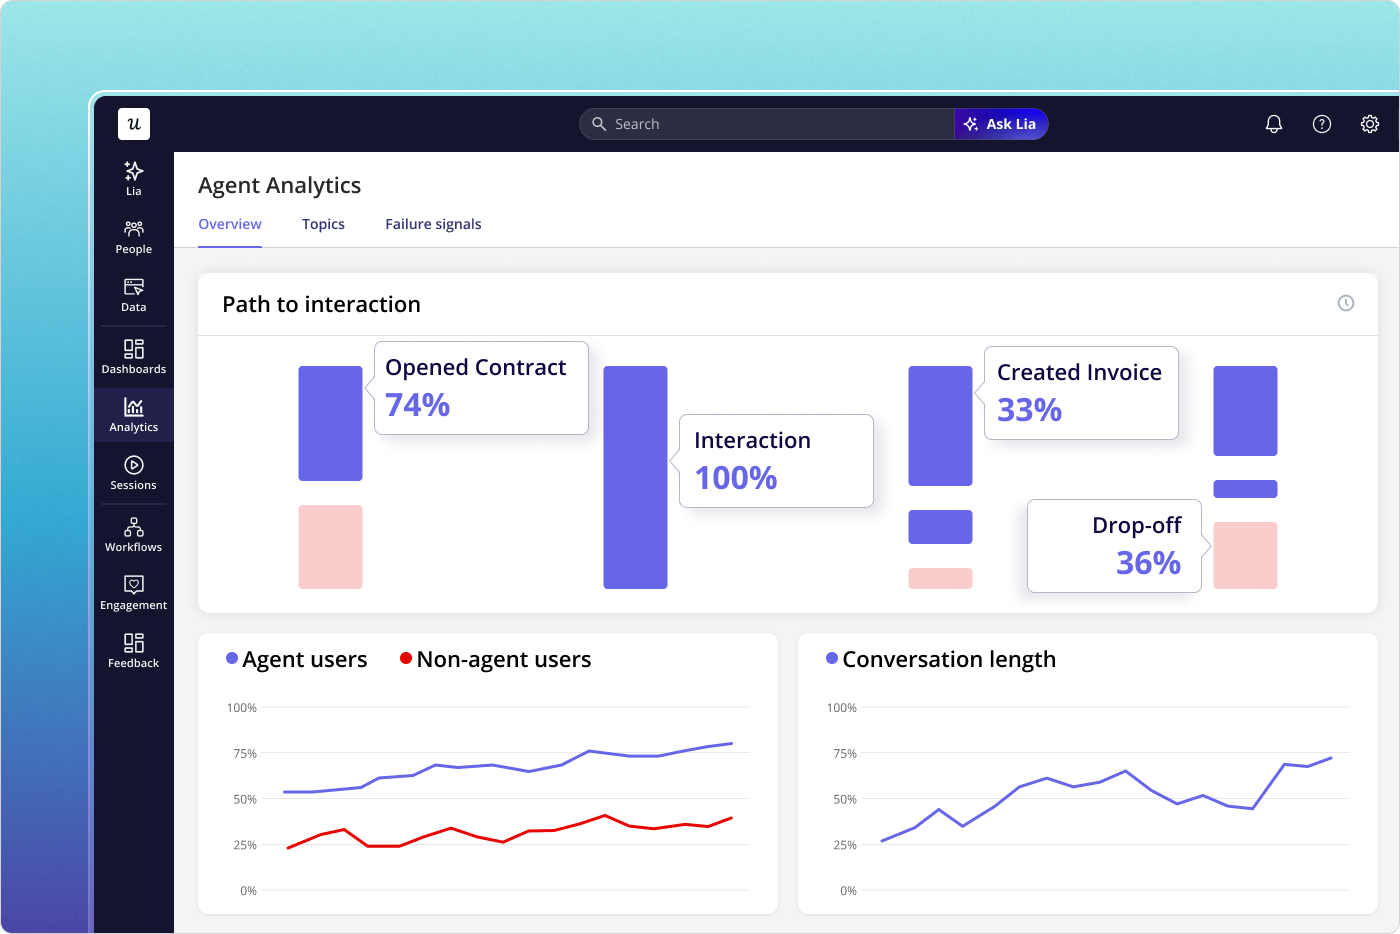
At Userpilot, this is the design center of our Agent Analytics product. Yazan put the broader thesis to me this way: “A lot of the work in the future will be done through these foundational horizontal models. As teams start deploying their own AI agents, powered by Claude or other models, those agents are going to tap into the existing infrastructure that powers all of the usage and product data. That’s where Userpilot’s MCP Server comes in.”
A note on agent-era metrics, since I want to be honest about where this still has rough edges. Most teams (including ours, when we started) underestimate how much agent traffic is already hitting their product. The first thing to do isn’t to build a new dashboard. It’s to instrument the API layer so you can tell agent traffic apart from human traffic at all. Once you can separate the two, the rest of the playbook follows.
How to improve product adoption: The playbook (revised for 2026)
Improving product adoption means guiding users to value faster, helping them find the right features at the right time, and building habits around the product. The most effective teams treat adoption as something they design, not something they hope will happen. The product adoption strategy I run is six steps, each built around in-app guidance, feedback loops, and a defined target audience. Below is the tactical playbook with the updates that matter for 2026.
1. Reduce friction in onboarding and accelerate time to value
The fastest way to improve product adoption is to help new users reach value as quickly as possible. Every extra step, click, or confusing workflow creates drop-off. The new 2026 wrinkle: AI agents now build a lot of the onboarding for you.
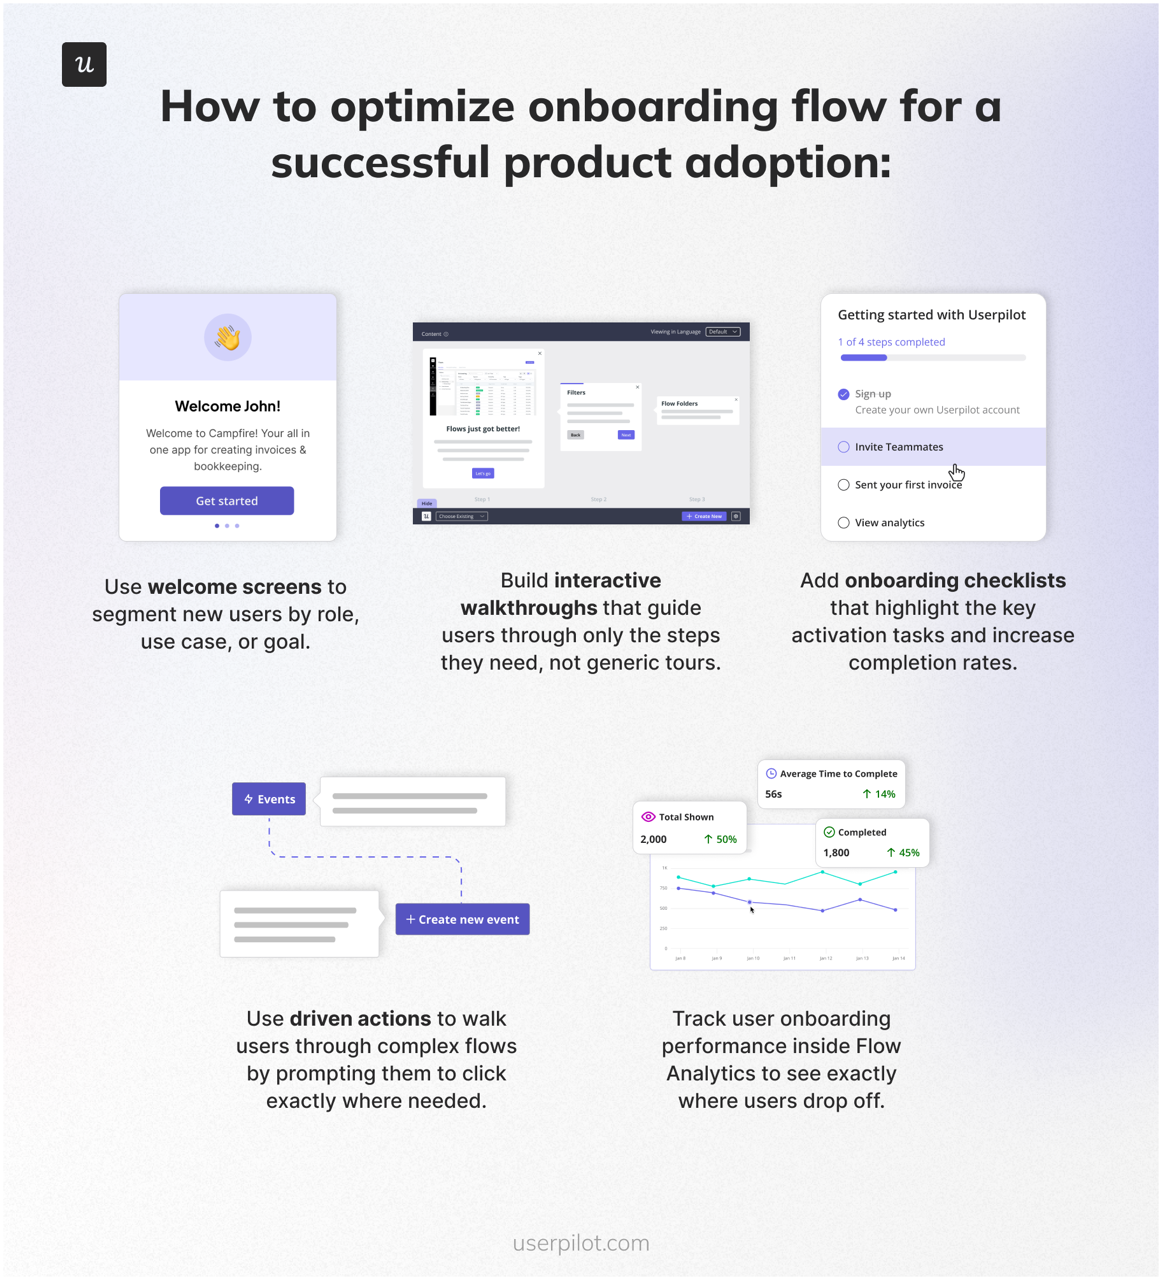
- Use welcome screens to segment new users by role, use case, or goal.
- Build interactive walkthroughs that guide users through only the steps they need, not generic tours.
- Add onboarding checklists that highlight the activation tasks that matter most. Abrar’s rule (mine, as the author): a checklist beats a forced tour every time. Forced tours kill activation; checklists put the user back in control.
- Use driven actions to walk users through complex flows by prompting them to click exactly where needed.
- Track user onboarding performance inside flow analytics to see exactly where users drop off.
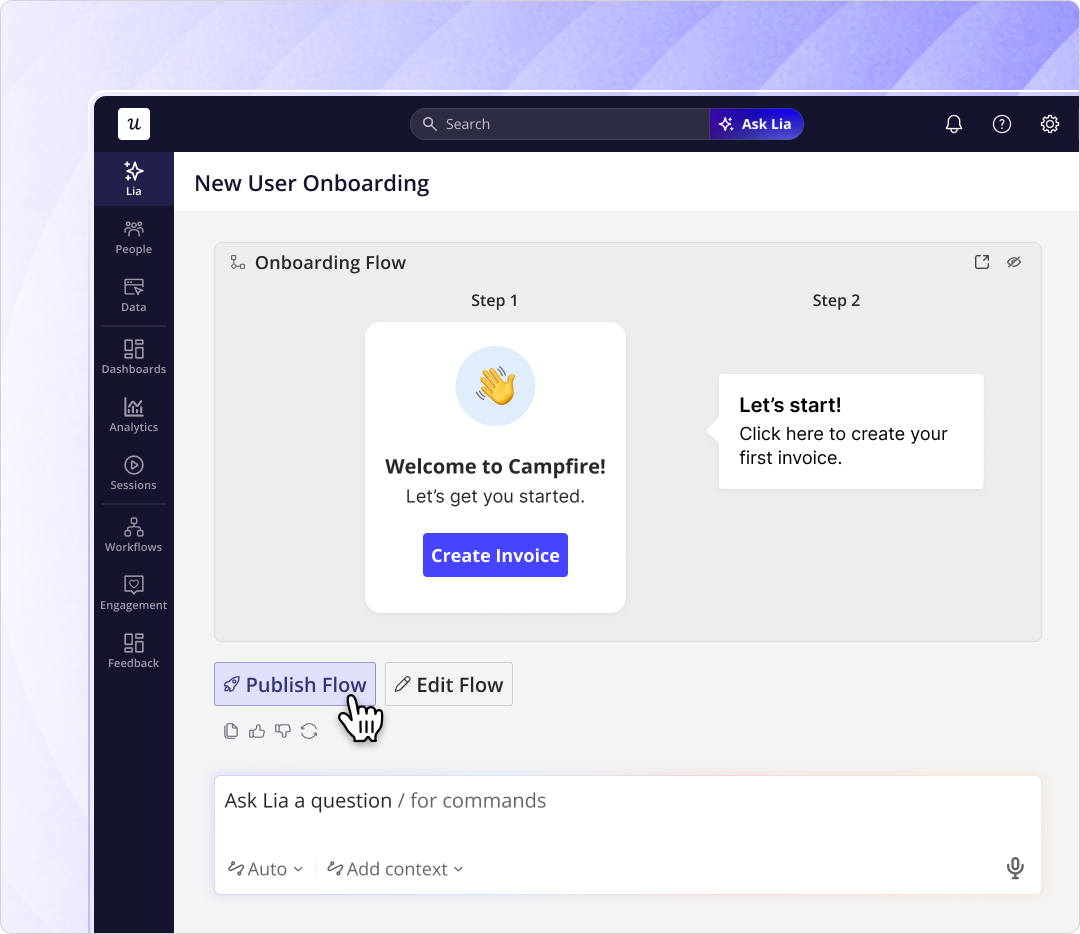
- You don’t have to build all of this manually anymore. Lia, our AI agent, can autonomously build in-app onboarding experiences from a stated goal. You describe the result you want; the agent ships the flow.
2. Personalize the experience by segment, not by guess
Different users adopt your product in different ways. Sales managers, power users, agent-buyer accounts, and new team members each need different guidance.
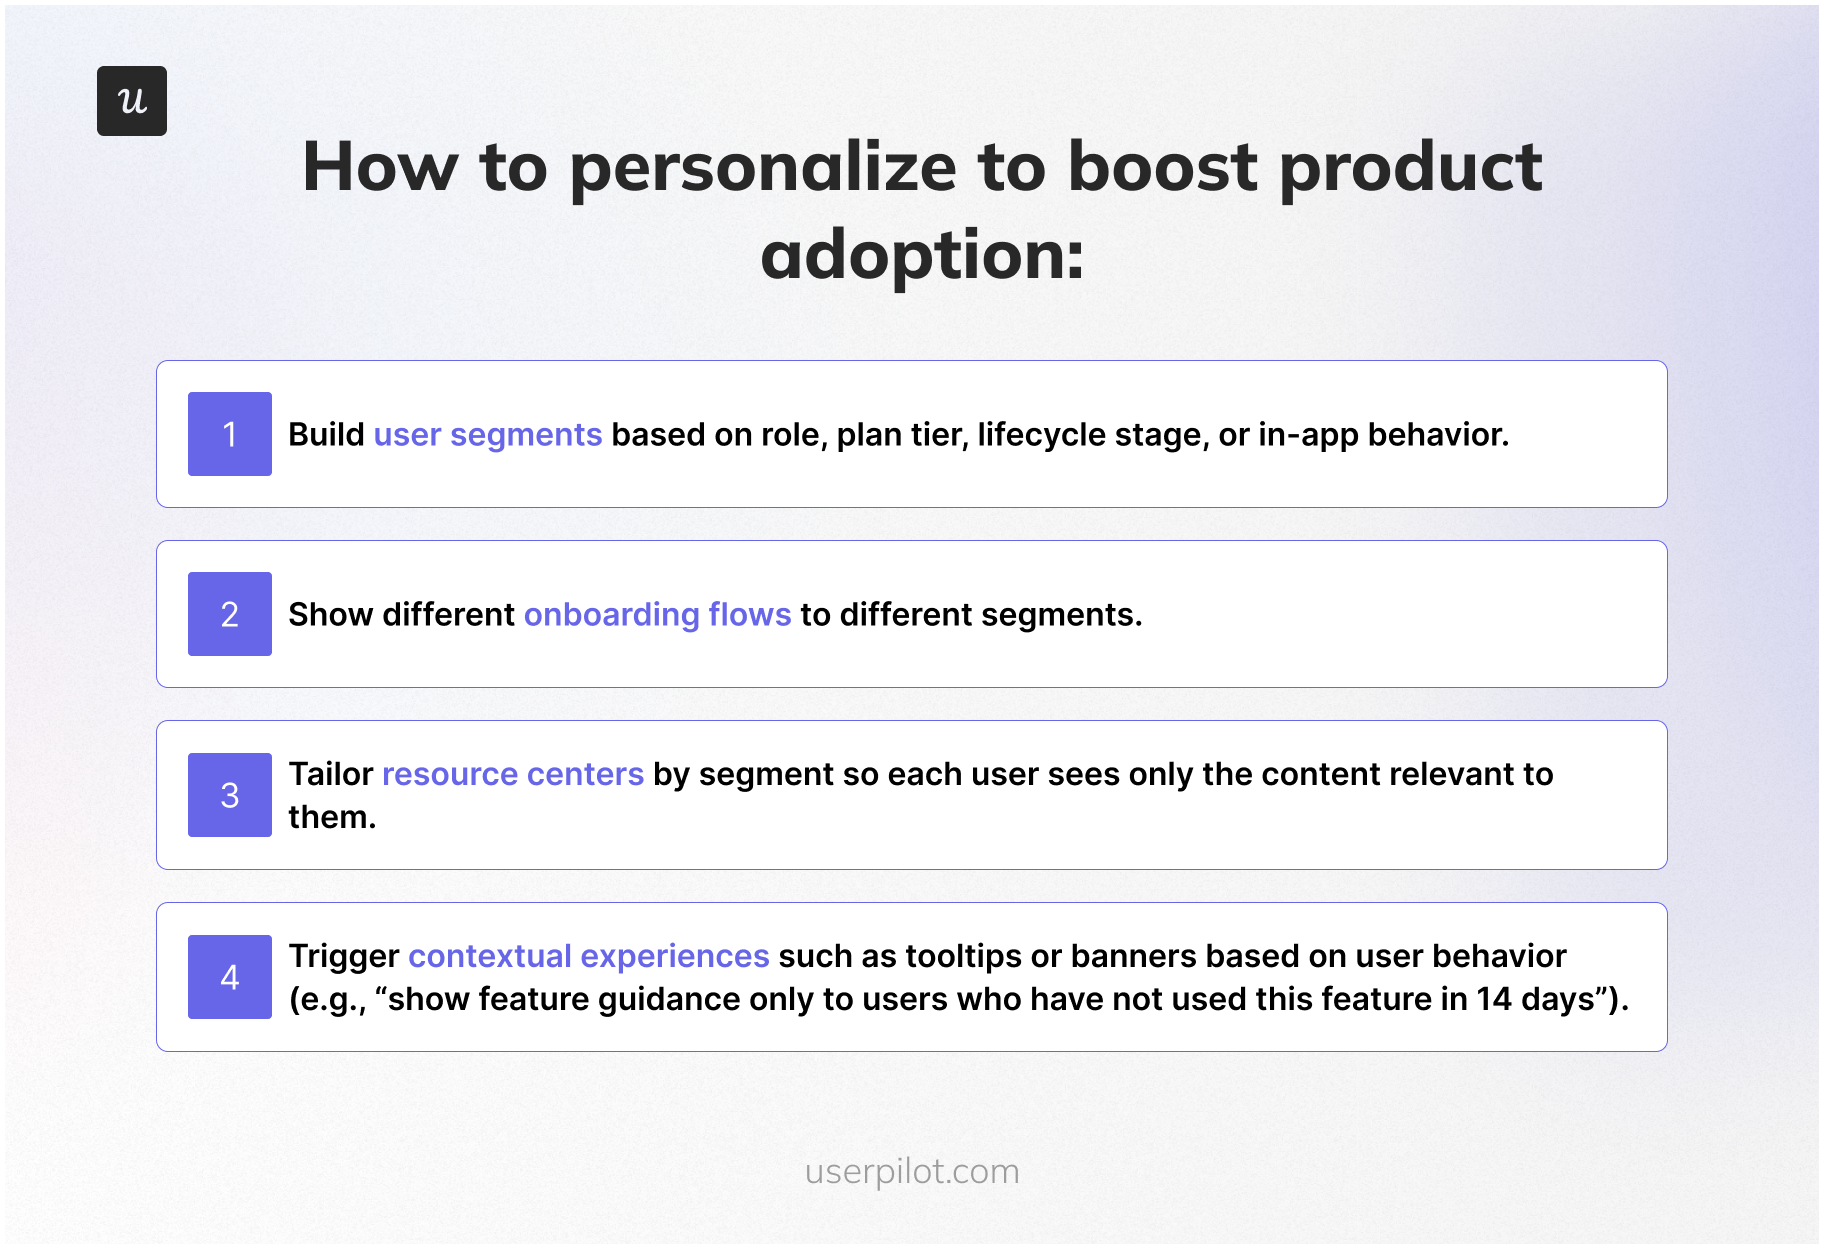
- Build user segments based on role, plan tier, lifecycle stage, or in-product behavior.
- Show different onboarding flows to different segments. A power user should never see a beginner tour.
- Tailor resource centers by segment so each user sees only the content relevant to them.
- Trigger contextual experiences based on user behavior (e.g., “show feature guidance only to users who haven’t used this feature in 14 days”). Power users and new users need different nudges; segment your messaging accordingly.
- For agent-heavy accounts, surface a parallel resource set in the MCP-callable docs. Agents need a different content shape than humans.
3. Improve feature discovery and promote ongoing engagement
Users rarely adopt features they don’t know exist. This used to be a once-a-quarter problem. With AI-assisted release velocity, it’s now a once-a-week problem.
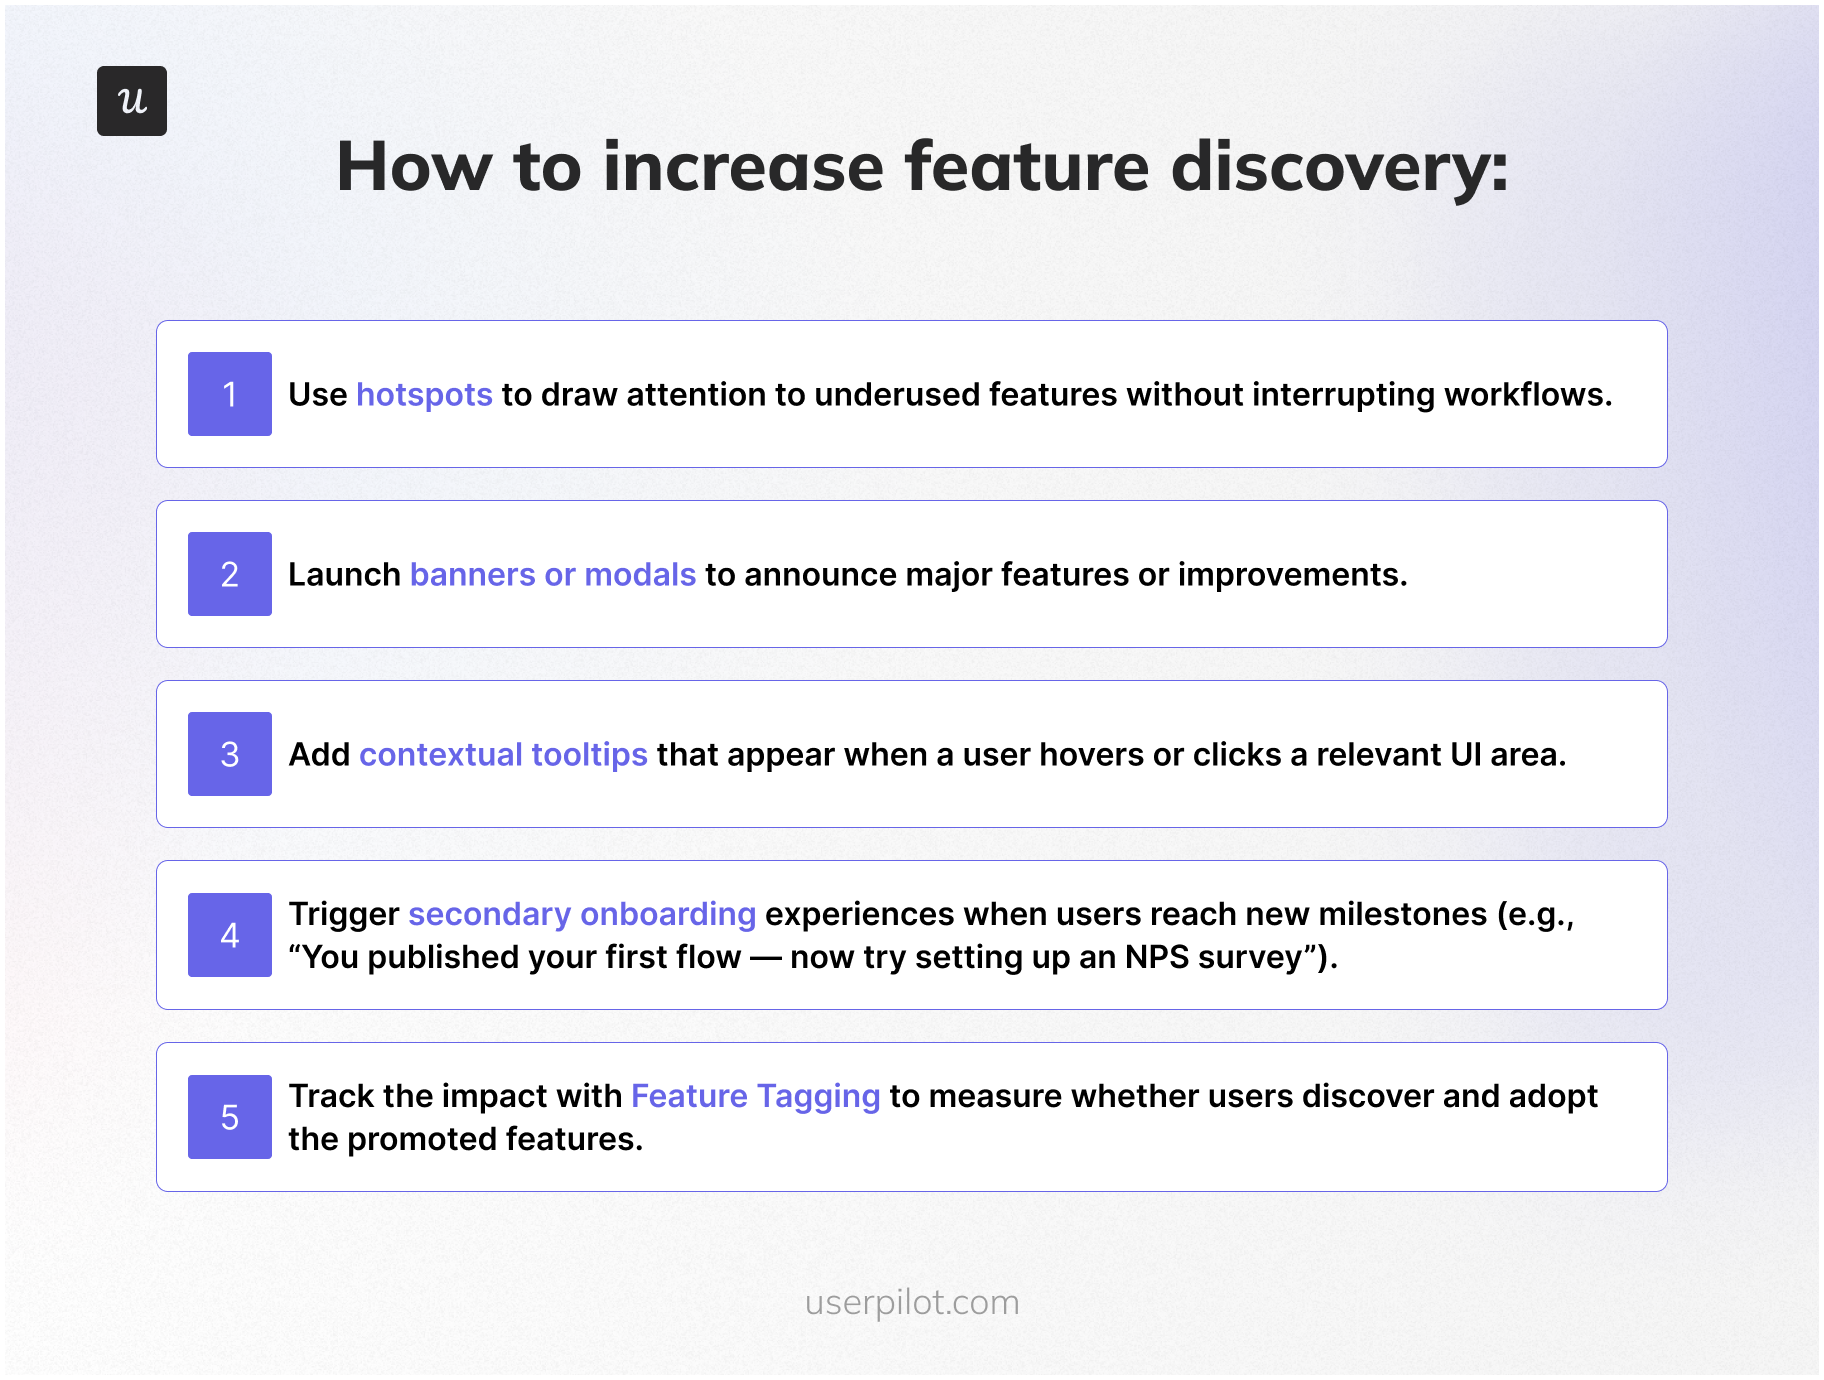
- Use hotspots to draw attention to underused features without interrupting workflows.
- Launch banners or modals for major features. Reserve full-screen modals for things that genuinely change the product.
- Add contextual tooltips that appear when a user hovers or clicks a relevant UI area.
- Trigger secondary onboarding when users hit new milestones (e.g., “you published your first flow, now try setting up an NPS survey”).
- Track impact with feature tagging to measure whether users discover and adopt the promoted features.
4. Use in-app feedback to remove product adoption blockers
Every drop-off in your product has a reason. Teams that skip user feedback end up building features that don’t solve the right problem.
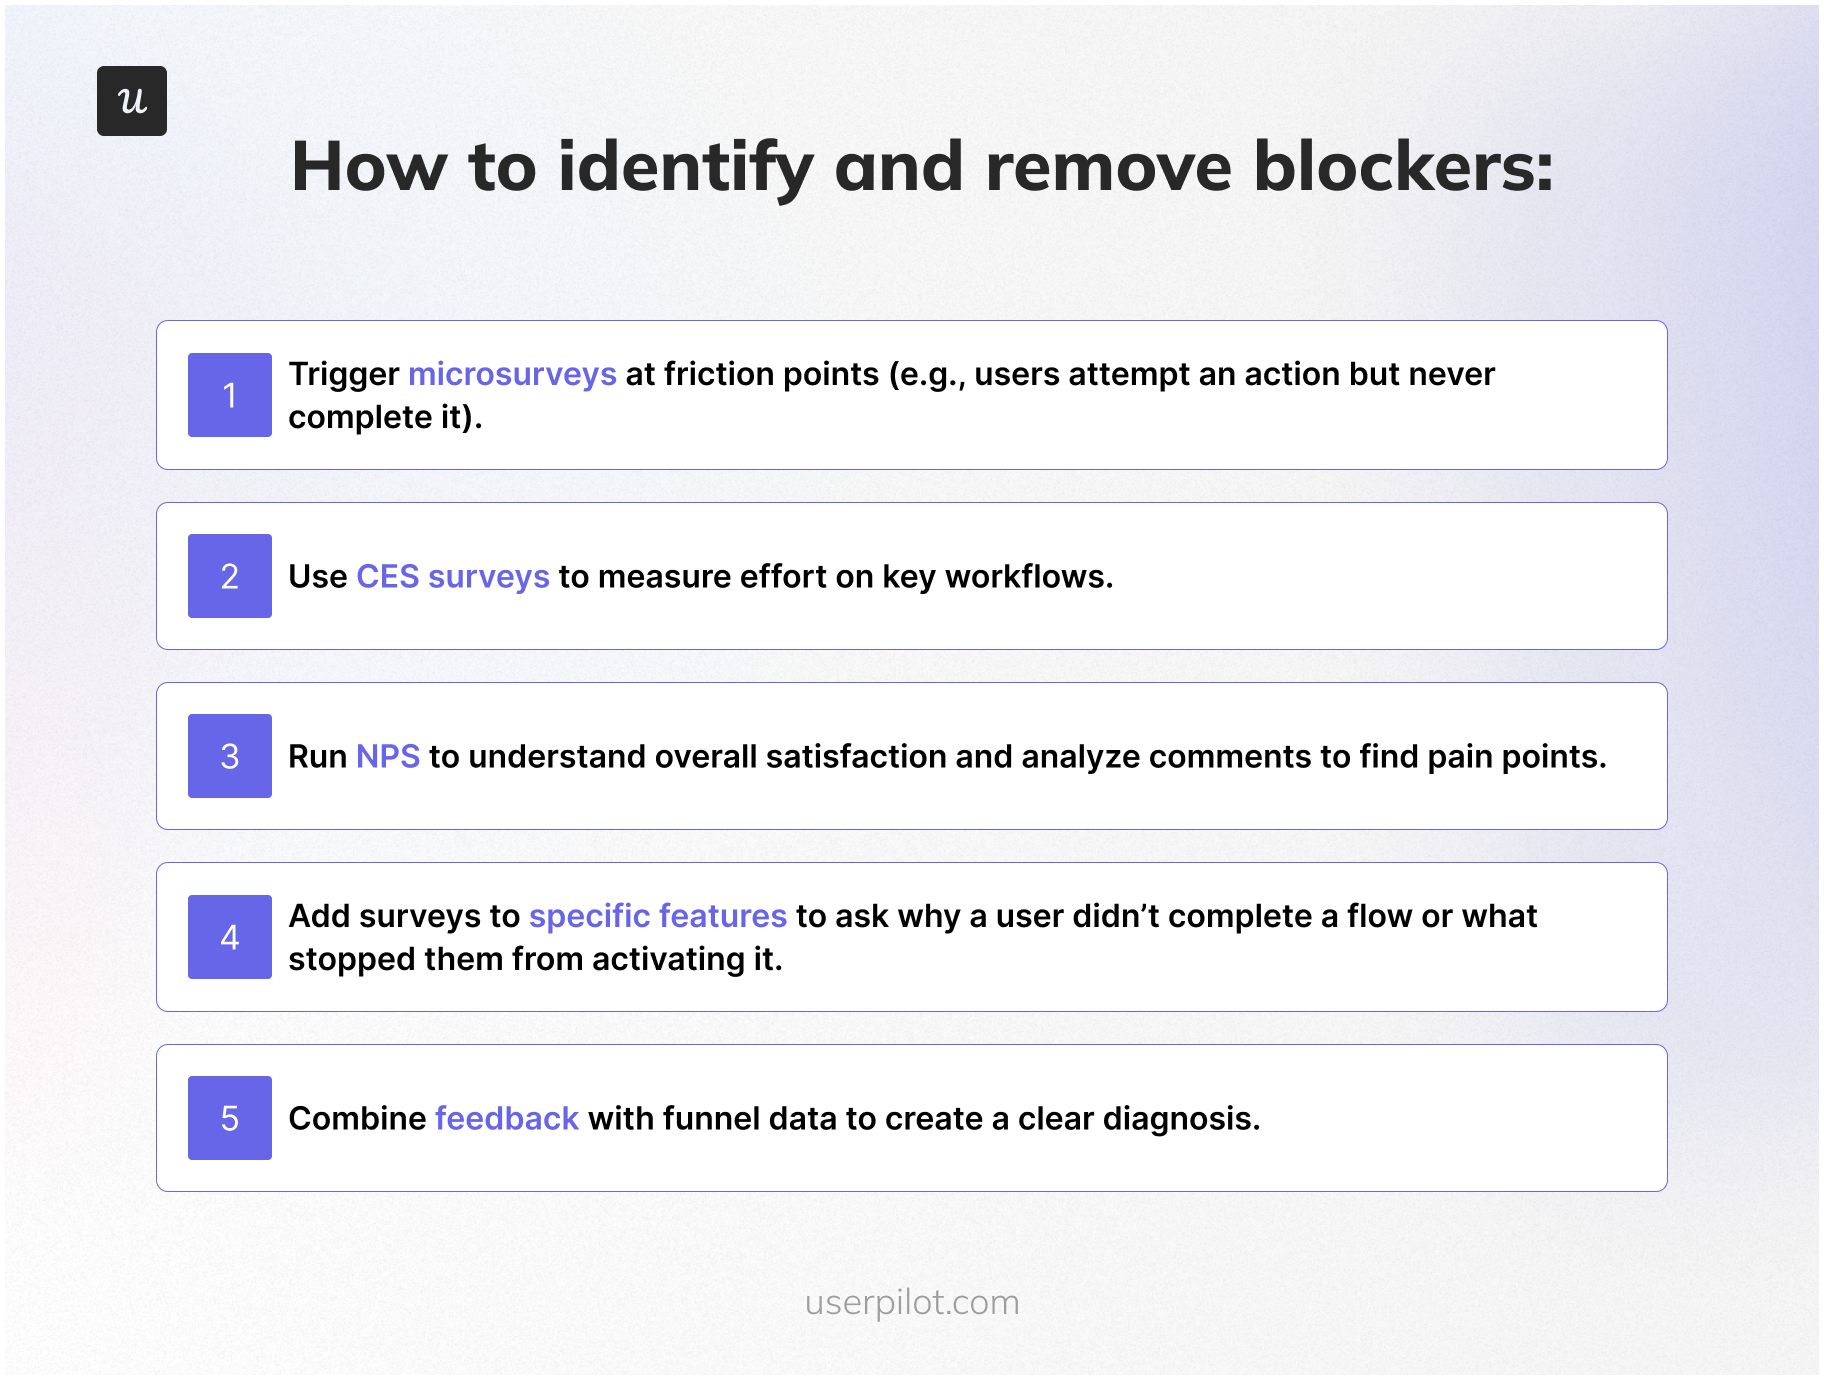
- Trigger microsurveys at friction points (e.g., users attempt an action but never complete it).
- Use CES surveys to measure effort on the workflows that matter most.
- Run NPS to read overall sentiment, and read the open-text comments. They are usually where the real blockers live.
- Add surveys to specific features to ask why a user didn’t complete a flow.
- Combine feedback with funnel data so you have both the where and the why before you brief engineering.
5. Reinforce value through education and habit-building
Product adoption doesn’t end at activation. You need to reinforce ongoing usage and help users develop habits around the product.
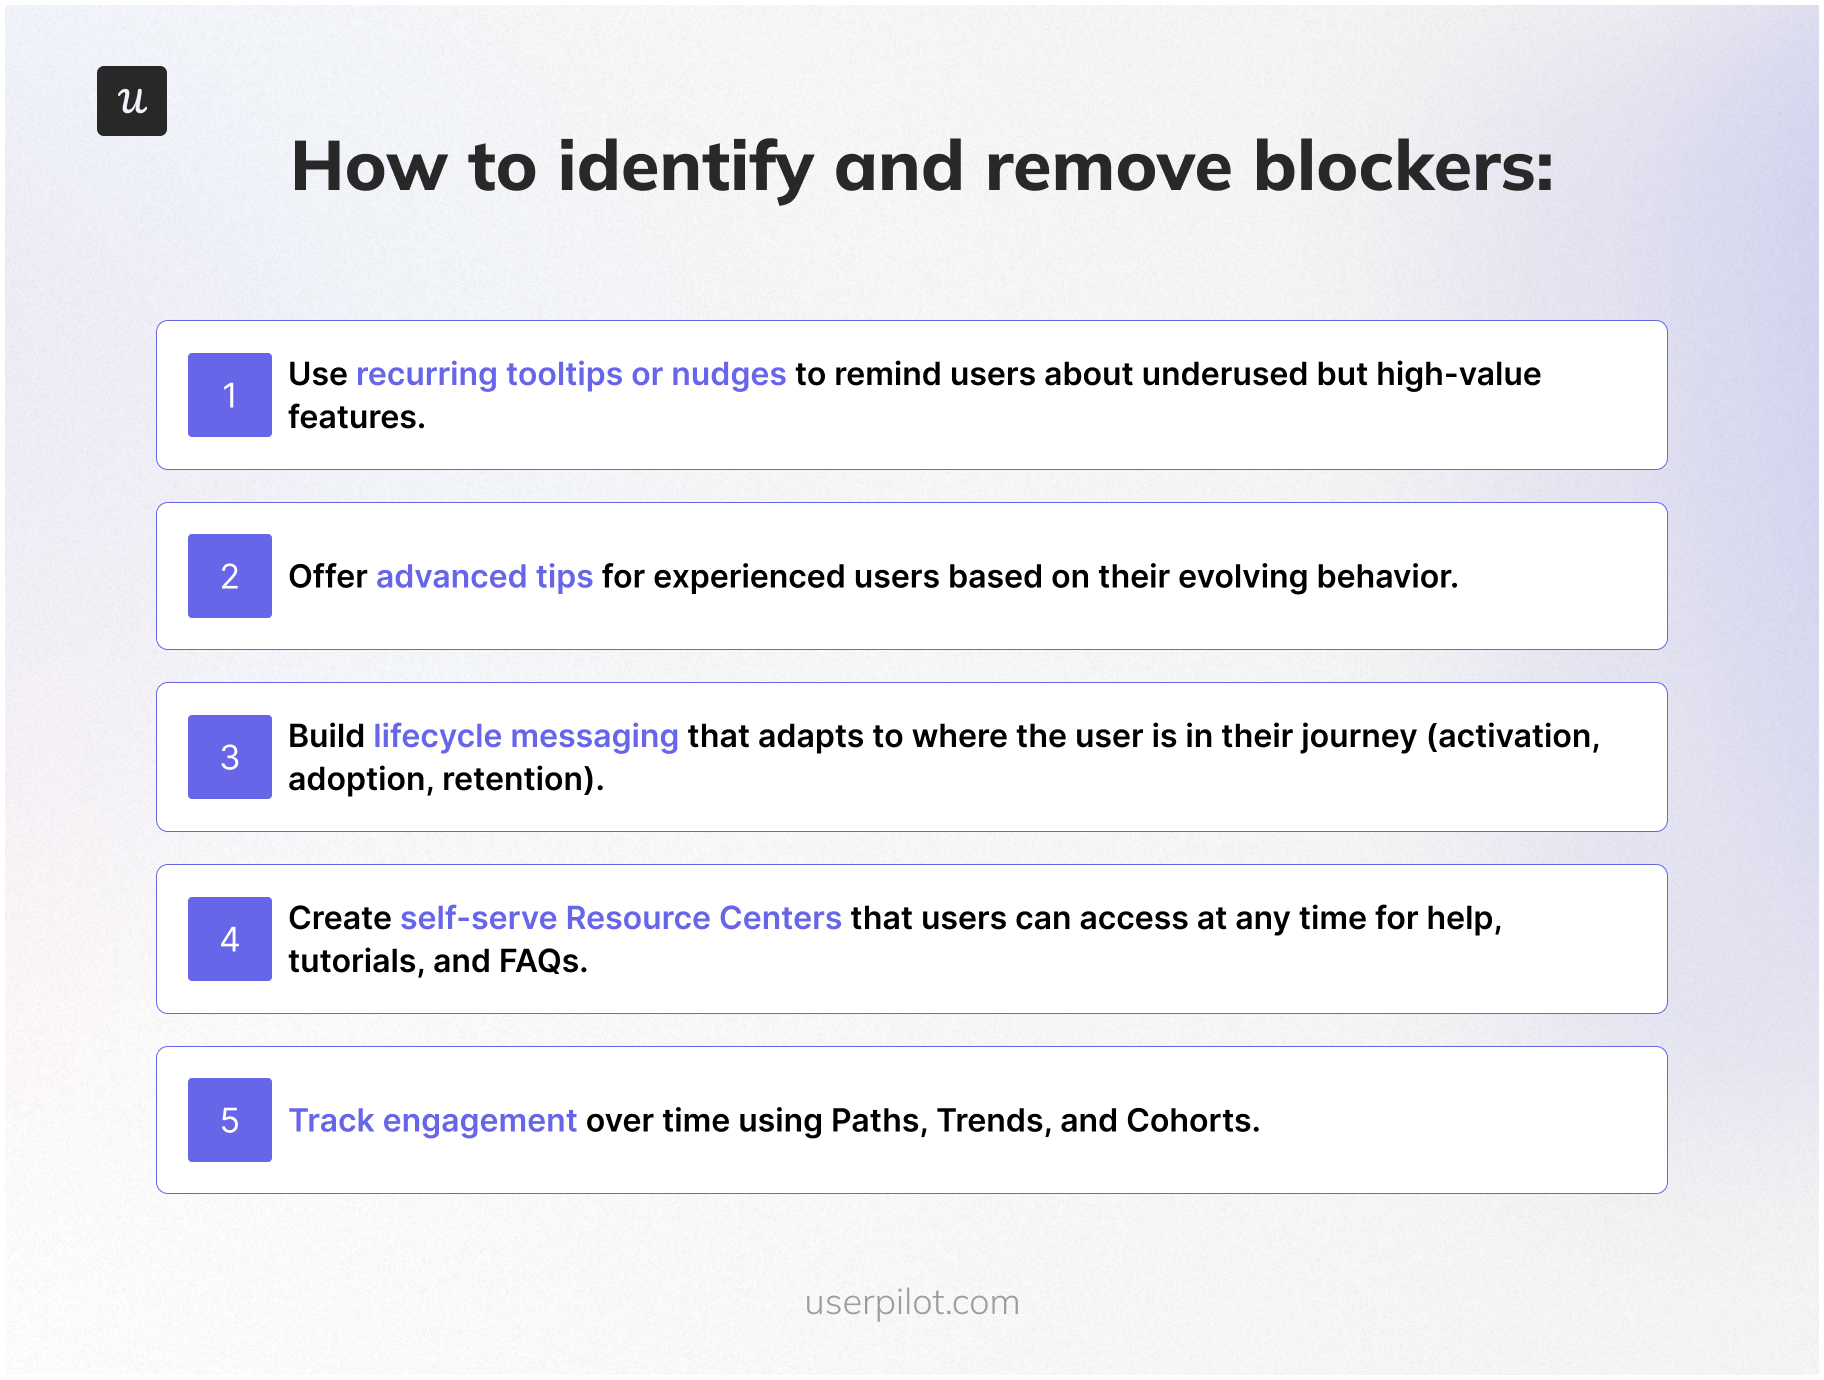
- Use recurring tooltips or in-app messaging nudges to remind users about underused but high-value features. Pair them with email re-engagement campaigns for users who haven’t logged in recently.
- Offer advanced tips for experienced users based on their evolving behavior.
- Build lifecycle messaging that adapts to where the user is in their journey (activation, adoption, retention).
- Create self-service resources like a resource center that users can access anytime for help, tutorials, and FAQs, paired with human customer support for the edge cases self-serve can’t cover. James from CS noted that the right philosophy is to “empower users to navigate and explore on their own, but make sure that if a user does get stuck, they can access the information they need very quickly to get unstuck.” That’s the role of a resource center.
- Track engagement over time using paths, trends, and cohorts.
6. Iterate continuously based on user behavior and product usage data
The teams that ship adoption gains never “set and forget.” They test, iterate, and refine based on analytics.
- Monitor feature usage trends to decide what to promote or improve.
- Compare retention cohorts before and after changes to see the impact.
- Use A/B testing on flows to find the most effective onboarding designs.
- Update walkthroughs, checklists, and tooltips based on how users interact with them.
- Re-run funnels to confirm adoption improves after each iteration.
Three real adoption stories from inside Userpilot
The playbook above is the theory. Here are three stories of when I ran it, with the results good and bad. I’m including the bad ones on purpose. Adoption work is mostly debugging, and most adoption posts only show the wins.
Story 1: The email feature and the 60-day domain gap
We shipped email last year. I was proud of the feature. The send experience was good, the templates were good, the analytics on what got sent were good. The set-up experience was the problem.
The funnel told the story in two steps. Customers got access to the feature. Almost none of them verified a domain. And of the customers who did verify a domain, the median time to “add an email address” was 60 days. Two adoption-killing gaps in two consecutive steps.
Kevin’s team and mine watched the sessions. The friction was in the settings page where the domain verification flow lived; the path to get there wasn’t obvious from the email feature’s entry point. The fix was not engineering work. It was a checklist for new email feature users that walked them to the domain verification step, plus a reminder nudge for accounts that started the setup and didn’t finish it.
I shipped the checklist that week. No dev ticket. Activation of the email feature moved within days. The decision rule I drew from it: Most “adoption problems” are onboarding problems, and most onboarding problems can be fixed in-app, this week, without engineering.
Story 2: The mobile feature reframe (10 percent vs. 25 percent)
We launched support for mobile applications. The adoption numbers came back low: About 10 percent of all Userpilot customers were using mobile features. Internally, the conversation started leaning “the feature isn’t landing.” I pushed back because that 10 percent number felt wrong as a baseline.
So I shipped an in-app survey. One question: “Does the company you’re working for currently support a mobile application?” The answer reframed the math: Only about 40 percent of our customer base had a mobile app at all. Of customers who did have a mobile app, around 25 percent were using our mobile features. That’s a different feature-health story.
From there, the segmentation work was simple. Customers without a mobile app were excluded from any mobile-related messaging. Customers with a mobile app who hadn’t tried our feature got a targeted in-app nudge and a setup checklist. Adoption rate inside the addressable segment moved.
The decision rule: Before you accept an adoption number, check that you’re measuring against the right denominator. Most low-adoption stories are denominator stories.
Story 3: The distribution chart we almost killed
This one belongs to Kevin’s team, but it’s the most useful story I know about session replay. The team was redesigning the events and pages screen in our analytics product. There’s a chart at the top of that screen called the event occurrence distribution chart, and the internal prior was that it wasn’t valuable. The team was ready to remove it.
They watched sessions first. Katie Kelly, our UX researcher, ran a 30-session study. Around 10 percent of users were hovering on the chart for several seconds. Not clicking, not interacting, just reading. In a feature with thousands of monthly users, 10 percent is a meaningful share of people getting silent value from a UI element the team was about to delete.
They didn’t kill the chart. They made it collapsible, so the 90 percent who skip it can collapse it once and never see it again, and the 10 percent who get value can keep it. Two redesigns came out of that single insight, both of which I now apply to my own feature work.
The decision rule, Kevin’s words: “Pull back from the drastic redesign experience of turning something off. Maybe think about something smart where you could just collapse the chart.” Adoption decisions are reversible only in one direction. Removing a feature creates loud, slow-to-recover damage. Hiding a feature is reversible. When in doubt, hide.
Two adoption stories from outside Userpilot
Two more, this time from customers. Both used Userpilot to ship the kind of in-app fix the playbook above describes.
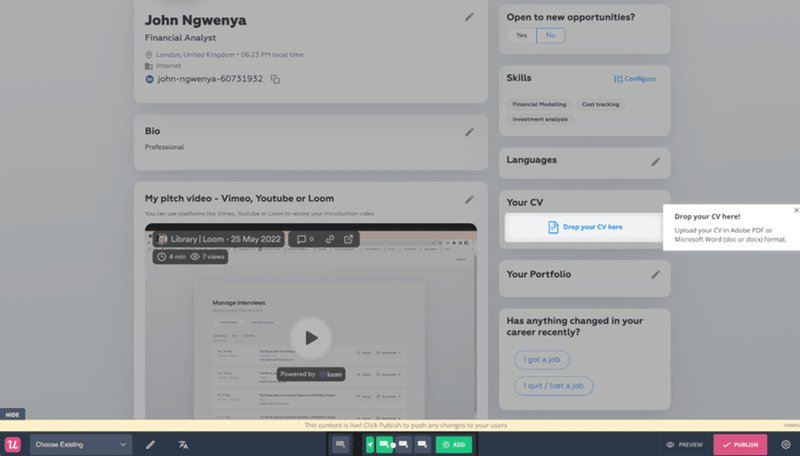
The Room: 75 Percent more CV uploads in 10 days
The Room is a Microsoft-funded platform working to create three million work placements for young tech workers from Africa over the next decade. The product’s core action is: a candidate uploads a CV. Without that, nothing else in the product works.
The adoption problem was that users weren’t uploading their CVs. The team used Userpilot to build onboarding flows and a new product adoption sequence with driven actions that walked candidates through CV upload step by step. CV uploads went up 75 percent in 10 days. The feature didn’t change. The path to the feature did.
Sked Social: A checklist that tripled conversion
Sked Social is an Instagram-first social media platform. The team was getting traffic to the product but not seeing enough users move through the early adoption stages.
They built a dynamic onboarding checklist that walked new users through the core activities of the product. Users who completed the checklist were more than three times more likely to become paying customers. Same rule as Story 1 above, applied at the activation stage: A well-placed checklist will outperform a forced tour every time.

Where product adoption is heading
Two forward-looking notes to close.
From descriptive to predictive adoption monitoring
Adoption work today is mostly descriptive. You set up the dashboards, you watch the metrics, you intervene when something looks off. The next step, and the one that’s already shipping at Userpilot through Lia, is predictive. The system watches the data continuously, learns the patterns that correlate with churn or with successful adoption, and surfaces accounts (or features) that fit the at-risk profile before anyone on your team has to ask.
James told me what this changes in practice: “Customers who eventually churn aren’t always the loud ones. AI can do a lot more analysis of behavioral clusters, and the first step is just having the data.” If you’ve been doing rung-2 milestone-based monitoring, the gap between you and a predictive system is mostly a data quality problem, not an algorithm problem.
From human-only to two-stream measurement
The other shift is the one I covered above: agent users are coming, and the dashboards built around clicks and sessions don’t see them. The teams that get ahead in 2026 are the ones who instrument the two streams separately, measure agent task completion alongside human task completion, and stop trying to read agent-heavy accounts with human-only metrics. Yazan’s framing of the broader Userpilot direction was: “We see Userpilot becoming the infrastructure that powers your product usage data for the AI-agent layer.” That’s the bet on where this is heading.
Whichever rung of the maturity ladder you’re on right now, the next move is the same. Define adoption for your product more precisely than you did last quarter, instrument it more honestly, and run the funnel-replay-survey triage before you ask engineering to build anything. That’s how user adoption turns into engaged customers, engaged customers into loyal customers, and loyal customers into the expansion revenue every PLG company is built on.
FAQ
What are the stages of product adoption?
The six stages of product adoption are awareness, interest, evaluation, trial, activation, and adoption. Users move from first discovering the product through exploration, evaluation, the “Aha!” moment, and finally repeated, long-term use. Each stage now has a human flavor and (increasingly) an agent flavor.
What is the product adoption curve?
The product adoption curve is a model that shows how different groups of users adopt a product over time. It divides users into five segments (innovators, early adopters, early majority, late majority, and laggards) and shows adoption as an S-shaped curve that rises as more users begin using the product. In 2026, the curve is bending faster on the early-majority side because AI-assisted onboarding shortens time to value.
What are the 5 types of product adopters?
The five types of product adopters, from Everett Rogers’ Diffusion of Innovations theory, are innovators (about 2.5 percent of the user base), early adopters (13.5 percent), early majority (34 percent), late majority (34 percent), and laggards (16 percent). The distribution is bell-shaped: a small group of innovators and early adopters validate the product, then the early majority and late majority drive mass user adoption, with laggards arriving last. Targeting innovators and early adopters in the early stage of a launch is the cheapest way to refine the product and build the case for everyone else.
What are the 5 factors that affect product adoption?
The five factors that affect product adoption come from Everett Rogers’ Diffusion of Innovations theory: relative advantage (how much better the product is than the solution it replaces), compatibility (how well it fits the user’s existing workflow), complexity (how easy it is to understand and use, with simpler products adopted faster), trialability (how easily users can test the product on a limited basis through free trials or freemium), and observability (how visible the results or benefits are to others, which drives social proof). In 2026, I’d add a sixth factor: agent-readiness. Whether your product can be called by AI agents on behalf of human users will increasingly affect how it gets adopted inside larger accounts.
What's the difference between product adoption and product activation?
Activation is the first time a user experiences value. Adoption is the ongoing process of users repeatedly getting value and integrating the product into their workflow. Activation is a moment; adoption is a habit. The two get conflated in most PLG funnels, which is the most common reason adoption dashboards are misread.
Which metrics should I stop using in 2026?
I’d deprioritize DAU/MAU ratio as a primary adoption signal (it measures login frequency, not outcomes) and raw session length (it gets distorted by AI-assisted users and agents). Replace them with task completion rate (separated by human and agent users) and time-to-second-value. Both measure outcomes, not behavior.
About the author