Amplitude Analytics in 2026: Powerful, Expensive, and Not Right for Every Team


Amplitude analytics is still the first name most product teams reach for when they decide it’s time to track user behavior properly and start turning raw data into actionable insights.
The San Francisco-based company has built that position over years of consistent product development, and it now serves over 4,700 customers, from early-stage startups to PayPal and Walmart. However, I keep running into teams that bought an Amplitude plan and underused it, or paid for it at a scale they couldn’t justify, and those patterns are worth examining honestly.
I’ve been on the PMM side of product analytics decisions long enough to have a clear view of where these tools deliver and where they fall short.
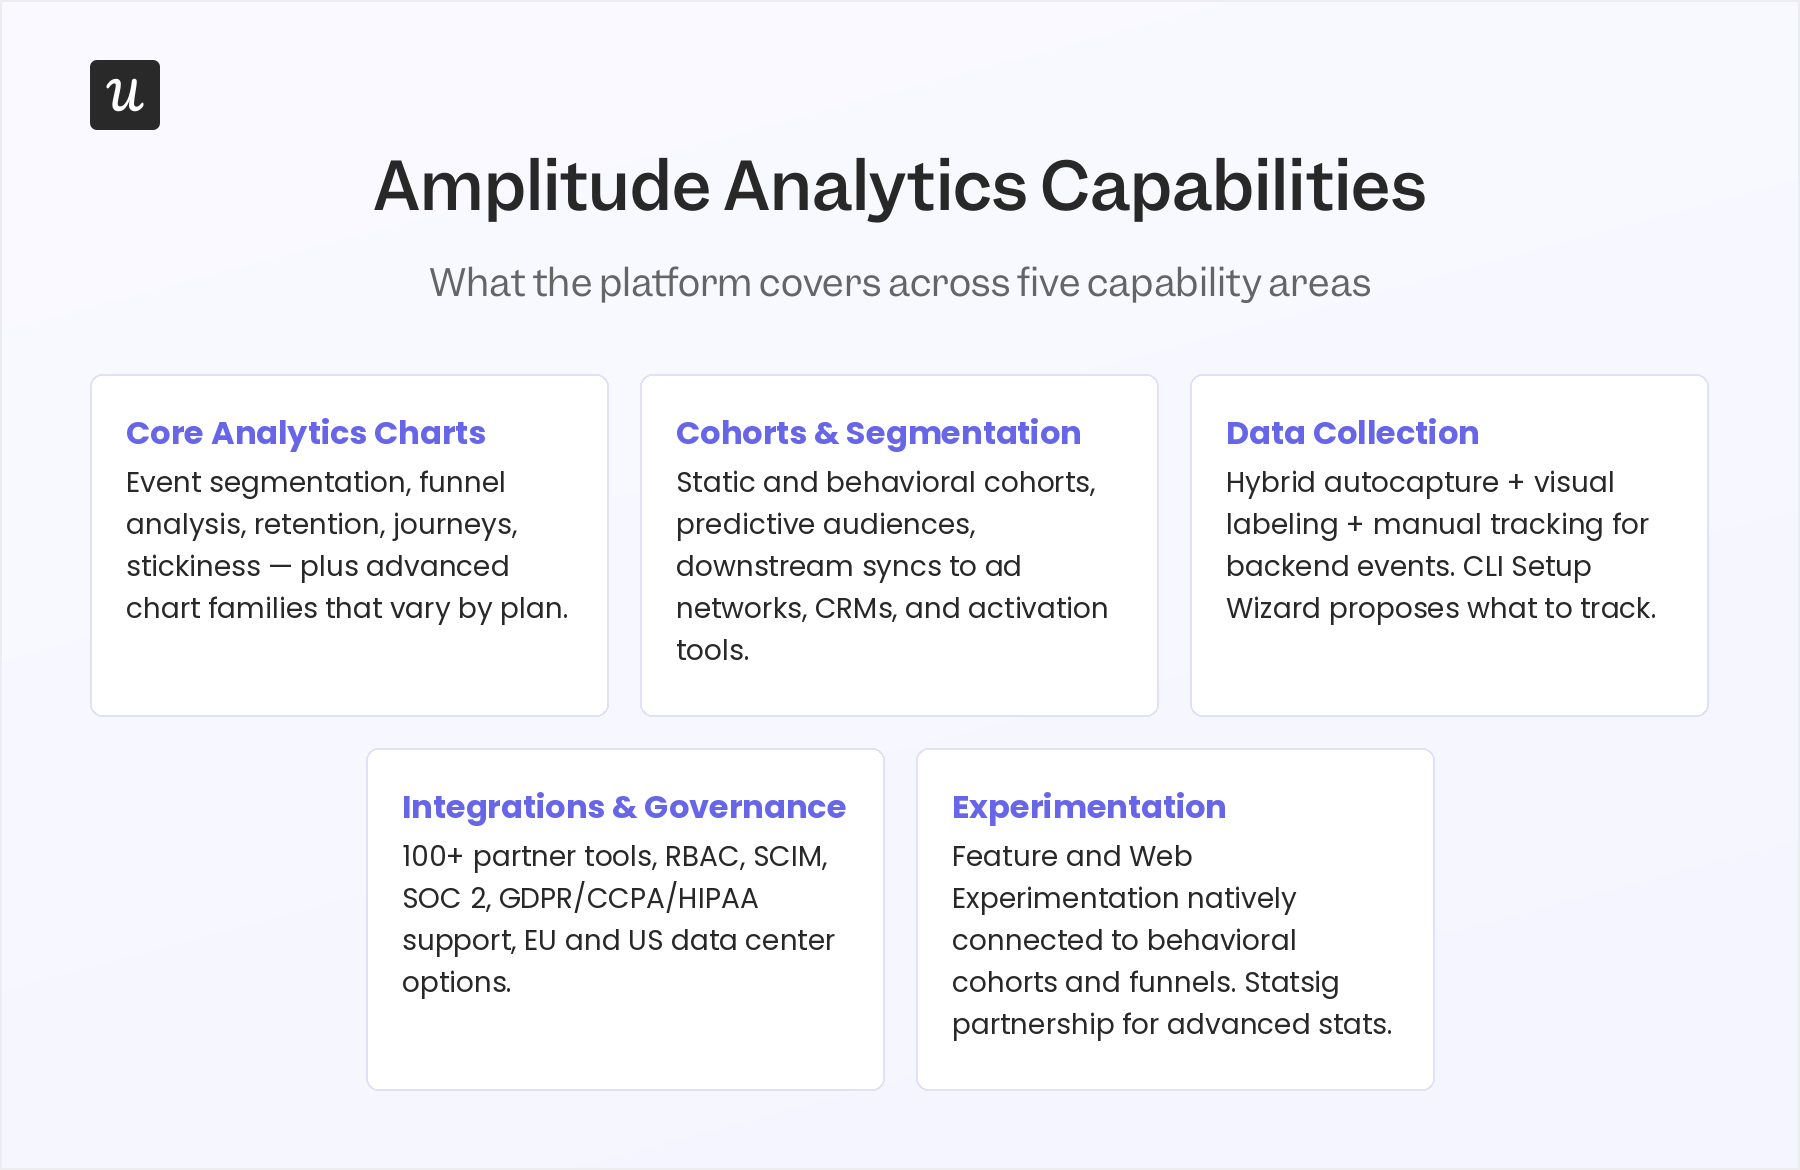
In this article, I cover Amplitude’s full set of analytics capabilities, the AI workflows it now supports, the failure modes I consistently see, what each pricing tier includes, and which teams are a genuine fit for the software.

What analytics capabilities does Amplitude have?
Amplitude’s analytics layer goes deeper than most web analytics tools, which focus on aggregate traffic and page-level performance. It operates at the individual user level, letting you analyze what people do across your site and app, session by session. Unlike Google Analytics, which was built to track website traffic, Amplitude was built from the start for software products, so you can answer product questions.
It has a broad catalog of analytics chart types, and knowing which tier unlocks which ones matters. You can run into analysis gaps mid-project if you’re on a plan that doesn’t include the chart type your question requires.
Core analytics charts
All Amplitude plans include event segmentation, funnel analysis, retention analysis, journeys, data tables, user sessions, and stickiness. More advanced chart families, including engagement matrix, lifecycle, compass, revenue LTV, experiment results, personas, and impact analysis, vary by plan.
- Event Segmentation: Track what users do, how often, and which segments do it. Supports up to 10 events per chart with property filters and saved segments that carry across experiments and other charts.
- Funnel Analysis: Measure conversion across a defined event sequence and locate drop-off. Supports ordered, any-order, and exact-order funnels, with exclusion events to clean up the conversion window.
- Retention Analysis: Measures whether users return after a starting action. Supports up to two return events and usage interval analysis. One practical constraint is that only one user segment can apply to a retention analysis, and it applies to the starting event.
- Journeys: The current pathing experience, replacing the legacy Pathfinder terminology. Shows aggregate user flows before and after key events with include, exclude, and expand controls, configurable conversion windows, and a single-segment constraint per analysis.
- Stickiness: Measures usage frequency and the depth of user engagement, showing which features users return to repeatedly versus those they try once and abandon. It’s a more useful signal than DAU/MAU ratios alone, and one of the charts I find most valuable for post-launch feature health reviews.
Dashboards combine charts, cohorts, and session replays into shared monitoring surfaces, with support for subscriptions and CSV/PDF/PNG exports. Also, Plan-based limits apply to dashboard subscriptions and cohort-related features; check Amplitude’s dashboard documentation for current specifics, as these change with plan updates.
Cohorts, segmentation, and audience building
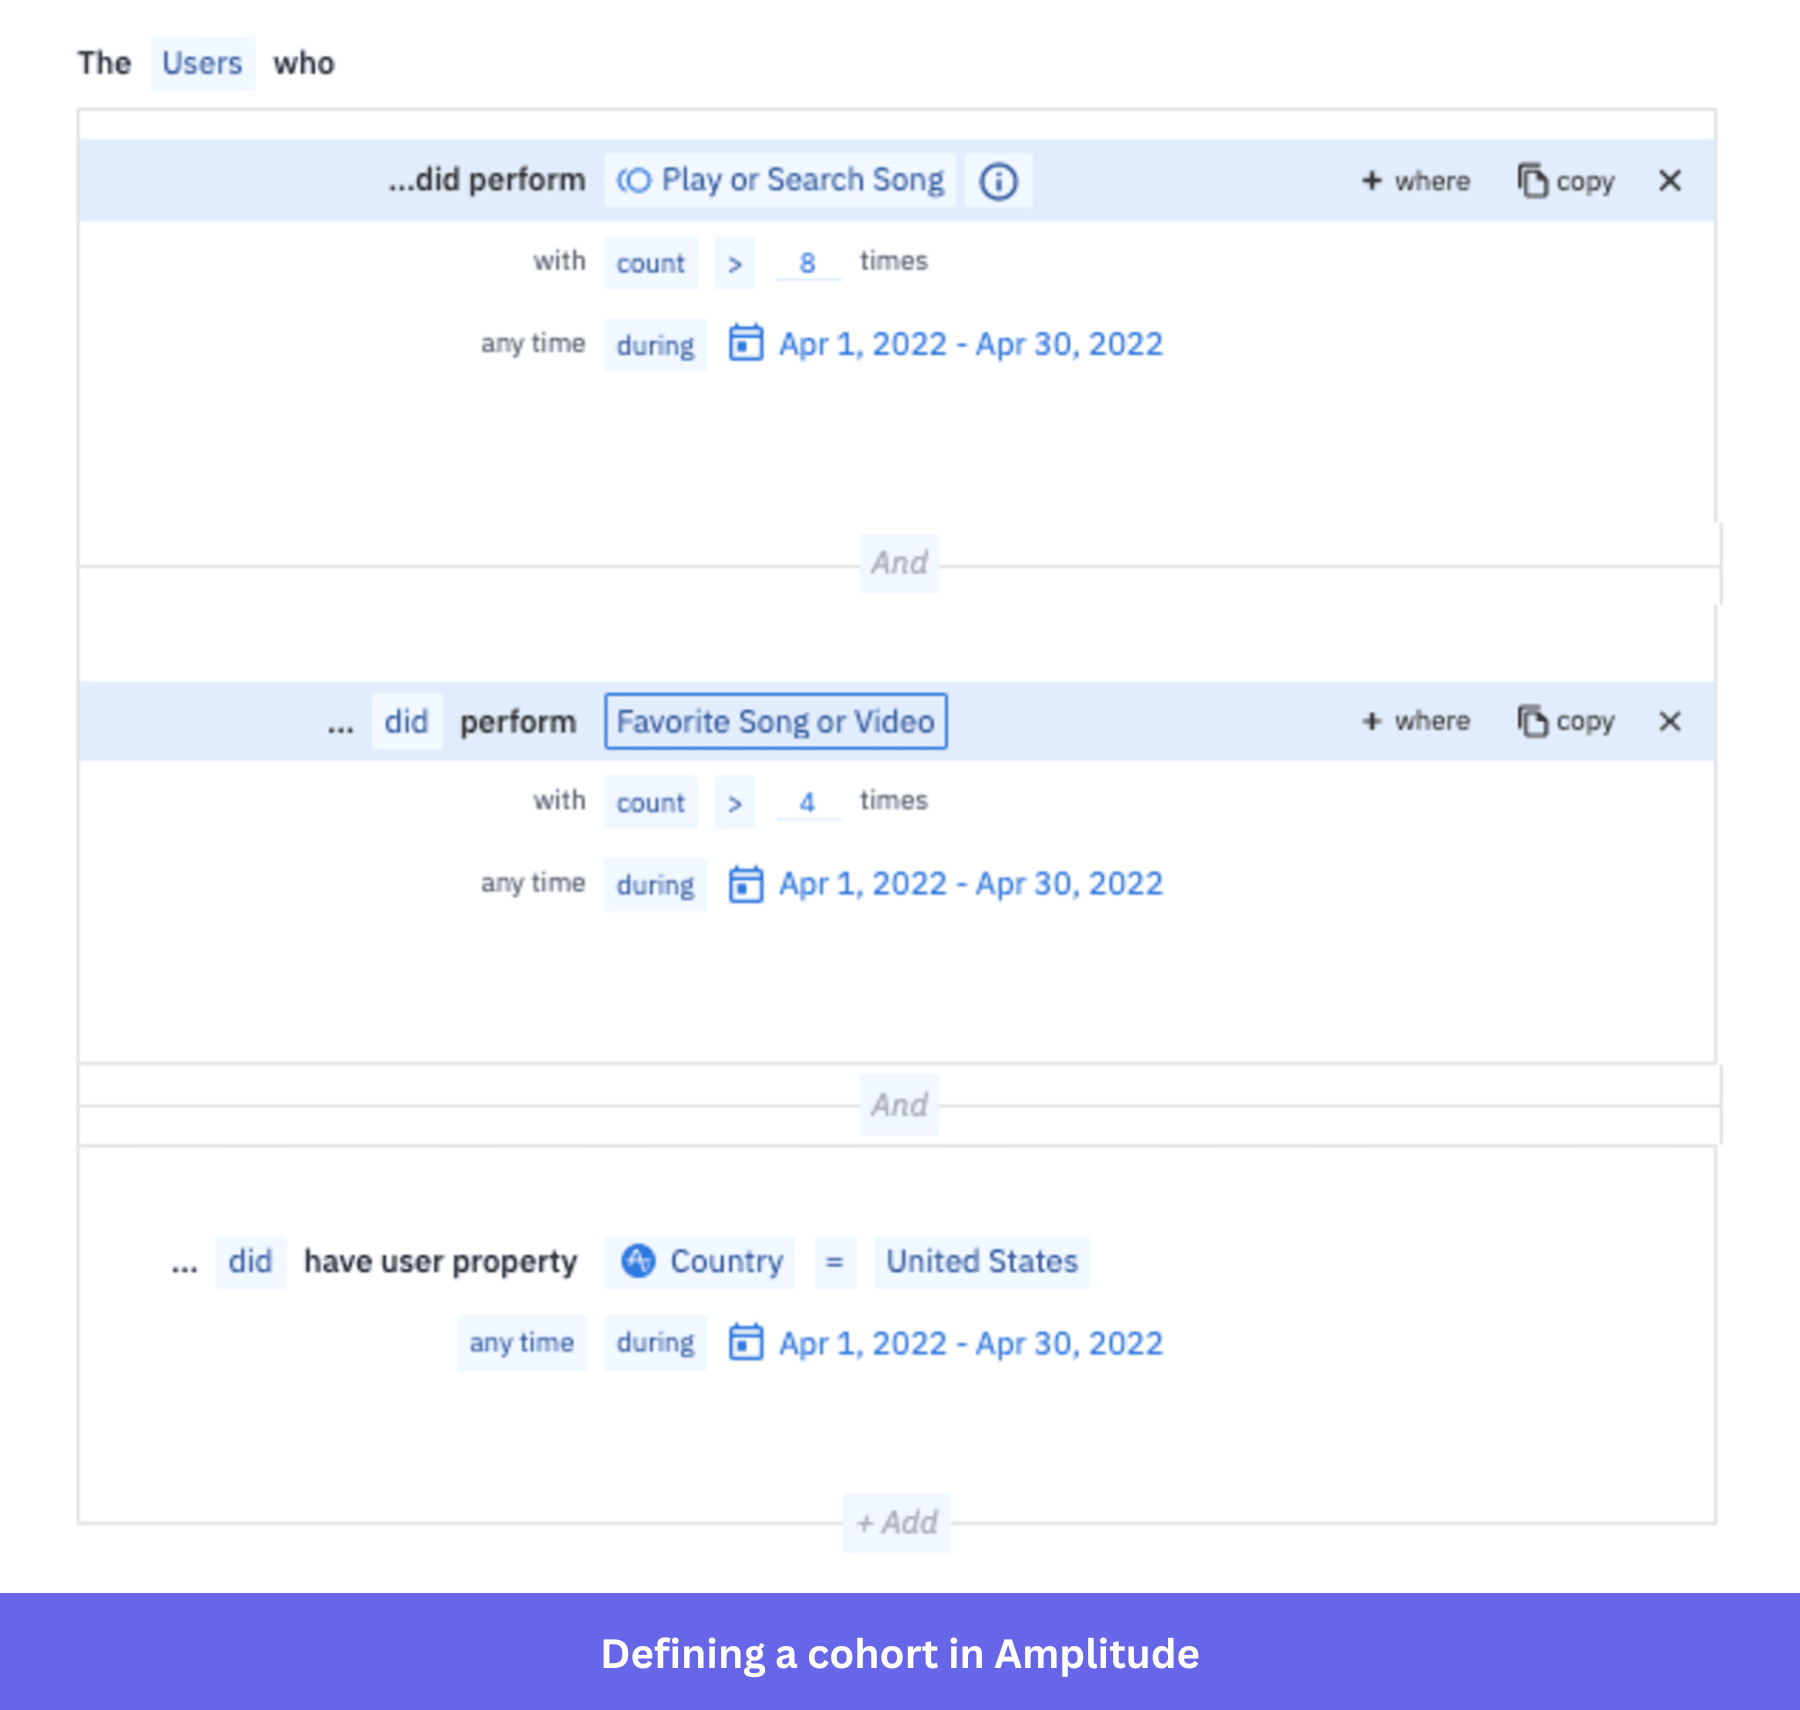
Behavioral cohorting allows you to group users by shared actions to deliver targeted campaigns or personalized in-app experiences. You can build audiences like “users who completed onboarding in the last seven days but haven’t triggered the core feature” and sync them downstream to ad networks, CRMs, or activation tools in near real time. This is particularly useful for identifying churned users, re-engagement targets, or high-value accounts showing early risk signals. Amplitude supports two cohort types, and the difference between them matters for how you use them downstream:
- Static cohorts: Created from Microscope (the user-level data explorer) or by importing a CSV of user IDs, with a maximum file size of 100MB. They snap a group at a given point in time and don’t update it.
- Behavioral cohorts: Dynamic, defined by event sequences and time intervals, and updated automatically.
API-based cohort downloads are limited to 500 per month on Growth and Enterprise plans, with a hard cap of 2 million users per cohort. Enterprise teams running frequent large-scale audience syncs should model that API usage before committing to the contract.
Growth and Enterprise plans also add a predictive layer. Amplitude can forecast which users are most likely to convert or churn and build an audience based on those predictions. Predictive cohorts require a volume of historical event data to produce reliable signals, so this feature earns its value at scale rather than from the start.
Data collection: Autocapture, tracking plans, and user properties
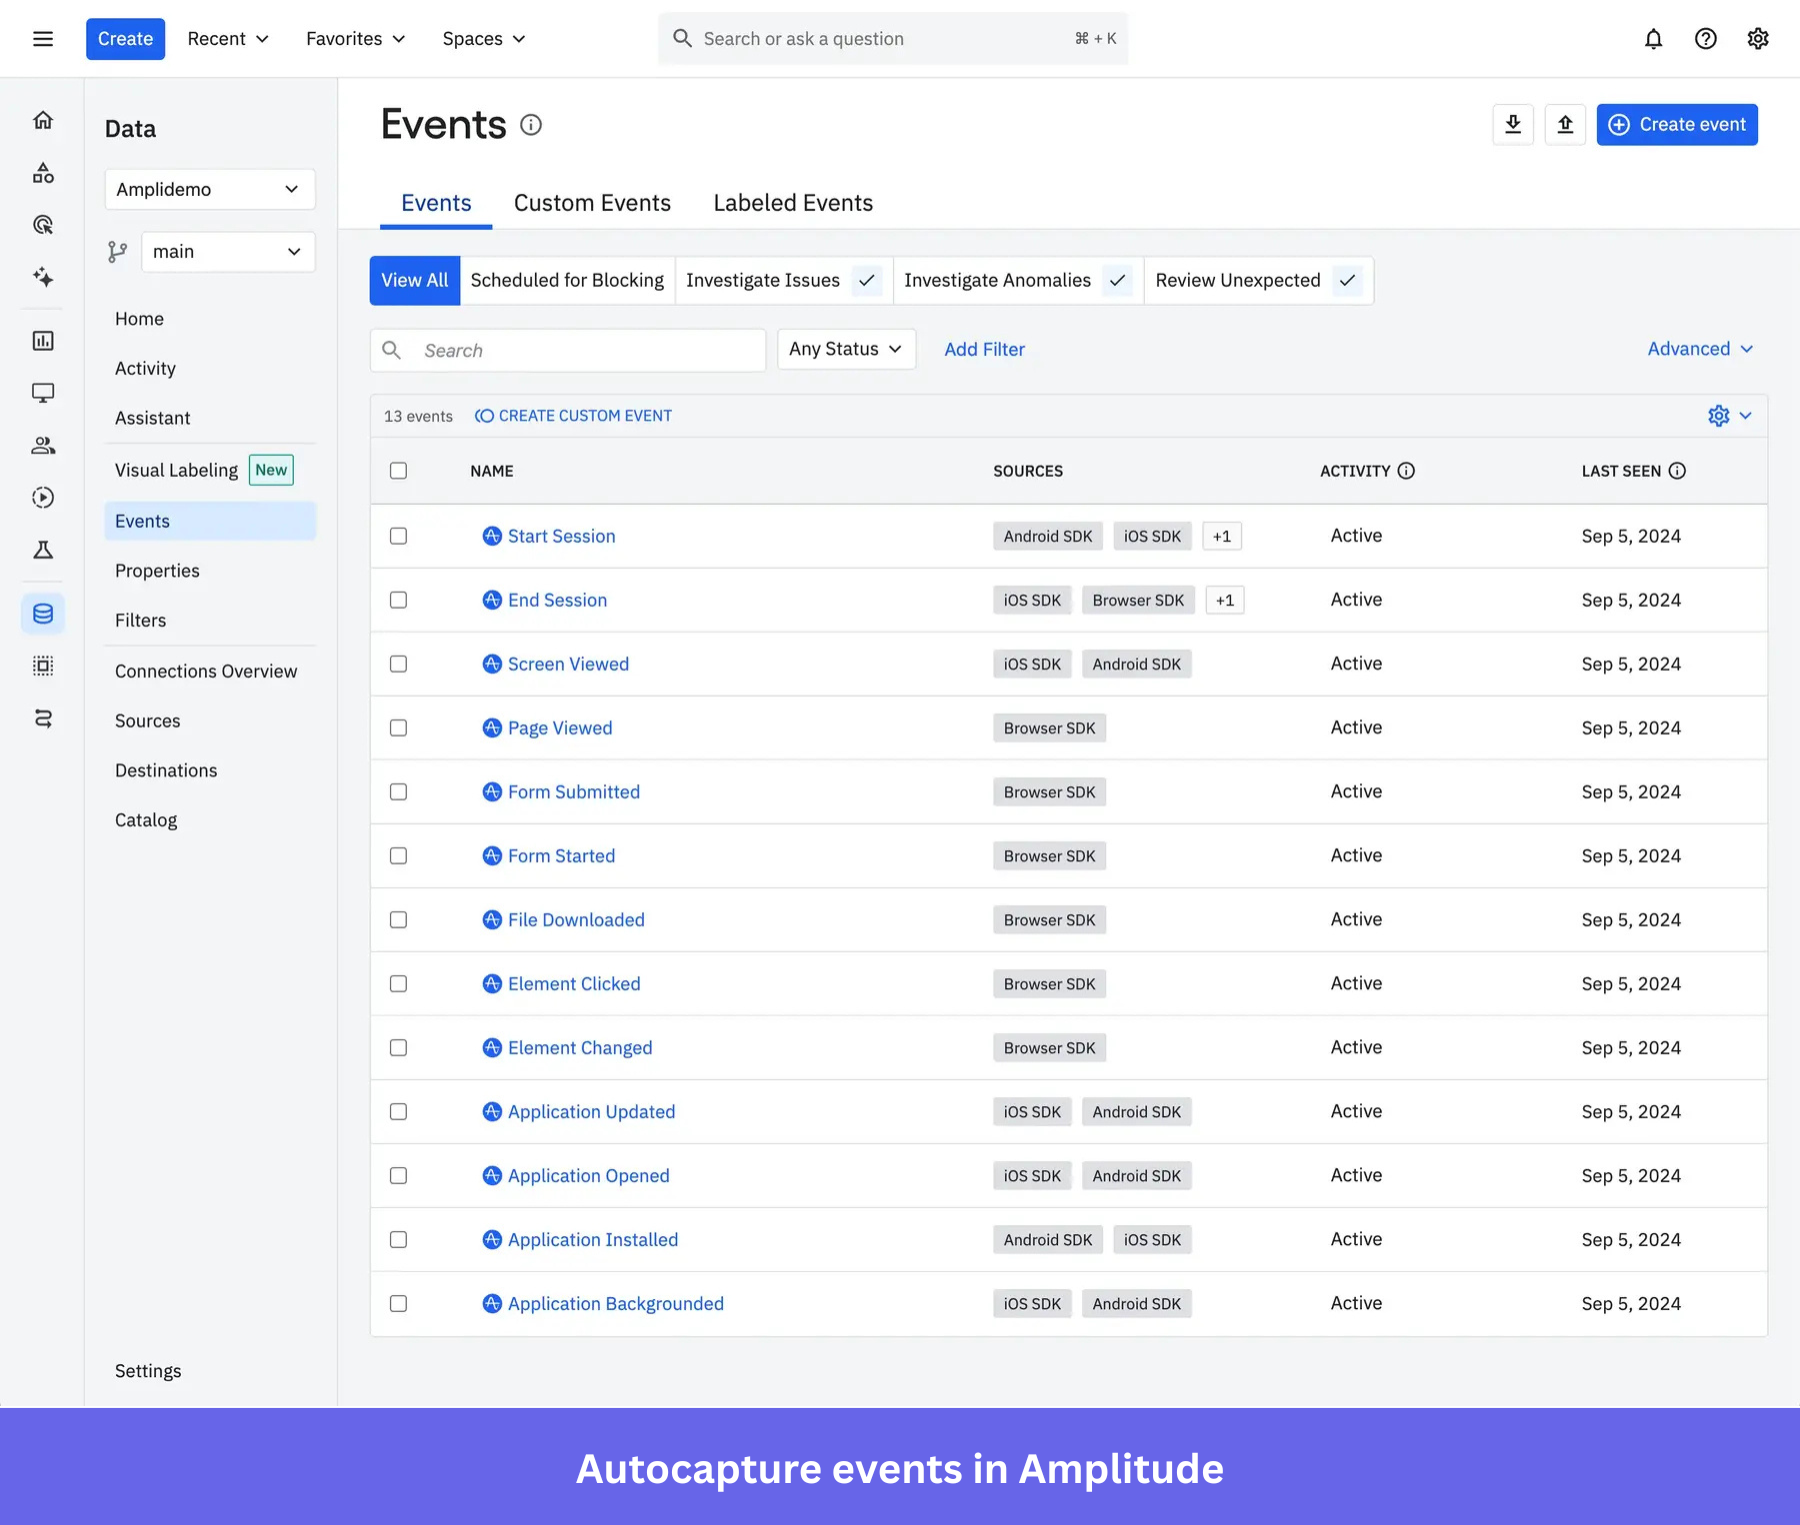
Amplitude’s data collection model is hybrid. Autocapture handles broad frontend coverage, recording clicks, page views, and form interactions from the moment the SDK is installed.
- Visual labeling lets non-technical team members assign meaning to auto-captured interactions retroactively, with no code required and historical data populating immediately.
- Manual tracking then covers backend events where precision is non-negotiable: payments, account upgrades, subscription changes, and other business milestones that frontend instrumentation can miss or misfire on.
The system only works well, though, if there’s a tracking plan underneath it.
Amplitude’s data model is built around a defined schema that turns raw activity into consistent event names, properties, and naming conventions. If you’ve ever inherited an analytics implementation where five teams tracked the same thing five different ways, you’ll understand why this matters.
The platform tries to reduce some of that setup work. Amplitude’s CLI Setup Wizard reads your codebase and proposes what to track, which means you’re not starting from a blank page when creating a tracking plan. Once events are flowing, Observe handles schema validation and ongoing taxonomy management.
One detail that consistently trips up teams is user properties, which persist across future events but are not retroactive. If you update a user’s plan tier from Free to Pro, that change applies to all future events, not to historical ones. The Identify API, which handles property updates, is rate-limited at 1,800 updates per hour per user. 69% of products that reached the top 10% in 7-day activation also ranked in the top 10% for 3-month retention, making accurate event coverage a measurable driver of downstream outcomes.
Integrations, data governance, and export
Amplitude connects to hundreds of partner tools across ad networks, CDPs, data warehouses, attribution platforms, reverse ETL tools, and CRMs. The source catalog covers data ingestion; destination integrations push behavioral cohorts to downstream tools for activation. Session Replay, which is included across all plans, adds qualitative context to this picture by letting teams watch recordings of real user interactions and understand the reasons behind the trends they see in charts.
You can export data via three paths:
- Export API for event-level data.
- Dashboard REST API for chart JSON.
- Behavioral Cohorts API for cohort files.
One nuance for teams that compare chart results to warehouse exports: charts use the project’s local time zone, while the Export API and warehouse exports use UTC. Teams running both in parallel will see discrepancies that are easy to mistake for data quality issues.
Governance controls scale sharply with Amplitude’s pricing plans. Starter has no SSO or advanced permissions. Growth and Enterprise add RBAC, Data Access Controls, taxonomy controls, SCIM provisioning, and audit logs. On the privacy side, Amplitude supports GDPR, CCPA, and HIPAA workflows, offers EU and US data center options, and provides a User Privacy API for handling deletion and access requests.
Amplitude Experiment: What the Statsig partnership means
Amplitude Experiment works within the same data layer as your behavioral cohorts and funnels. There’s no separate data export, no reconciliation across two dashboards, and no lag between an experiment result and the follow-on behavioral analysis. That native integration is the primary reason to consider it over a standalone experimentation tool, because you’re testing directly against the same user definitions you already use everywhere else in Amplitude.
In September 2025, OpenAI agreed to acquire Statsig, the experimentation platform built for engineering and data science teams. Amplitude separately announced a strategic partnership in May 2026 to take on the Statsig brand and customer base and continue maintaining and developing the platform.
The engineering team that built Statsig’s framework moved to OpenAI as part of that transaction. For technical buyers evaluating Amplitude Experiment for advanced statistical use cases, context matters when assessing the roadmap.
Running Variant A for one period and Variant B for the next is the most common experimentation failure I see. Sequential testing fails to isolate the variable because external conditions, including seasonality, campaign activity, and user mix, shift between periods. Amplitude’s concurrent randomization solves this, but teams still need to set sample sizes before the test starts and stick to them. Stopping early because the first week looks positive introduces statistical bias that compounds into false positives.
What AI-powered workflows does Amplitude support?
Amplitude has positioned itself as an AI analytics platform, and its AI capabilities support a range of use cases. Bundling them under a single “AI” label obscures what each one does and where each one breaks down.
- Ask Amplitude / AI Assistant: Enables natural-language queries on your event data, giving non-technical stakeholders clearer insights without requiring a data analyst to pull reports. However, natural language responses are only as good as the underlying event data. A disorganized tracking plan with inconsistent event names yields unreliable results from AI queries, regardless of the model’s capabilities.
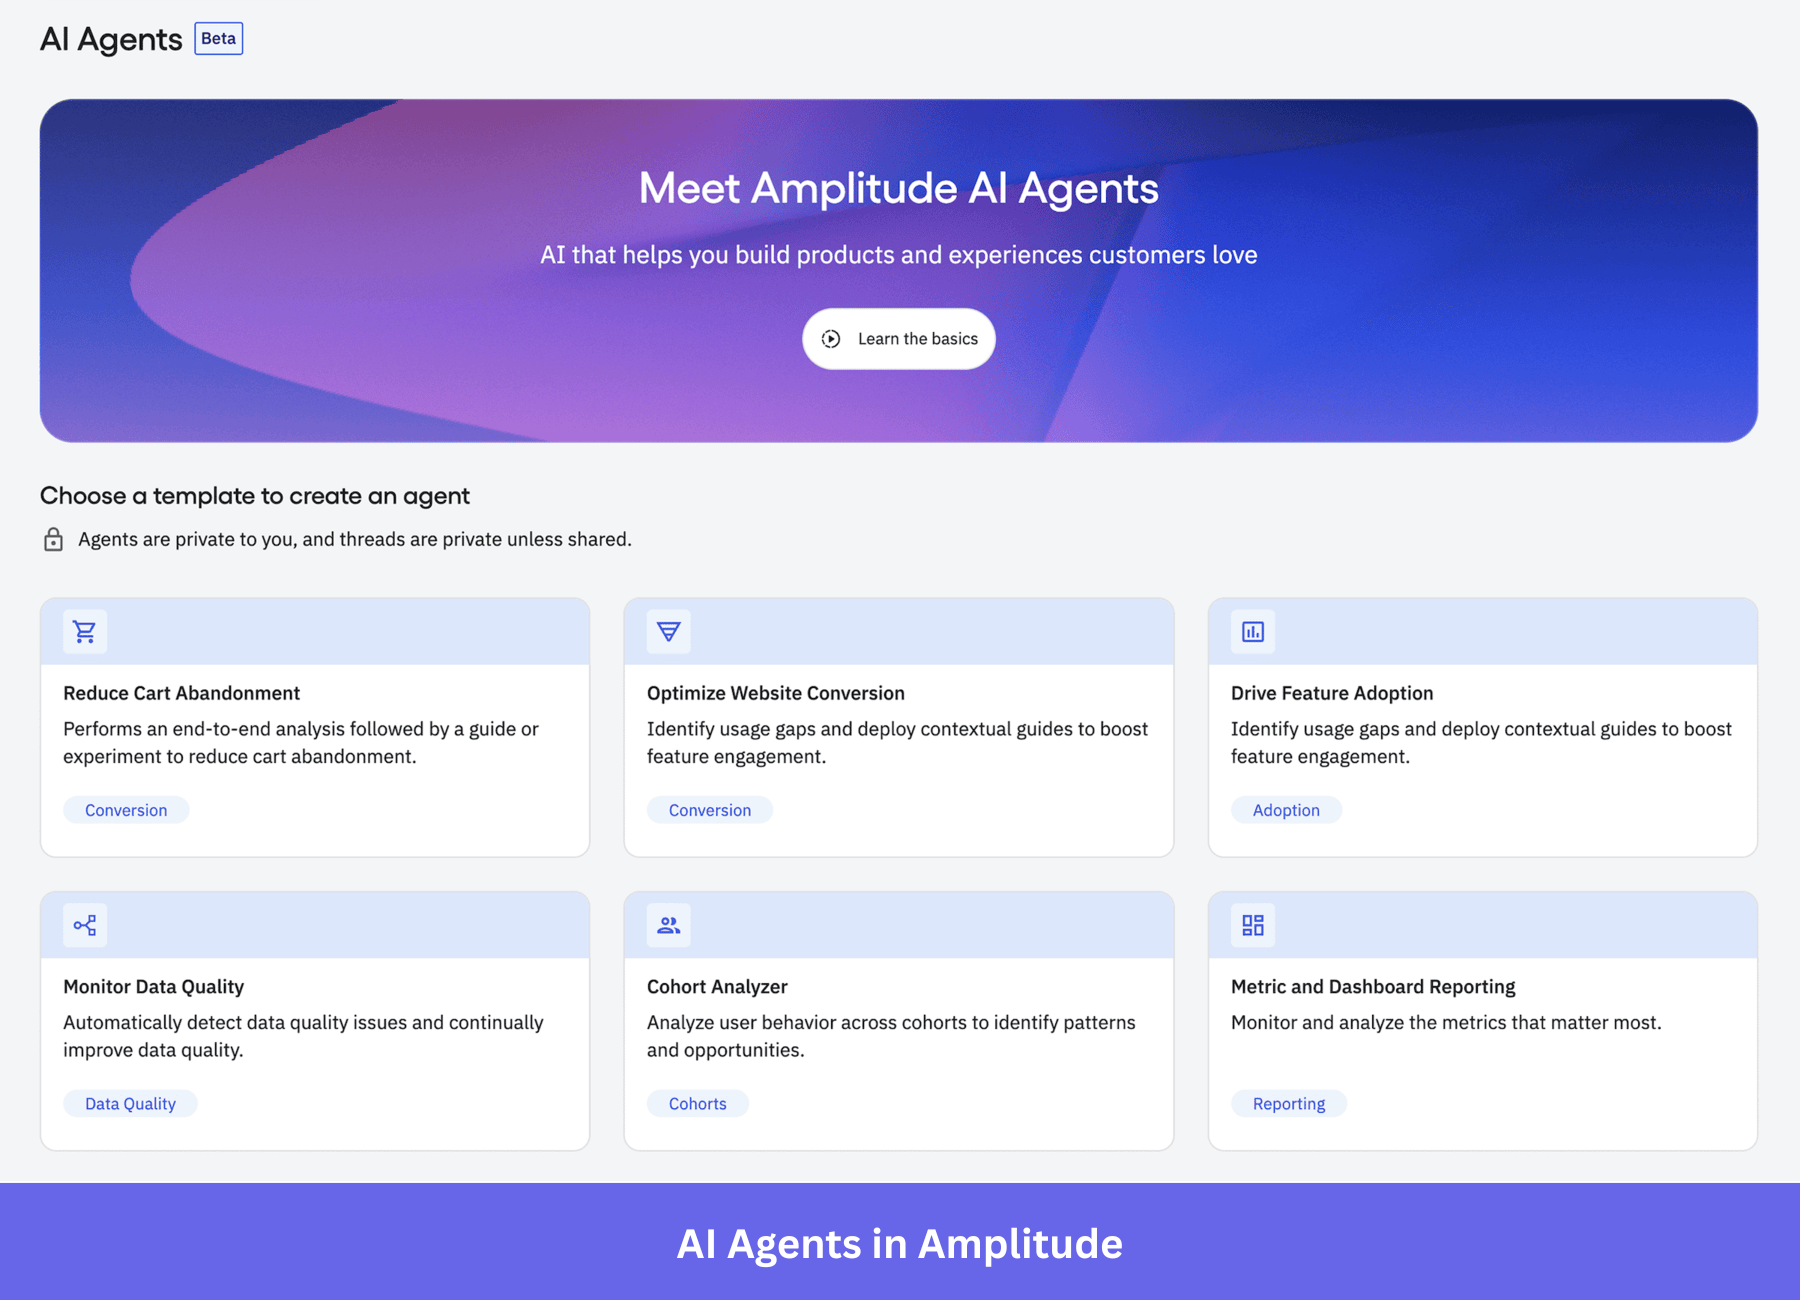
- AI Agents: Automate standard analysis tasks, including cohort reports, funnel breakdowns, and retention curves, from a natural language prompt. AI Agents now drive approximately 25% of platform queries. Amplitude’s own research suggests that human-agent teams using this workflow can cut time to market by up to 40%, which helps explain the rapid adoption. They’re a genuine time-saver for recurring reporting, though not a substitute for analytical judgment on non-standard questions.
- AI Visibility: Tracks traffic to your product from AI referrers and measures downstream behavioral impact. Amplitude’s published materials confirm ChatGPT and Google AI Overview as tracked sources; check the AI Visibility page for the current full list, as coverage continues to expand. Available across all plans with prompt limits that scale by tier: 500 per month on Starter, 1,000 on Plus, 2,500 on Growth, and 5,000 on Enterprise.
- AI Feedback: Adds sentiment analysis to the platform, like tracking user emotions and feedback across sources and distilling them into themes your team can focus on. The goal is to move faster from “users are unhappy” to “here’s the specific thing to fix.”
- Amplitude MCP: An MCP Server integration allowing AI agents to query your product data directly via the Model Context Protocol. Most relevant for engineering-led teams building agentic workflows on top of their analytics stack, and increasingly used in tech companies where engineers write specs directly against behavioral data.
The appeal across all of these is that faster analysis means faster product decisions and, in theory, better products. The consistent limitation is that the AI layer inherits whatever data quality problems exist in the underlying instrumentation. Garbage in, clearer insights out is not how this works.
What are the common issues users have with Amplitude Analytics?
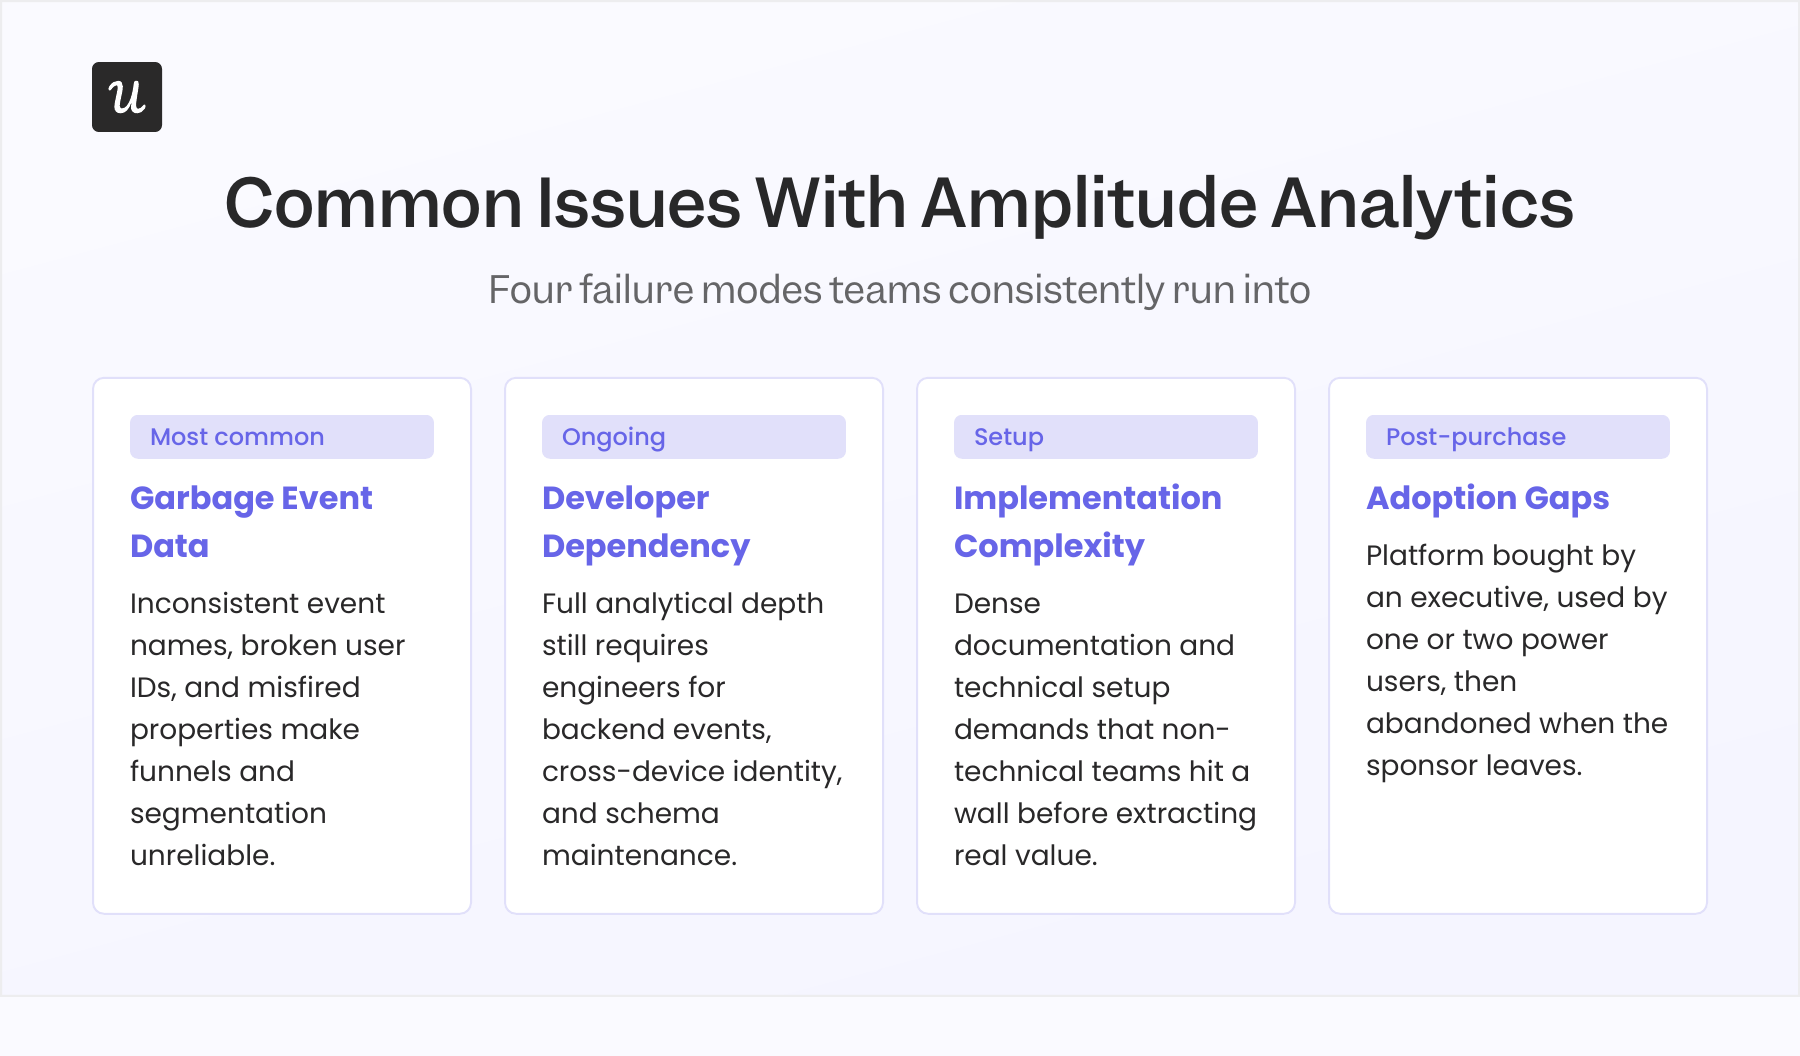
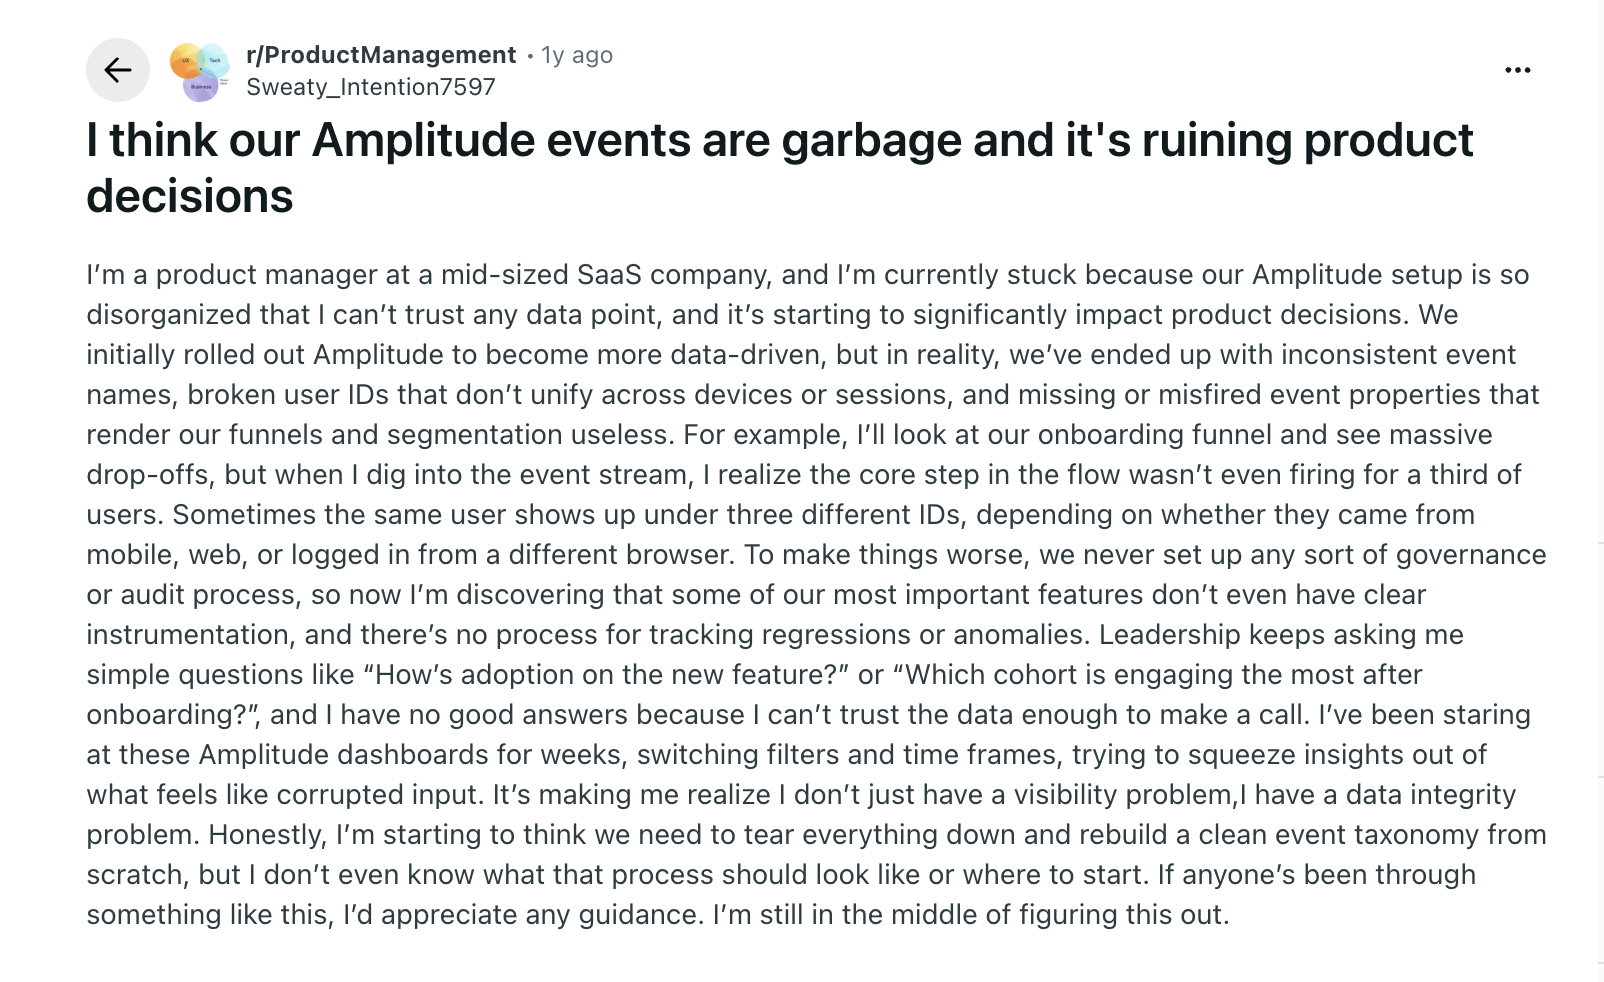
- Garbage event data: The most common frustration I hear from teams using Amplitude is launching the platform only to discover months later that the underlying event data is too disorganized to trust. It starts with basic stuff (inconsistent event names, broken user IDs) and compounds into broken funnels and unreliable segmentation. This is a data governance problem, but Amplitude is where teams surface it most visibly, because the analysis layer depends so heavily on the quality of what’s underneath.
I’ve noticed this problem tends to surface six to twelve months in, well after the initial implementation, optimism has faded. Rebuilding a clean event taxonomy with defined naming conventions, a frontend/backend event split, and a governance process restores confidence in the data, but it requires engineering time and buy-in that many teams underestimate at the start.
- Developer dependency that doesn’t go away: Autocapture and visual labeling lower the barrier to getting initial data into the platform, but Amplitude’s full analytical depth still requires engineers for precise backend event tracking, cross-device identity resolution, and ongoing schema maintenance. In my experience, the pattern is that PMs can run charts and segments independently, but any non-trivial question, such as cross-device user IDs, precise funnel steps, or A/B test instrumentation, still requires an engineering ticket. At smaller teams without a dedicated analytics engineer, that dependency compounds over time. Anybody who has tried to get a clean segment from a tool that requires dev support knows how much it delays campaign timing.
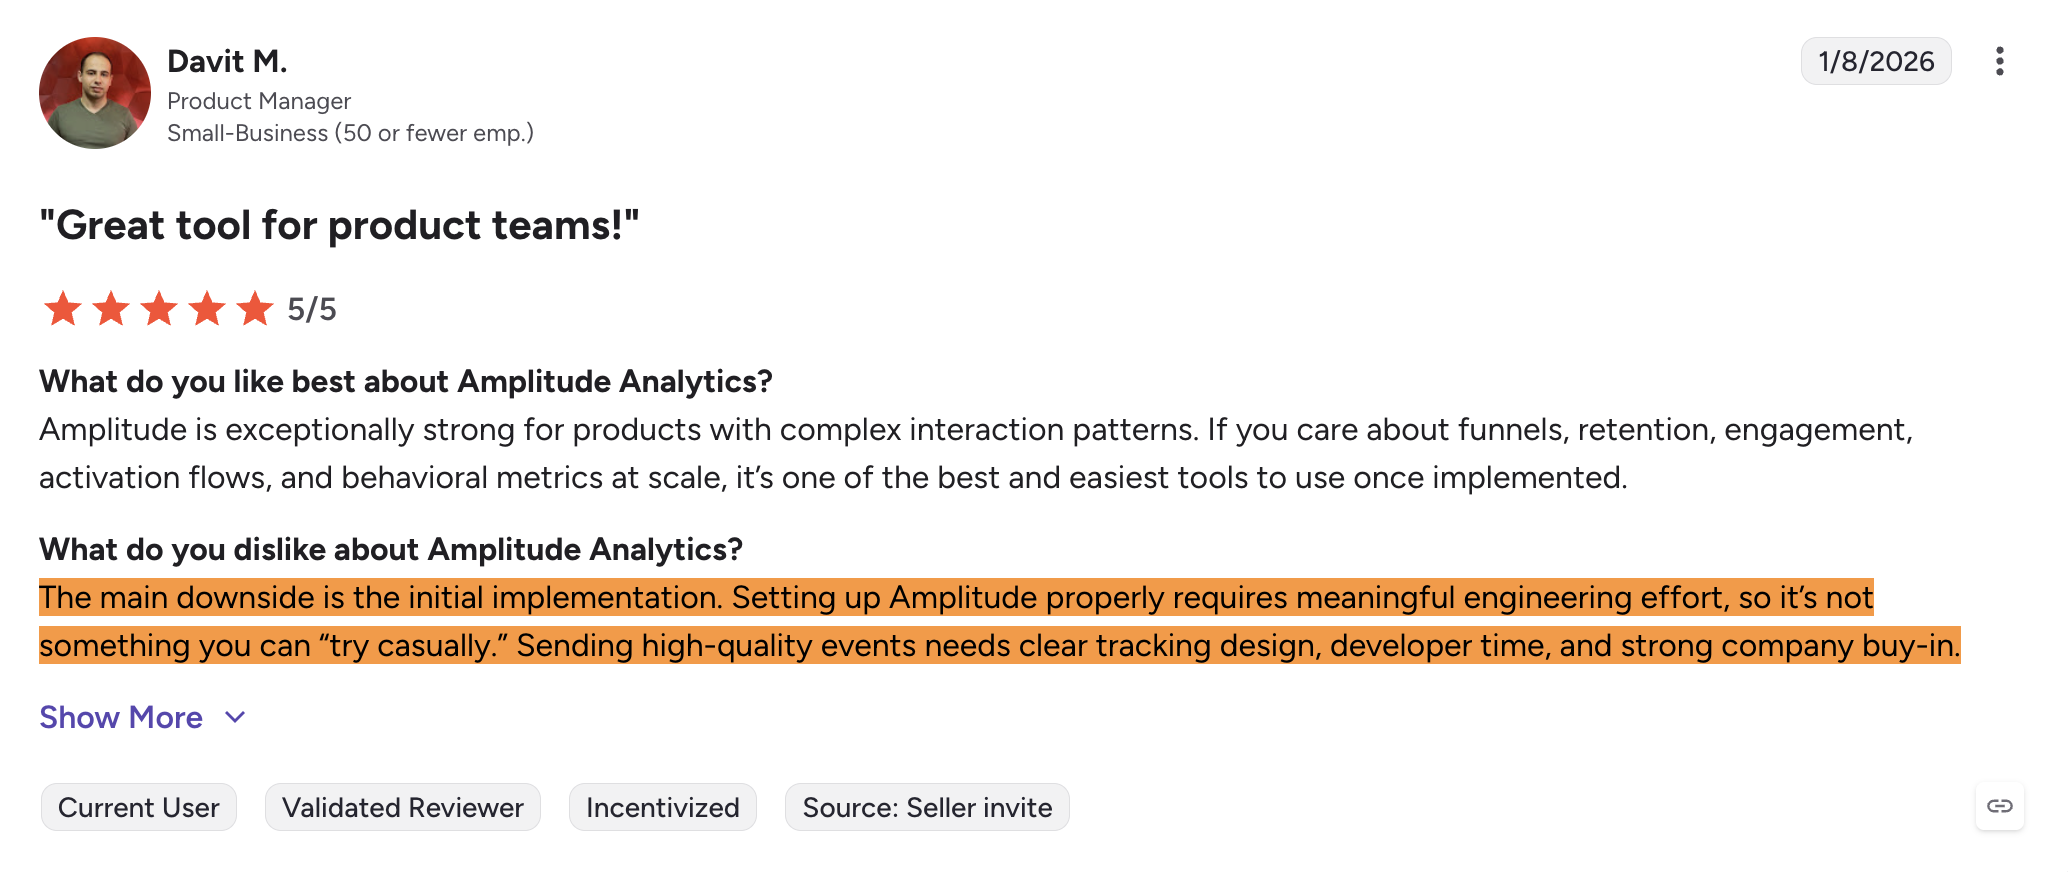
- Implementation complexity: G2 reviews consistently flag setup time and technical prerequisites regardless of company size. The gap between Amplitude’s analytical depth and the effort required to instrument it properly is there. Non-technical teams frequently hit a wall around CSS selectors, dynamic attributes, and backend event configuration that the sales process doesn’t surface in advance. The downside of a tool this powerful is that the setup demands match the ambition.
- Adoption gaps after purchase: A recognizable failure mode: Amplitude gets bought by a CEO, CPO, or VP Product, receives limited internal adoption beyond one or two power users, and then sits mostly unused when that executive sponsor leaves. The tool rewards teams that invest in it deliberately by designating a single owner, providing internal training, and establishing governance processes. Teams that skip that investment tend to pay enterprise pricing for a product that only a fraction of the team ever opens.
How much is Amplitude, and is it worth the price?
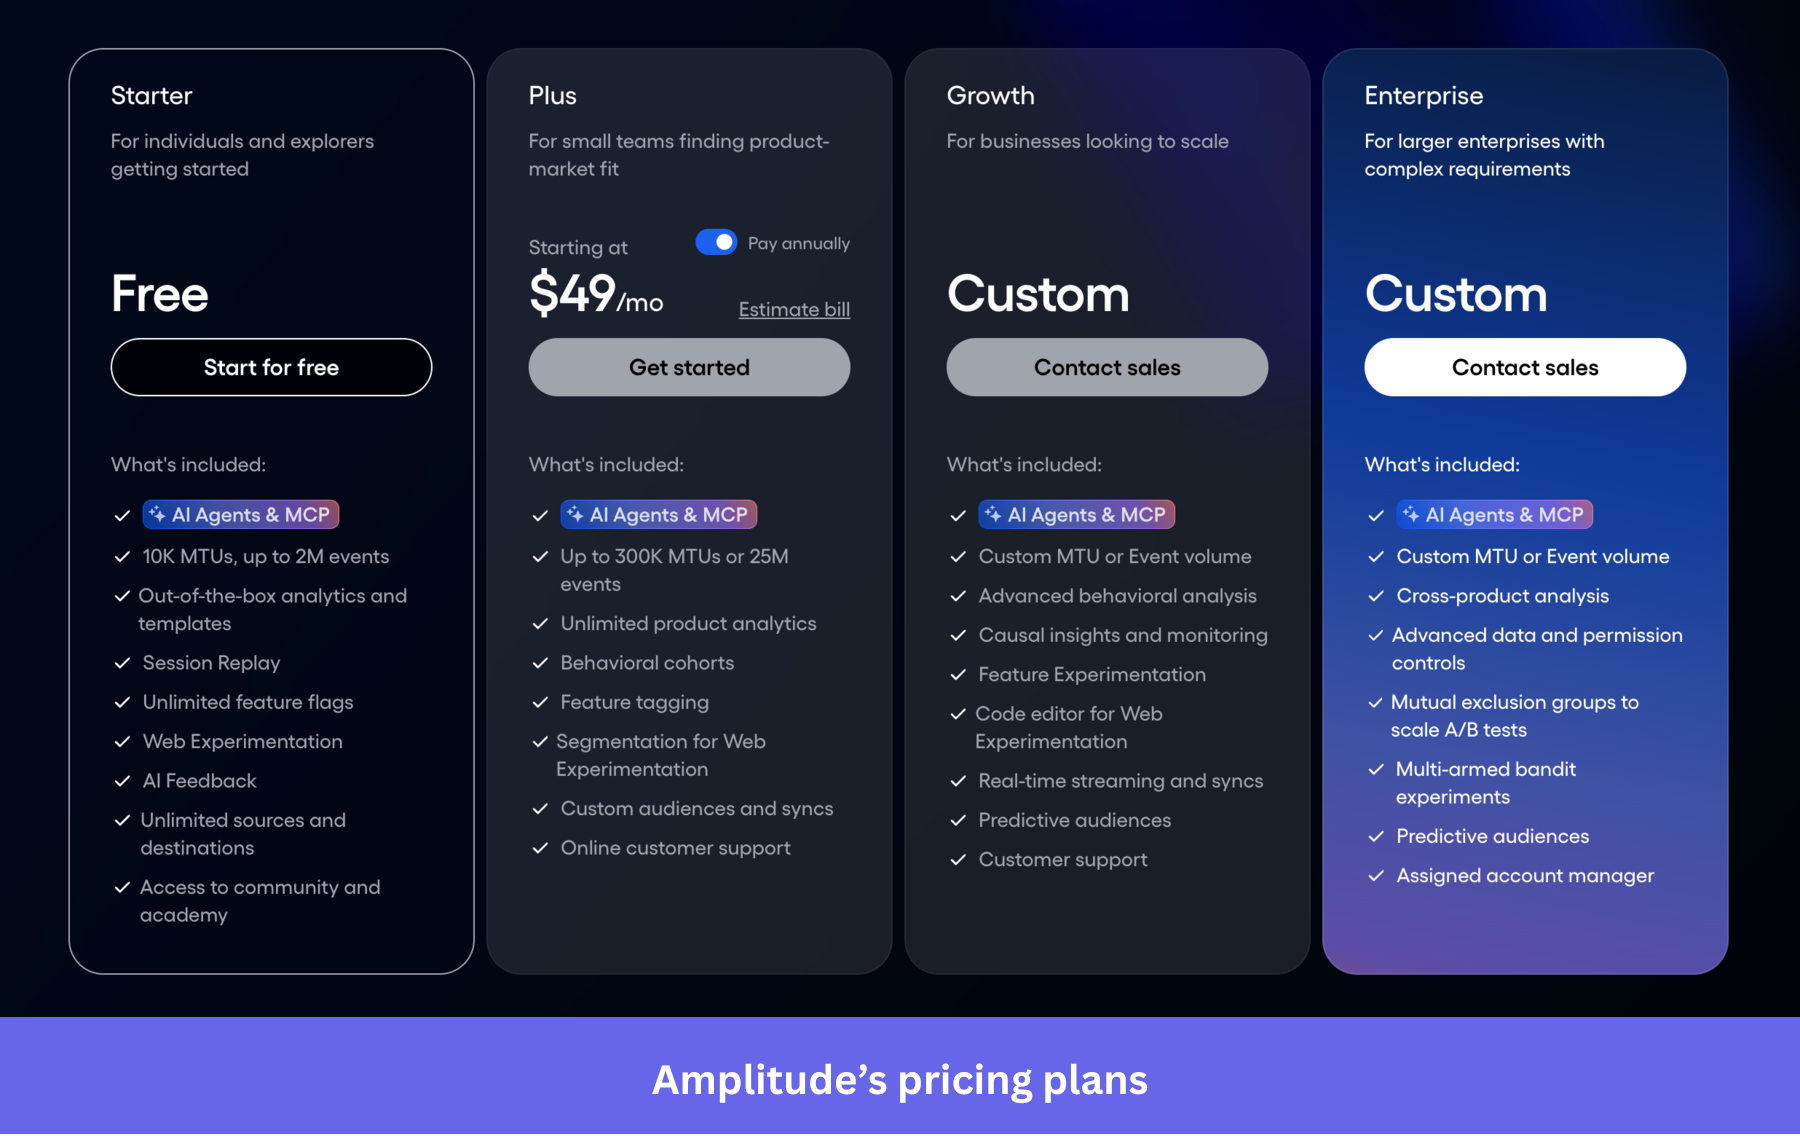
Amplitude’s pricing has four tiers, including:
- Starter is free. It covers 10,000 MTUs and up to 2 million events per month and includes out-of-the-box analytics and templates, Session Replay (1,000 sessions per month), unlimited feature flags, Web Experimentation, AI Feedback, and unlimited sources and destinations.
- Plus starts at $49 per month, billed annually, with a $0.049 per MTU rate up to 300,000 MTUs or 25 million events. It adds unlimited product analytics, behavioral cohorts, feature tagging, and custom audience syncs.
- Growth is custom-priced. It unlocks advanced behavioral analysis, causal insights and monitoring, Feature Experimentation (two active experiment slots, with mutual exclusion groups, multi-armed bandits, and holdout groups available as add-ons), real-time streaming and syncs, and predictive audiences. Amplitude does not publish Growth pricing; third-party procurement platforms like Vendr and independent buyer reviews have cited annual contracts ranging from $30,000 to $150,000 at 100,000 to 500,000 MTUs, though actual pricing varies by negotiation, and these figures are not confirmed by Amplitude.
- Enterprise is also custom-priced. It adds cross-product analysis, advanced data and permission controls, and an assigned account manager.
The MTU pricing dynamic: The downside of MTU billing is its unpredictability for products with viral or seasonal spikes. MTU billing counts monthly tracked users, not events — a user who fires 500 events costs the same as one who fires a single event.
This works well for deeply engaged products with predictable traffic. It works against products in which inflated user counts don’t correlate with revenue-generating behavior. Independent buyer reviews report an 8% automatic renewal markup on the contract renewal date and overage fees that require direct sales negotiation. Amplitude does not publish these terms, and actual outcomes vary. The same sources cite 15 to 30% savings on multi-year commitments and 25 to 35% discounts when buyers negotiate with competing bids from Mixpanel or PostHog.
For teams in the Starter and Plus range, the price-to-capability ratio is strong. The jump from Plus to Growth, from a transparent per-MTU rate to custom pricing, is where it gets harder to justify.
For e-commerce and SaaS teams that do get full value from the platform, the return can be significant. Amplitude has reported a 217% return on investment over a three-year period and 174% year-over-year growth in financial performance. Teams that reach Growth-tier scale without a dedicated analyst, a clean event taxonomy, and genuine internal adoption are paying for depth they won’t extract.
Who’s Amplitude’s ideal customer?
Amplitude delivers the most value to teams with the infrastructure to use it effectively. When that infrastructure isn’t in place, the platform’s depth works against you rather than for you.
Amplitude is the right fit if:
- You’re a Series A to C SaaS company or tech company with 20 to 500 people and at least one dedicated data analyst or analytics engineer who owns the event taxonomy and handles questions the rest of the team can’t self-serve. Without that person, the platform’s depth becomes a liability rather than an asset.
- Your team runs continuous experiments and needs Feature or Web Experimentation natively connected to behavioral cohorts, with no separate tool or data reconciliation overhead. The tight integration between analytics and experimentation is where Amplitude’s breadth pays off most clearly.
- You’re at a scale where warehouse-native queries matter: large event volumes, multiple product surfaces, cross-product analysis needs, or data governance requirements that a lighter tool can’t handle. Teams around the world at this scale (from B2B SaaS to e-commerce) are Amplitude’s core customer base.
- You need enterprise compliance: SSO, custom roles, SOC 2 Type 2, GDPR/CCPA/HIPAA support, EU or US data residency options, and audit logs that satisfy security review processes.
- You want AI Visibility to understand which AI referrers are sending you traffic and how those users behave once they land on your site.
- Your core analytics users are engineers and PMs working in tandem, where engineers instrument carefully and PMs query independently. Amplitude works best as a shared platform rather than a tool one person maintains for everyone else.
Not every team fits that profile, and the teams that don’t tend to get a limited return despite the price they pay. The common thread is a mismatch between what Amplitude requires to function well and what the team has available: an analyst to own the data layer, engineering bandwidth for instrumentation, and internal adoption beyond a handful of power users.
For teams where those conditions aren’t in place, I’d say Userpilot is a better solution. It combines product analytics with in-app engagement, meaning you can see what users do and act on it in the same platform, without opening a second tool or filing an engineering ticket. If any of the following describes your team, it’s worth considering:
- You’re a PMM or product team without analyst support who needs to see behavioral data and act on it in the same platform: building in-app experiences, running surveys, triggering onboarding flows. Running two tools simultaneously can spark ongoing debates over whose numbers are right. That problem doesn’t exist when everything runs from one live, behavior-based data source.
- Your team’s analytics and engagement workflows are split across three or more tools, and the cost of data fragmentation and dev dependencies is higher than that of a unified platform.
- You’re below the scale where Amplitude’s depth earns its price. Teams that exhaust the Plus tier quickly face a steep jump to custom Growth pricing that’s difficult to justify without a mature data practice.
- You need a code-free setup and real-time behavioral segmentation that non-technical team members can manage and update without engineering support. Analytics tools get technical fast, and without an analyst, the gap between what Amplitude can do and what your team extracts from it widens over time.
- The implementation burden and learning curve of Amplitude’s full setup are blockers your team won’t realistically clear.
Want to see how Userpilot handles product analytics without the implementation overhead? Book a demo, and we’ll walk through it with your specific use case.
Userpilot strives to provide accurate information to help businesses determine the best solution
for their particular needs. Due to the dynamic nature of the industry, the features offered by
Userpilot and others often change over time. The statements made in this article are accurate
to the best of Userpilot’s knowledge as of its publication/most recent update on June 10,
2026.
About the author