My Practical Guide to Click Tracking for SaaS Products


Most teams today are already collecting some form of product usage data, but very few are confident they’re doing it well. In Revenera’s 2025 software usage analytics report, only 38% of teams say they can gather product usage data effectively, and 29% collect data without analyzing it.
From what I’ve seen, the problem is rarely the lack of data. It’s how that data is structured, managed, and used over time.
In this guide, I’ll walk you through how I approach click tracking for SaaS products, based on my experience working with product teams. Specifically, I’ll cover:
- The types of click data you can collect for SaaS.
- How click tracking in SaaS differs from email and web tracking.
- A step-by-step process for tracking user behavior and acting on it.

What’s click tracking in SaaS products?
Click tracking is the process of recording user interactions with in-app elements such as buttons, links, menus, and calls to action, and using that data to understand user behavior. This is typically done using click analytics or product growth tools that capture user activity in the background and present it through reports, funnels, and behavioral trends.
For SaaS companies, click tracking goes beyond counting interactions. It’s an analytics strategy that helps you answer product questions like:
- Is your target audience clicking the key actions that lead to user activation?
- Do power users engage with the features that support retention?
- Are in-app campaigns working as intended or being ignored?
What types of click data can you collect for SaaS products?
Click tracking in SaaS usually falls into three categories, each capturing a different part of the customer journey.
- Email click tracking: When you send product emails, whether for onboarding sequences, feature announcements, or re-engagement campaigns, your email service provider tracks which links users click by routing them through a tracking redirect before landing on the destination. This happens in milliseconds and is typically invisible to the recipient. The data shows how users engage with your messaging, how many recipients click on each link, which CTAs resonate, and whether emails drive conversions. Most email platforms have specialized tools to handle this automatically, but the insight becomes more useful when you tie it to in-app behavior.
- UTM link tracking: When users arrive at your product from digital marketing campaigns such as Google ads, social campaigns, and referral programs, UTM parameters appended to URLs show exactly where they came from and which campaign drove them. This is how SaaS businesses attribute acquisition accurately and focus on what’s working. Most teams also use a link tracking tool to manage and standardize these URLs across campaigns.
- In-product UX click tracking: This is where the bulk of product insight comes from. Using heatmaps, session recordings, and event-based analytics, teams capture how users interact with the product interface. This helps build a complete picture of user behavior, revealing which elements get attention, which features users ignore, where frustration builds, and conversion rates across key steps. Unlike the first two methods, this data doesn’t organize itself. Teams need to define what gets tracked and how events are structured, so the quality of insight depends heavily on event setup and governance.
How is click tracking in SaaS different from email or web tracking?
Email and web tracking are largely acquisition-driven. They evaluate marketing efforts by measuring how visitors engage with email campaigns, landing pages, and other website content. SaaS tracking is more retention-driven. It measures how well your product delivers on the promise made by your marketing.
Here’s a breakdown of the key differences:
- Authenticated vs. anonymous users: Web and email data are anonymous or session-based. Even when you have an email address, the data is often limited to a specific campaign or marketing channel. In a SaaS product, every click is tied to a persistent user or account ID. This makes it possible to connect interactions to lifecycle stages, user segments, and actions that lead to paying customers. The data is more valuable, but it also demands stricter discipline in how it’s tracked and interpreted.
- Product state vs. static content: Websites and emails are relatively static, so tracking is often a “set it and forget” event. On the other hand, SaaS products are dynamic and state-dependent. A click on a “Save” button can mean different things depending on the page the user is on or the plan they’re subscribed to. On top of that, SaaS products change frequently. New features and updates can affect how events are tracked. Without regular maintenance, tracking breaks over time, leading to gaps and inconsistencies in the data.
- Behavioral depth over traffic volume: Email and web tracking focus on metrics such as open rates, click-through rates, bounce rates, and traffic from marketing efforts, often measured in tools like Google Analytics. In SaaS, the focus shifts to feature adoption, workflow completion, and how deeply users engage with the product.
- Event taxonomy: Email tracking is mostly handled by default tools, and web tracking relies on standard page and session events. In SaaS, teams define their own event structure across features and workflows. Without a clear taxonomy, data becomes difficult to trust, which affects everything from reporting to customer acquisition cost analysis and retention efforts.
- Cross-functional impact: Web and email tracking are primarily used by marketing teams to optimize marketing spend and evaluate campaign performance. In a SaaS environment, click data becomes a shared source of insight across the company. Product uses it for roadmap decisions, Customer Success uses it to reduce churn, and Sales uses it to identify expansion opportunities that drive actual revenue. This means a single tracking issue can lead to flawed product decisions and missed opportunities for revenue growth.
How does click tracking help with improving product experiences?
Now that you’ve seen the differences, let’s discuss several ways click tracking can improve your product experience.
Understand what features different user segments engage with the most
Not all user groups interact with your product in the same way. Tracking these differences helps you identify which features deliver the most value and how engagement varies across your user base.
One of my favorite ways to approach this is to slice feature usage by segments such as new users, activated users, and power users. This gives me a clearer view of how engagement evolves with time and which users are driving key metrics.
For example, a feature that sees high overall usage might be driven almost entirely by a small group of power users, while new users barely interact with it. Without segmentation, that gap is easy to miss, yet it’s crucial for improving overall user engagement.
Userpilot makes it easy to segment users and analyze feature engagement across different groups. Here’s an example:
Identify friction and bugs to achieve sustainable growth
Feature usage reports show you engagement trends, but they rarely explain why engagement drops or where users run into friction.
That’s where I rely on session replays.
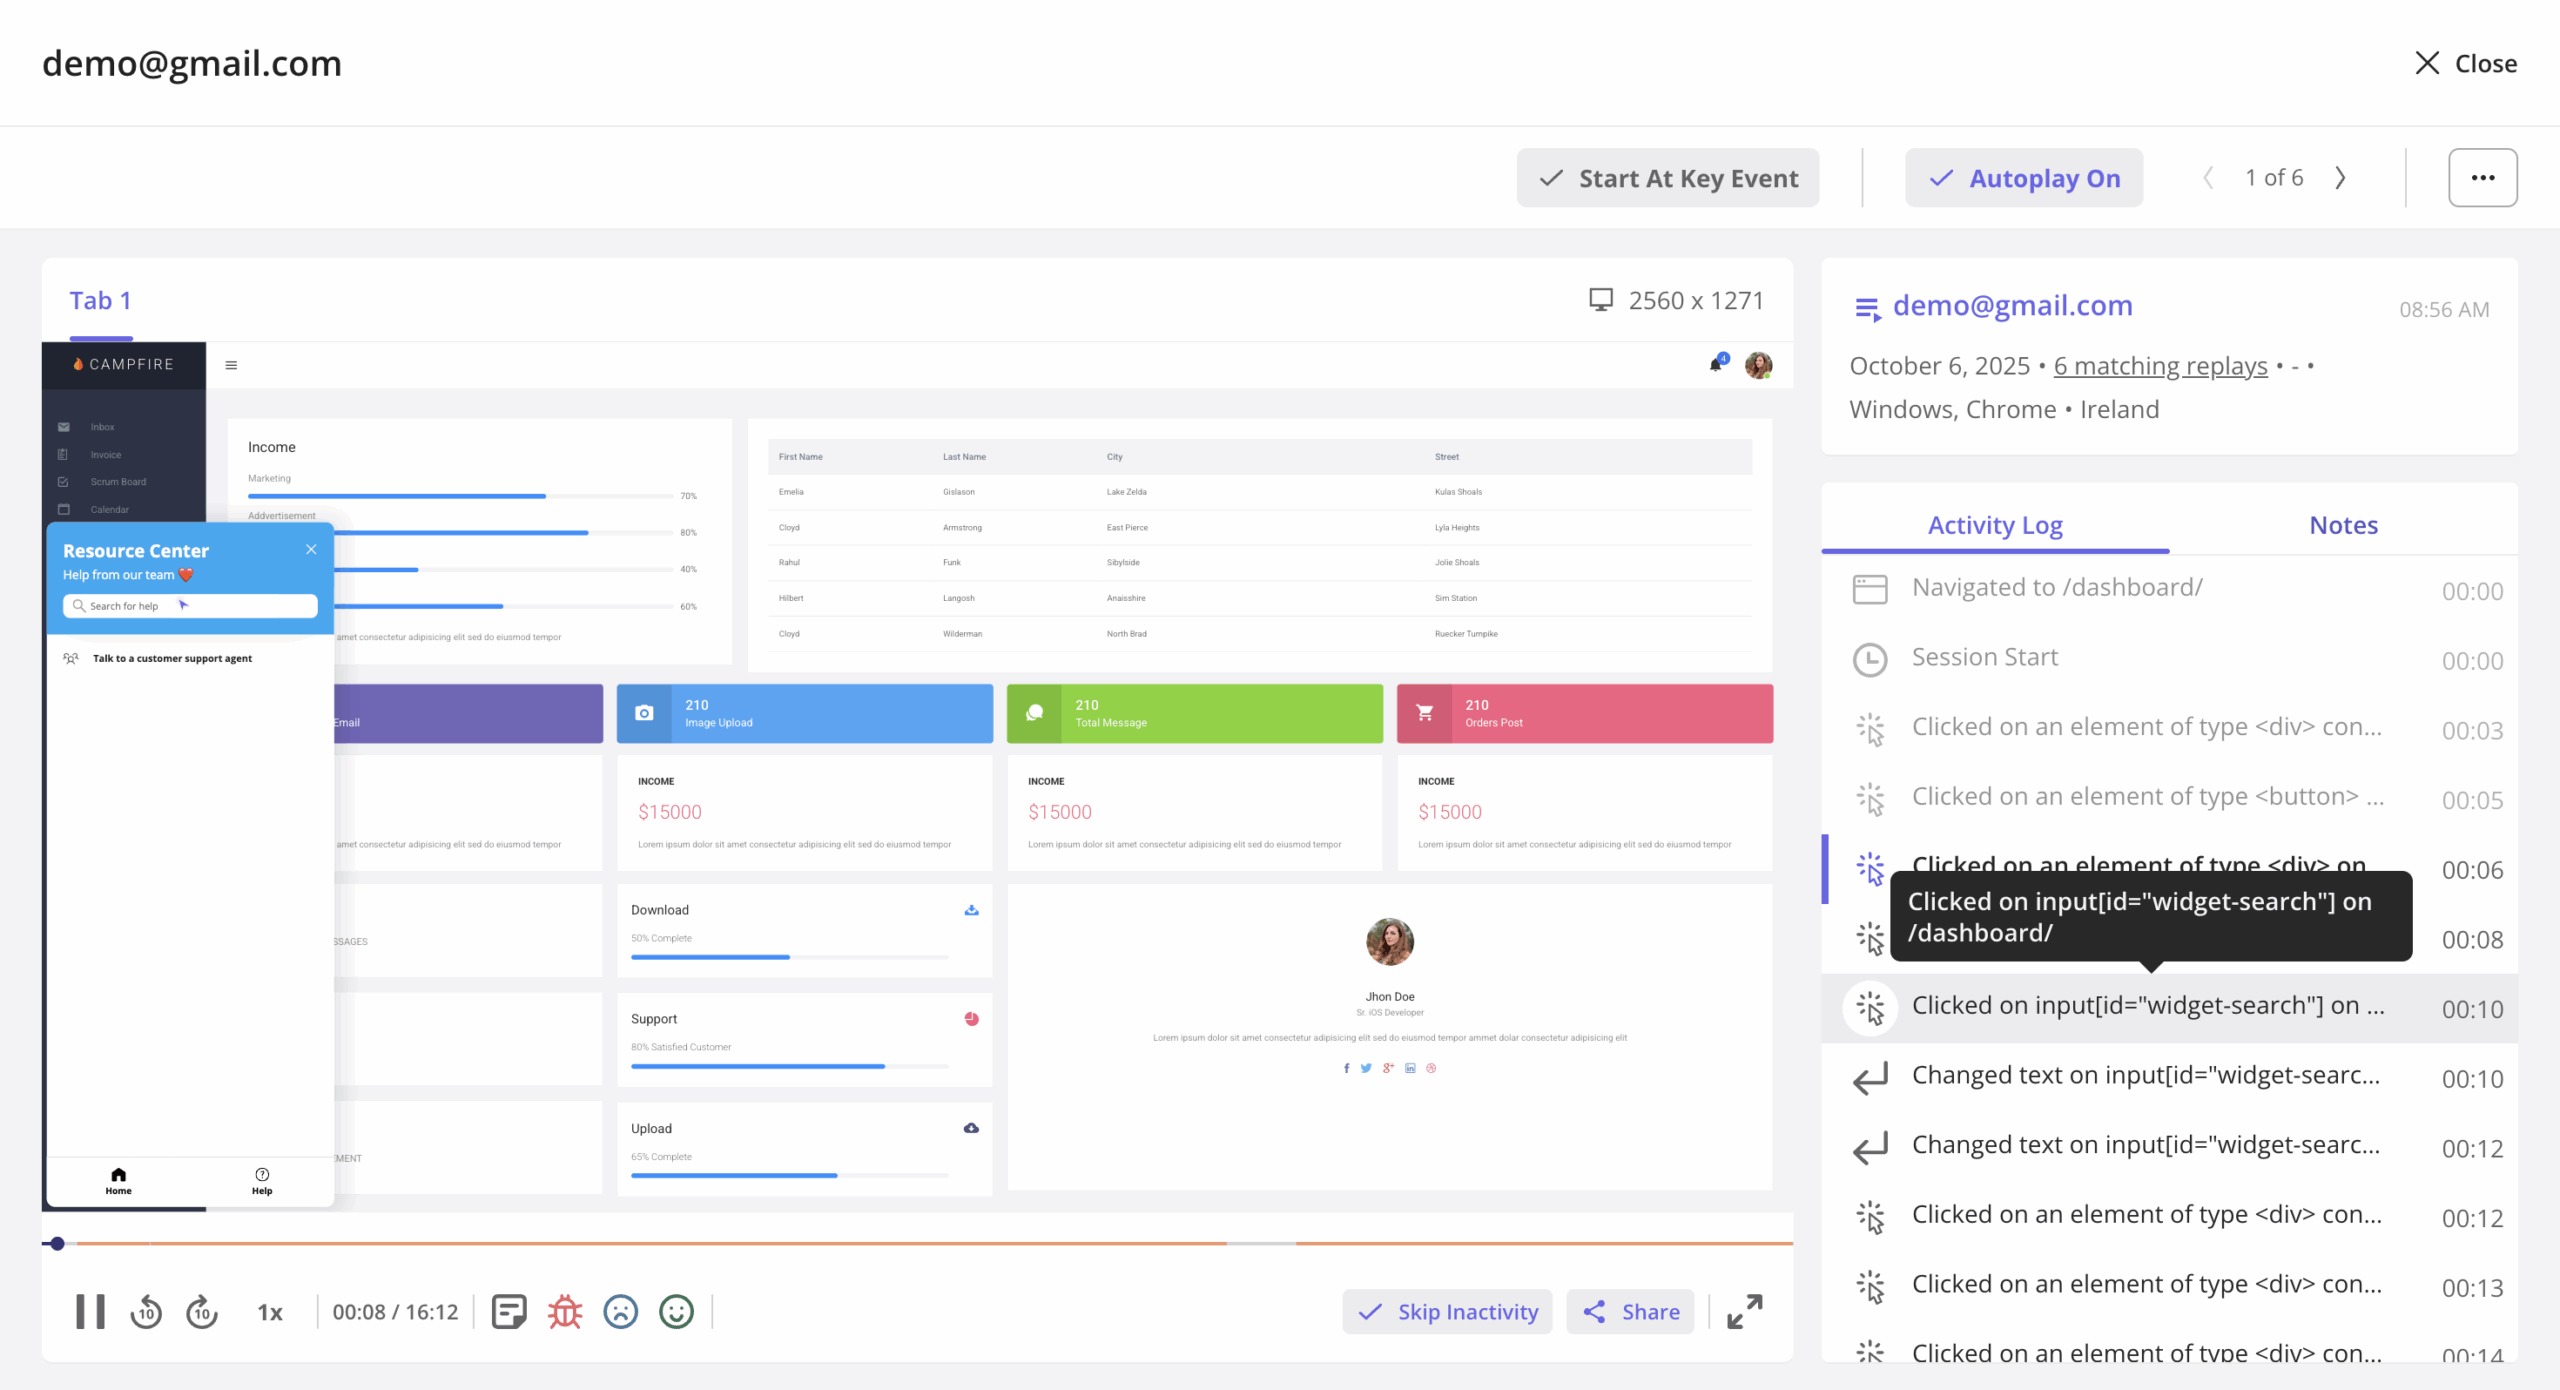
A session replay is a reconstruction of a user’s journey inside your product. The underlying mechanism is that a replay tool captures changes to your platform’s Document Object Model (DOM) as users interact with your product, then rebuilds the session so you can see clicks, scrolls, mouse movements, inputs, and navigation as they happened.
For example, if a drop-off appears in your onboarding flow and you pull out a replay of that session, you’ll see exactly where users hesitate or abandon the process. This makes it easier to spot broken elements, confusing UI patterns, or flows that don’t work as expected.
Userpilot’s session replay feature makes this analysis seamless by allowing you to:
- Filter sessions based on specific events, segments, or user actions.
- Watch exactly what users did before encountering an issue.
- Add notes and share replays with your team for faster debugging.
Improve user engagement and product adoption
Some friction points will require engineering support, whether for debugging or more significant interface changes.
But in my experience, that’s often the exception. Most of the time, the solution is to guide users more clearly through the product using contextual in-app elements such as checklists, tooltips, hotspots, and interactive walkthroughs.
This is exactly how Amplemarket approached the problem.
After using Userpilot to track user events and analyze session replays, their team identified where users were missing or underusing key features. Then they introduced interactive walkthroughs and in-app prompts to guide users at the right moment, helping them connect features to their actual workflows.
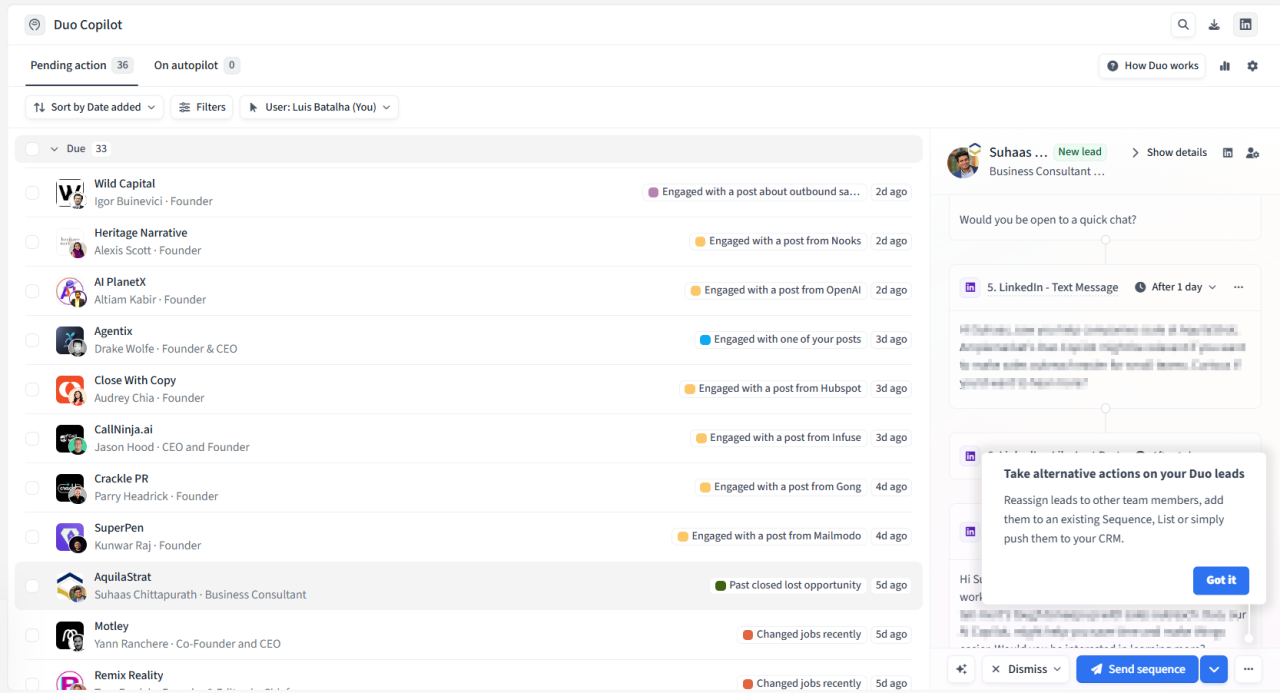
The result was a significant increase in feature adoption without adding unnecessary complexity to the product:
“Whenever I add a nudge to a new feature, it boosts adoption by 5x, even 10x.” — Awni Shamah, Staff Product Manager at Amplemarket
What’s the biggest challenge with click tracking in SaaS?
People assume the hardest part of click tracking is technical implementation, but most teams can ship events without much trouble. In my experience, the biggest challenge is managing and governing data over time.
As your product evolves, new features get added, teams change, and tracking needs grow. Without a clear structure, event data becomes inconsistent and difficult to use for decision-making.
Let’s break down the most common challenges I’ve seen, along with solutions:
1. Misalignment with business goals
Teams often track what’s easy to capture, such as button clicks or page views, instead of what actually reflects user intent or product success. This leads to dashboards full of activity but very little insight. A better approach is to define events based on decisions you want to make, such as improving activation, adoption, or retention.
For example, rather than track dozens of clicks in your onboarding flow, focus on a few events that clearly signal activation. If you’re a marketing automation tool, that might mean tracking when a user launches their first campaign or sets up their first workflow. This way, when you ask, “What percentage of new users reach activation?”, you know exactly which event to use and can trust the answer.
2. Event taxonomy and naming inconsistencies
Without clear naming conventions, your team will end up tracking the same action in multiple ways. A product manager might build a funnel using “signup_completed,” while another uses “user_registered,” and no one realizes they’re measuring the same thing. Technically, you can still run the funnel, but the conclusion will be wrong because the underlying event is inconsistent.
Over time, these inconsistencies compound. You end up with duplicate or overlapping events, and it becomes difficult to know which one to trust, especially in tools like Amplitude, where teams rely heavily on event names to build reports.
The fix is to adopt a consistent naming structure and maintain a shared event dictionary that everyone follows. For example, your team might decide that every time a new user signs up, the event is always called “User Registered.” Once that definition is set, no one creates variations like “signup_completed” or “new_user_signup.” Instead, they reuse the same event and add context through properties if needed.
3. Lack of ownership and governance
Event tracking often sits between product, analytics, and engineering, which means no one fully owns it. As a result, events are added ad hoc, without review or long-term maintenance.
The solution is to assign clear ownership. Product defines what should be tracked, analytics defines how it is structured, and engineering handles implementation.
If your team is large or scaling quickly, it also helps to introduce a lightweight review step before new events go live, so you can catch inconsistencies early.
4. Insufficient documentation and discoverability
Even when events are defined correctly, teams often lack a reliable way to understand what exists and how it should be used.
What helps here is maintaining an up-to-date event dictionary that clearly documents event names, definitions, properties, and ownership.
More importantly, it needs to live in a place your team actually uses, not a spreadsheet that gets updated once and forgotten.
Notion or a shared internal wiki is a good place to start. As your setup becomes more complex, you can move to dedicated data governance or analytics tools that offer built-in dictionaries and validation.
How to track clicks in your SaaS products with Userpilot?
There’s no shortage of tools that offer click tracking. What makes Userpilot different is how easy it is to access and analyze data without relying on engineering or complex setups.
This section will provide a step-by-step breakdown of how to track clicks with Userpilot.
To make it more concrete, I’ll occasionally reference how Liv-ex approached click tracking with Userpilot. Their product team needed better visibility into user behavior without relying heavily on engineering, which is a common challenge in SaaS teams.
Step 1: Figure out what you’re tracking and how
Not every click happens the same way, so before setting anything up, you need to identify whether the action you want to track is a front-end interaction or a server-side event.
- If it’s a front-end interaction like a button click, form submission, or text input, autocapture handles it automatically. Just go to Settings → Data Capture & Privacy and switch it on. From that point, Userpilot records every qualifying interaction across your product without any code.
- If it’s a server-side event like a payment completing or a record being created in the backend, you’ll need to use Tracked Events. Your developer sends the event to Userpilot using a simple SDK call: userpilot.track(“Created an Invoice”). You can also attach metadata to give the event more context.
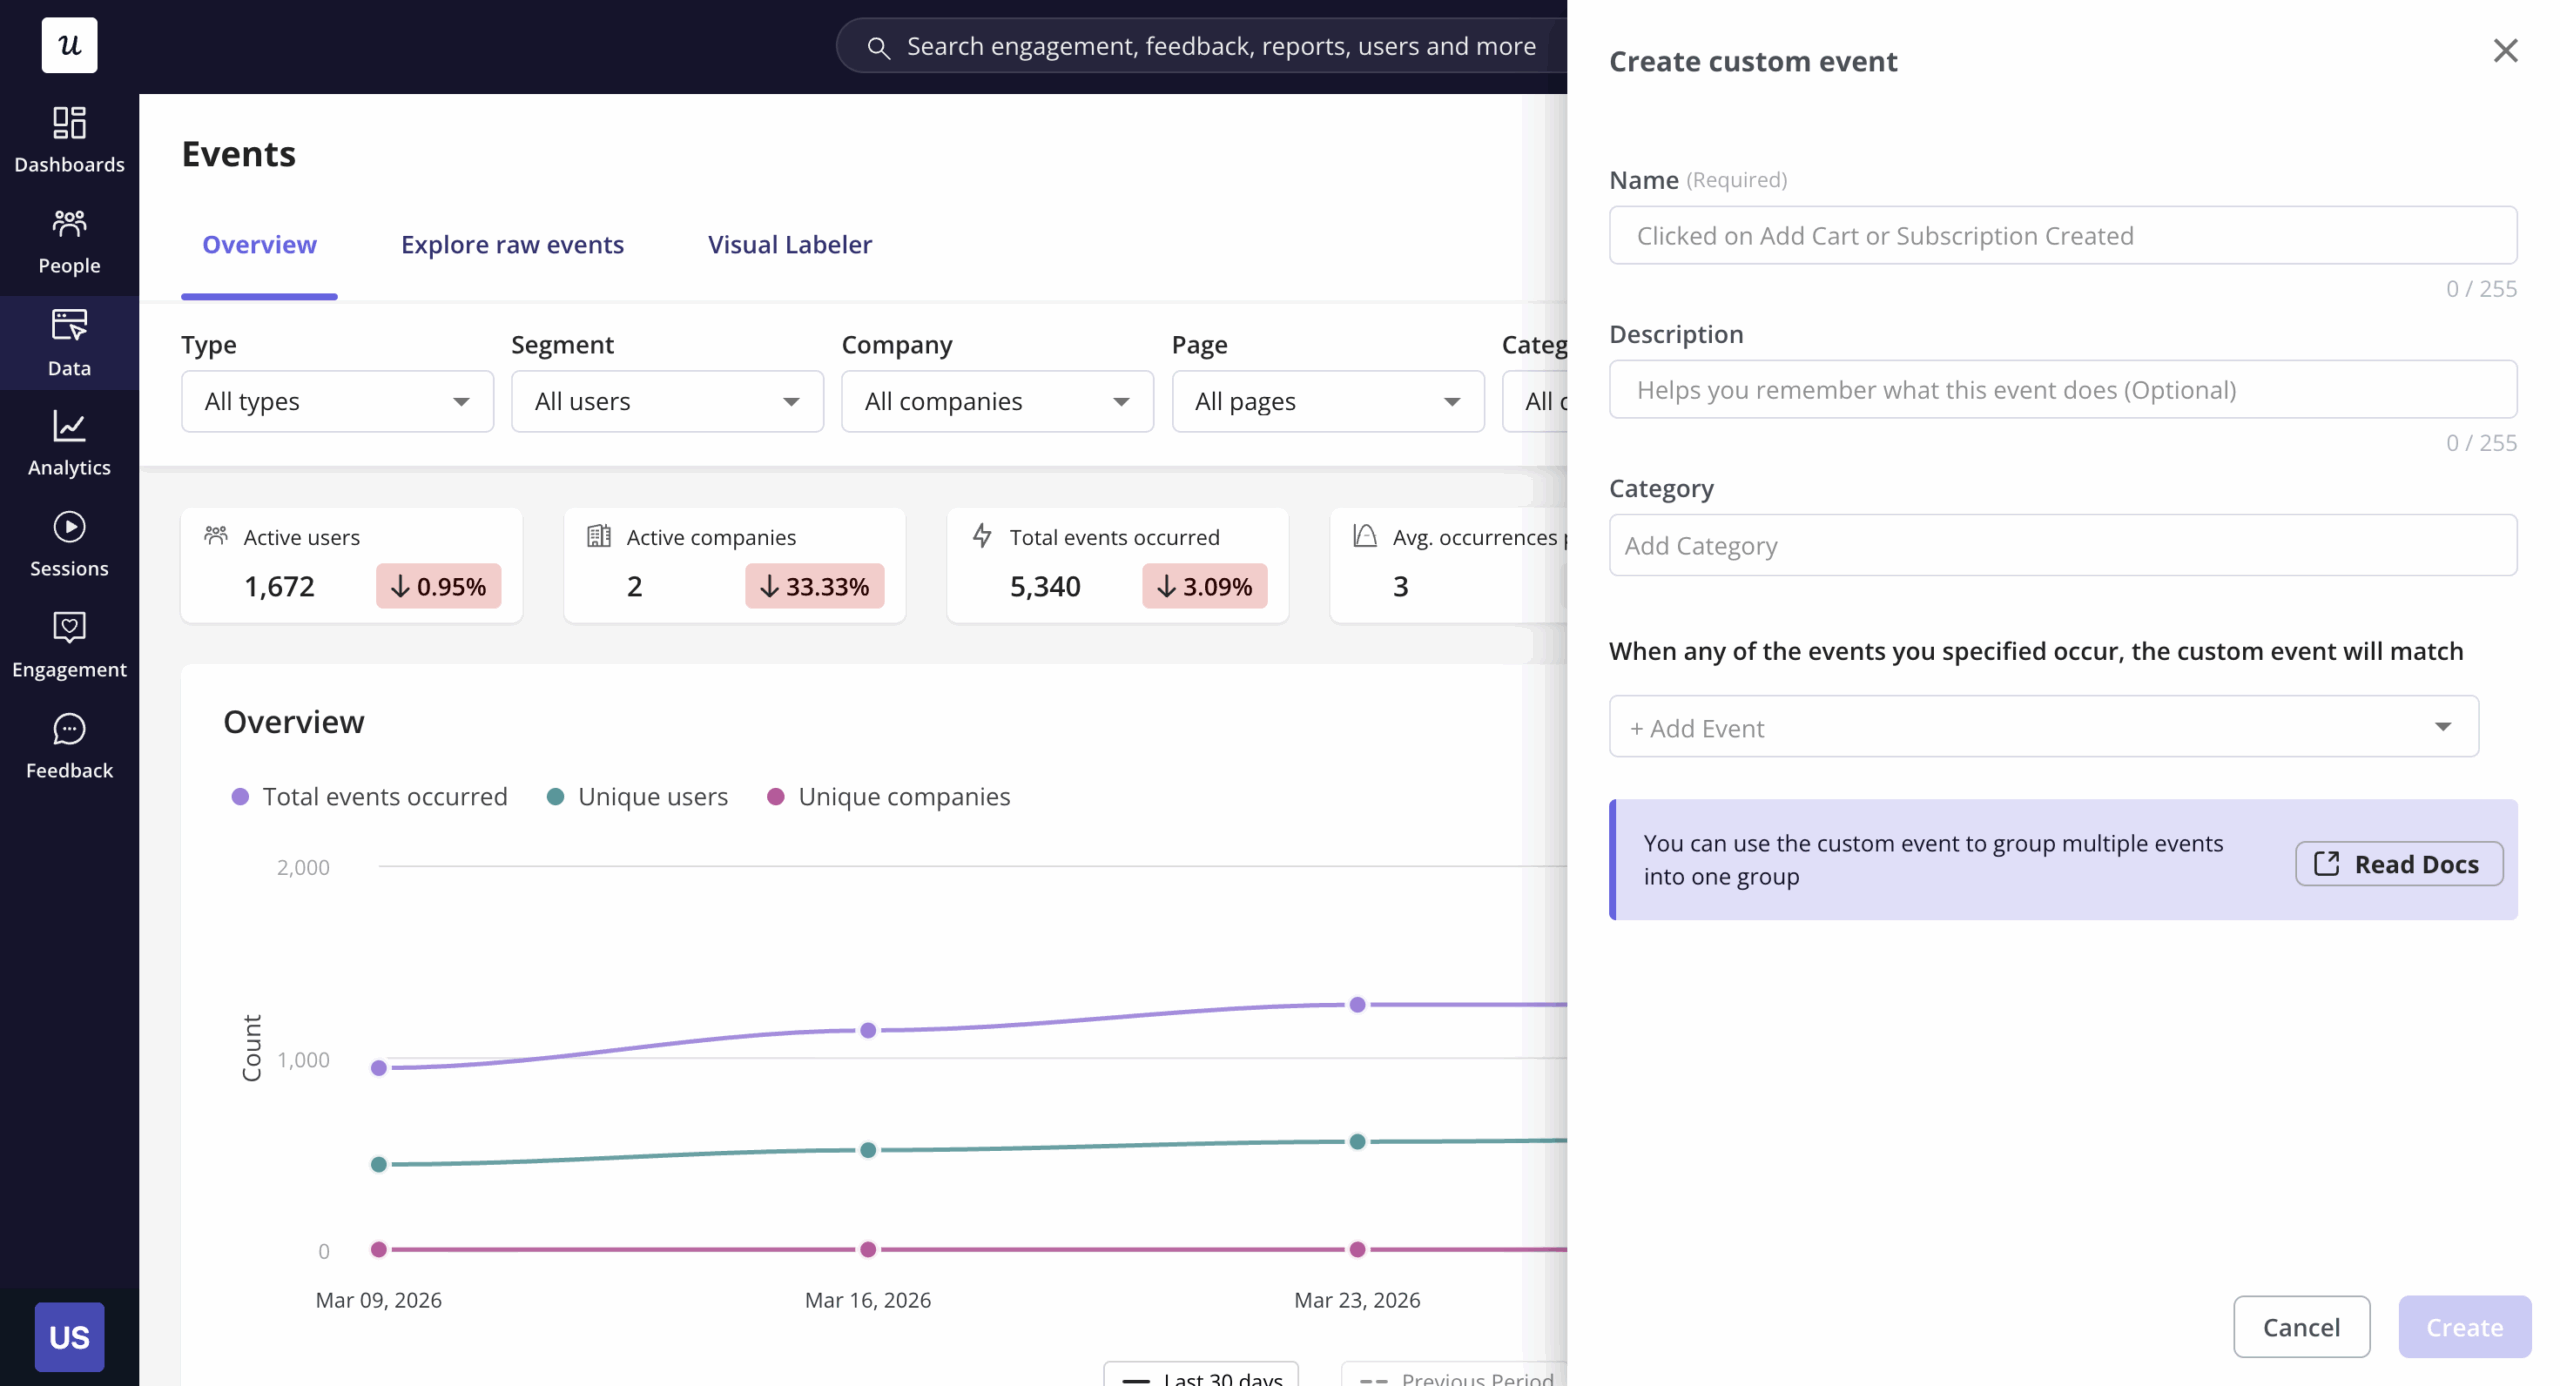
- And if you want to track the completion of a multi-step workflow, say a user finishing your entire onboarding flow, you can group multiple events together into a Custom Event. This gives you one clean signal to work with instead of having to look at several events separately.
You can get any of these done within a short time, even if you have a large app or website.
“90 to 95% of event labeling was done by me in a pretty short time for a pretty large website.” —Fred Haselton, Product Manager at Liv-ex
Step 2: Label and organize your clicks
Once autocapture is on, Userpilot is already collecting raw data in the background.
The next step is turning that raw data into something meaningful. Open the Chrome Extension, navigate to the page with the element you want to track, and click directly on it. Userpilot detects it and you give it a name. That labeled event is now available across your analytics, segments, and flows instantly.
Step 3: Analyze click data with reports and dashboards
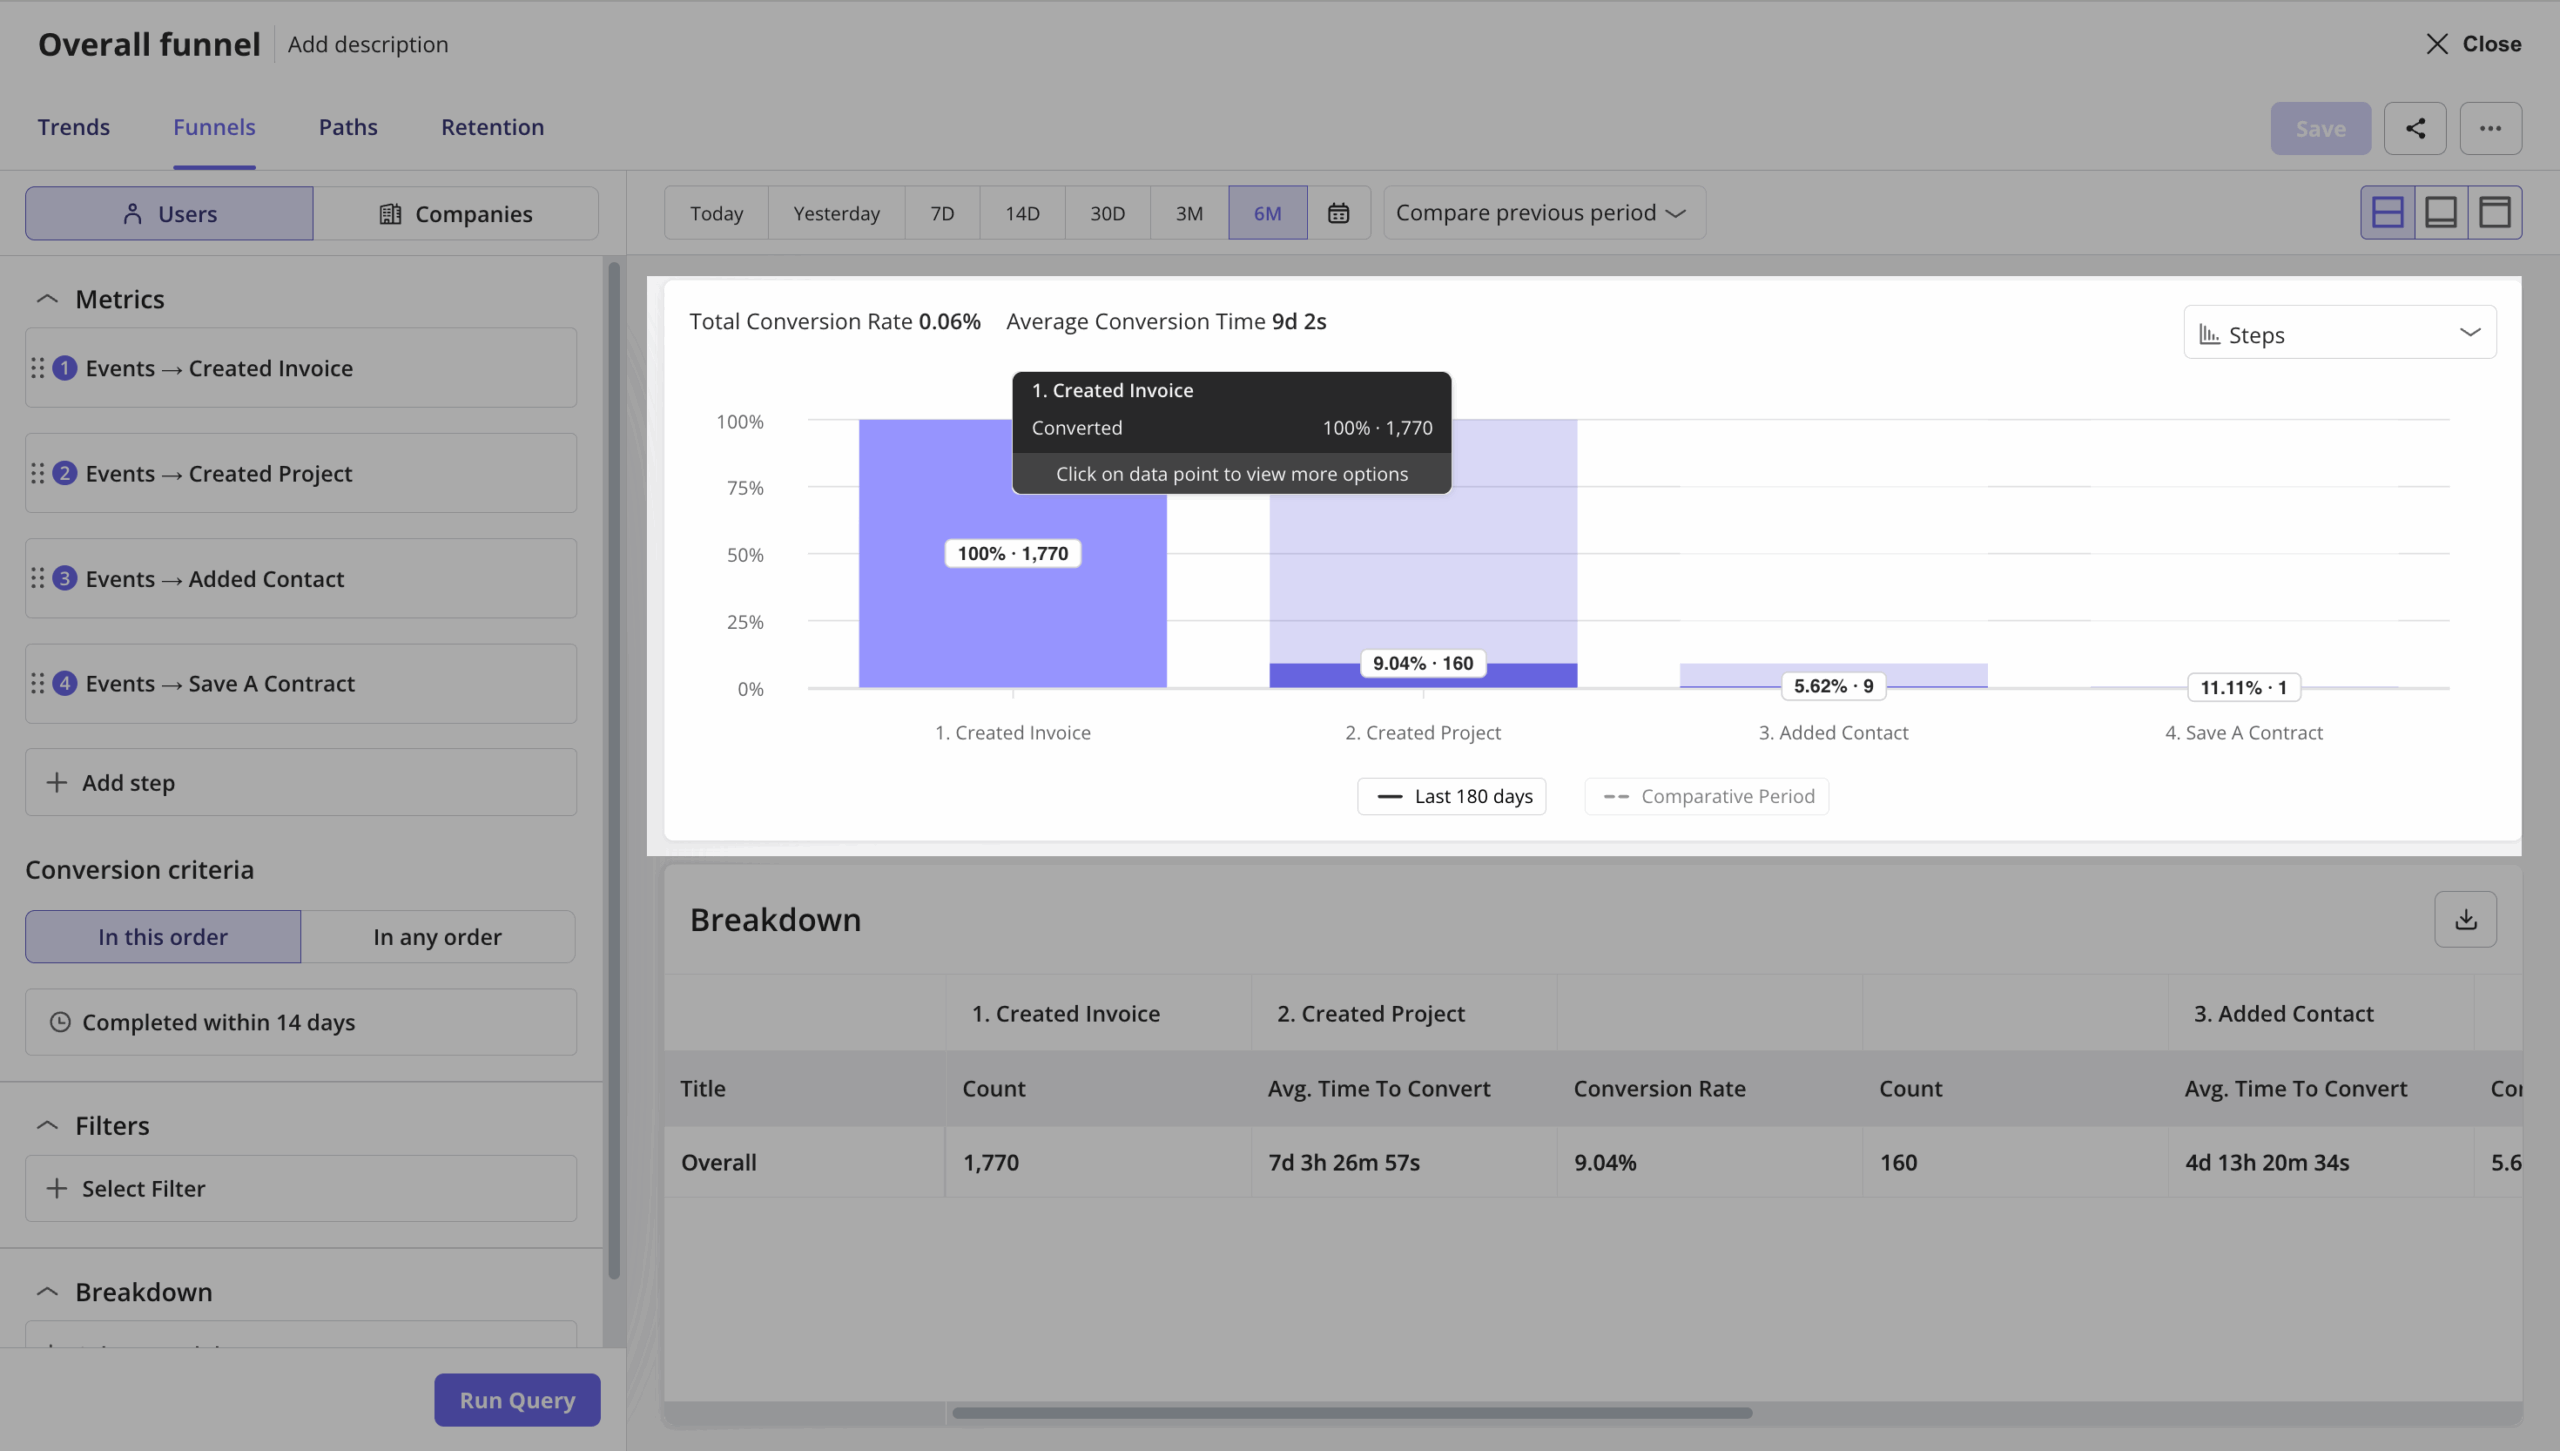
Your events show up in the Events Dashboard, where you can see how often each action is happening and who’s doing it.
From there you can go deeper with Funnels to see where users drop off, Path reports to see what happens before and after a key action, or Trends charts to identify trends and track how behavior shifts over time.
Liv-ex’s case shows how this translates into real product decisions. As a fine wine trading platform, their users rely on search to quickly find and evaluate specific wines. Using path analysis, the team discovered that even highly specific searches were forcing users through an unnecessary results page before reaching the final wine detail page.
That extra step added friction to a core workflow. By removing it and taking users directly to the relevant page, they made it easier for users to get to value faster.
More importantly, insights like this didn’t just fix one flow. They reshaped how the team approached product design altogether.
“Understanding how users move around has led to us ripping up the current designs and creating something brand new.” — Fred Haselton, Product Manager at Liv-ex.
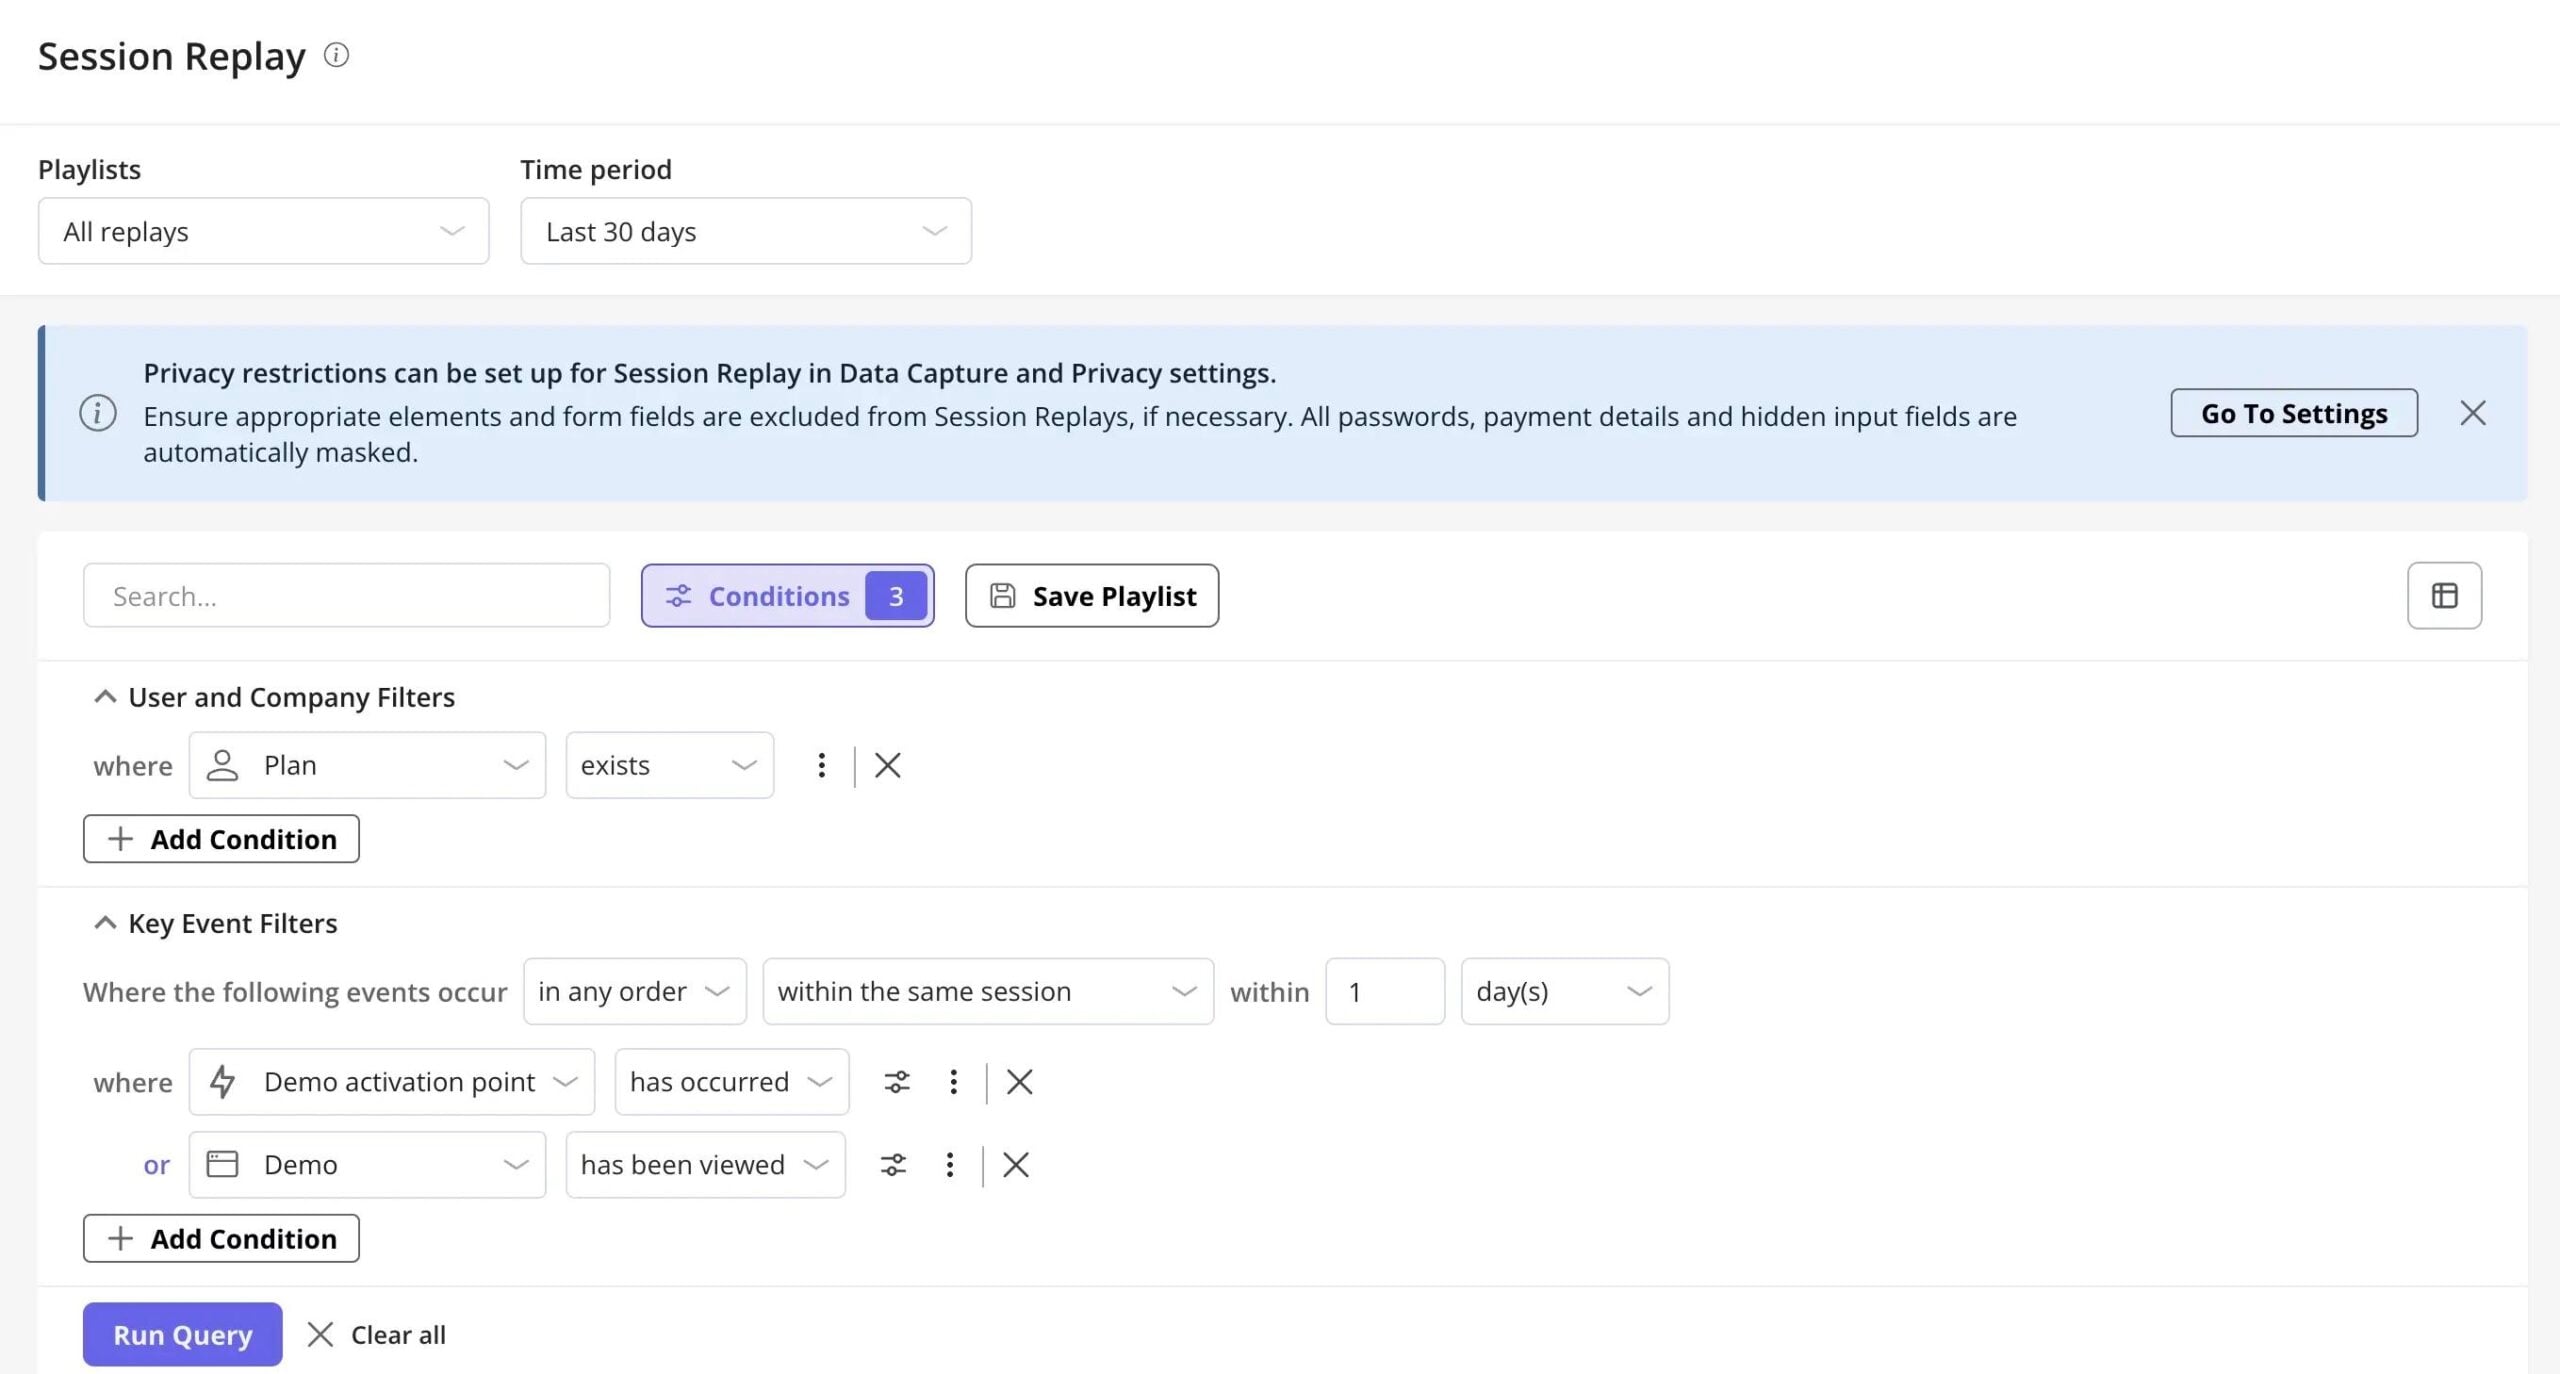
Step 4: Identify rage clicks and bugs with Session Replays
When the data raises a question you can’t answer from charts alone, go to Session Replay. Filter recordings by users who did or didn’t complete a specific action and watch their actual sessions. It’s the quickest way to go from “something looks off” to knowing exactly what to fix.
You can take this a step further by pairing session replays with user feedback. Instead of looking at behavior in isolation, you see both what users did and what they said about it.
For example, when Liv-ex launches new features, their team reviews session replays alongside feedback from users who interacted with those features. This reduces guesswork by helping them understand where users struggled and why.
“We can watch individual sessions of people who left their feedback to understand how they were using the feature, how we could improve, or potentially how we could improve our training to ensure user success.” — Fred Haselton, Product Manager at Liv-ex.
Start tracking clicks to drive better product decisions!
Click tracking is only valuable if it helps you make better decisions. That means going beyond collecting data and focusing on how you structure, analyze, and act on it over time.
Userpilot helps you do all three code-free. And with Lia, our upcoming AI agent, it becomes even faster. Instead of manually digging through dashboards or building reports from scratch, Lia helps you surface insights, understand user behavior patterns, and get instant answers to product questions.
You can join the waitlist to get early access or book a demo to see how Userpilot fits into your workflow.
About the author