Churn Calculation Made Easy: Formulas + Tips for Reducing Churn


What doesn’t get measured doesn’t get managed. That’s why churn calculation is an essential part of every product manager’s job. If you don’t know the rate at which your customers leave, you can’t measure the effectiveness of your retention strategies.
In this article, you will learn how to calculate the customer churn rate and other related churn metrics. You will also find out how to prevent churn in your SaaS.
What is customer churn rate?
Customer churn rate is the percentage of paying customers who cancel or don’t renew their subscription in a given period, normally a month.
A high customer attrition rate is bad news for a product. It indicates that it doesn’t deliver enough value to retain customers or that there are more competitive solutions around.
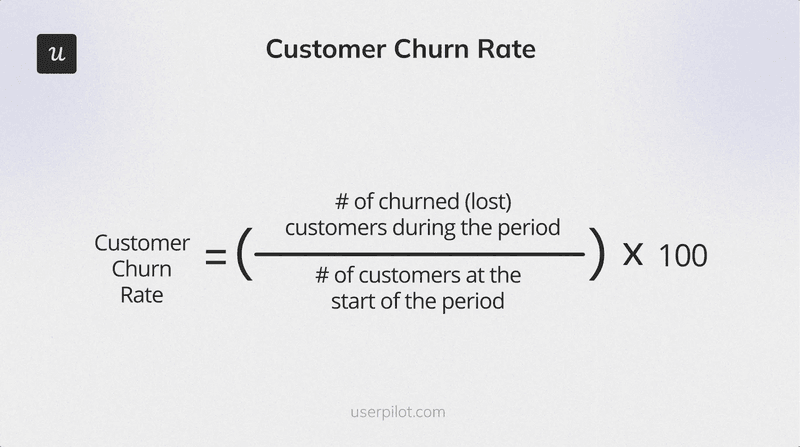
How to calculate customer churn rate?
To calculate the churn rate, divide the number of customers who stop using your product over a period by the number of customers at the beginning of the period. And then multiply the answer by 100.
So, if you had 1,000 customers at the beginning of the month and lost 50, your churn rate would be 5%.
(50/1,000) x 100 = 5%
Additional types of churn rates to monitor
In addition to customer churn rate, there are a few more churn metrics to pay attention to.
Revenue churn rate
The revenue churn rate measures the percentage of monthly recurring revenue (MRR) lost from existing customers over a specific period. The metric gives you insights into the revenue impact of customer churn, not just the number of customers lost.
Revenue churn rate is important for B2B SaaS businesses with tiered and/or usage-based pricing or those that charge per seat. For them, customer and revenue churn don’t mean the same. Losing bigger accounts will have a much higher impact on such organizations than smaller ones.
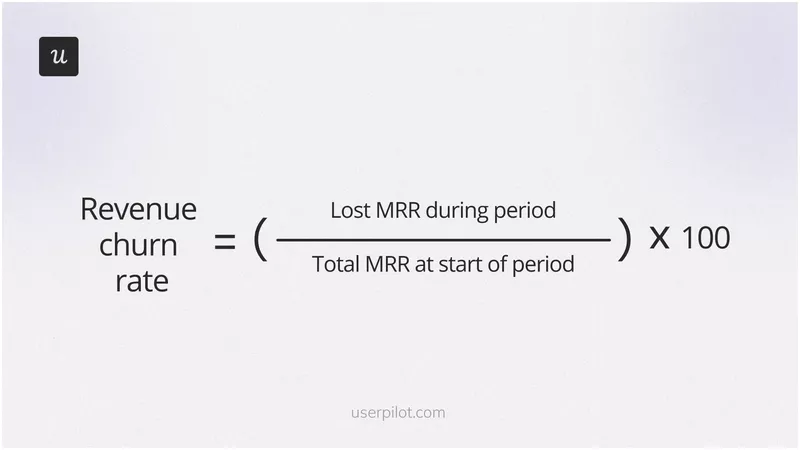
Revenue churn calculation is simple: divide the MRR lost during a period by the total MRR at the start of the period and multiply by 100.
So, if your MRR at the beginning of the month was $1,000,000, and you lost $20,000, your revenue churn rate was 2%.
Gross revenue churn rate
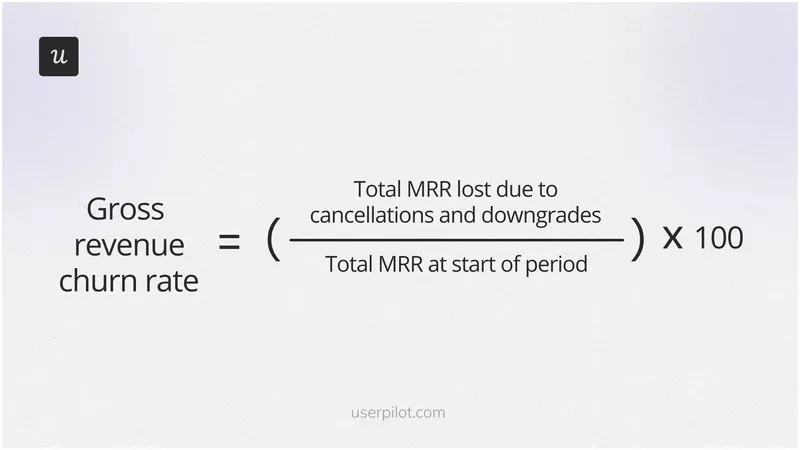
Gross revenue churn rate is the percentage of total MRR lost solely due to cancellations and downgrades and excludes any revenue gained through upsells or cross-sells.
The metric provides a raw view of how much revenue is leaving the company. Tracking it matters if your focus is on preventing income loss through cancellations or downgrades, for example, by tweaking your pricing tiers.
To calculate the gross churn rate, divide the MRR lost as a result of cancellations or downgrades by the total MRR at the beginning of the period.
So, if you started the month with an MRR of $1,000,000 and you lost $5,000, your gross revenue churn rate was 0.5%.
Net revenue churn rate
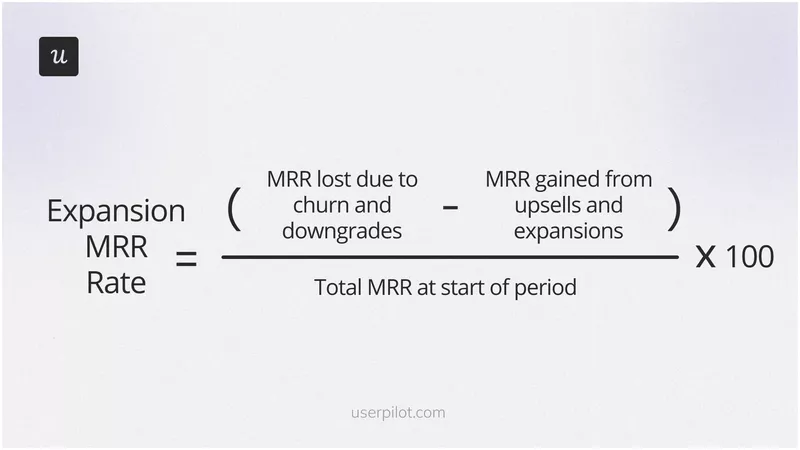
Net revenue churn rate takes into account not only the revenue lost from cancellations and downgrades but also the revenue gained through upsells or cross-sells. This gives a more comprehensive view of revenue retention.
The metric is relevant for companies prioritizing growth through account expansion because it allows them to measure how upsells and cross-sells offset customer churn.
The net revenue churn calculation is a bit more complex:
First, deduct the MRR gained from upsells and cross-sells from the MRR lost because of churn or downgrades. Next, divide it by the total MRR at the beginning of the month and multiply by 100.
Imagine your MRR at the beginning of the month was $1,000,000, you gained $5,000 in MRR through upgrades but lost $20,000 to downgrades. In this case, your net revenue churn is 1.5%.
[(20,000-5,000)/1,000,000] x 100 = 1.5%.
Involuntary churn rate
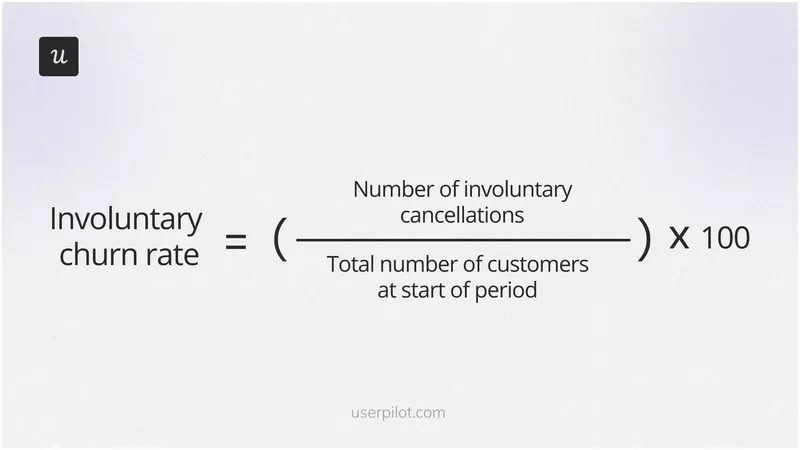
Involuntary churn rate measures the percentage of customers lost for reasons outside their control, like failed payments or account issues.
Tracking involuntary churn rates is essential for all SaaS companies that use automated billing systems. By improving billing practices, you can reduce the number of customers who churn unintentionally.
You calculate the involuntary churn rate by dividing the number of involuntary cancellations by the total number of customers at the beginning of the given period and multiplying by 100.
For example, if you start the month with 2,000 customers and 50 of them churn because of payment issues, the involuntary churn rate is 2.5%.
Seasonal churn rate
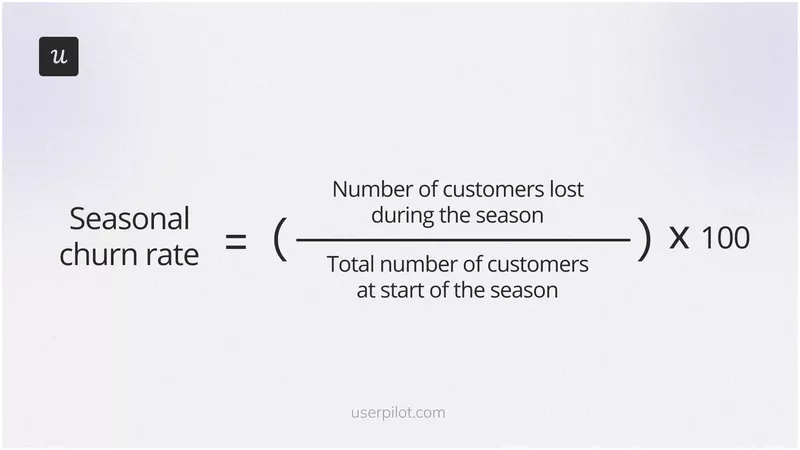
Seasonal churn rate is the measure of customer losses during a particular season or cyclical period.
The metric is relevant for companies offering products that experience seasonal trends, like fitness, education, or dating. It allows businesses to understand how the natural seasonality in their product usage affects churn. This is key to accurate forecasting and budgeting.
You calculate the seasonal churn rate by dividing the number of customers lost during the season by the total number of customers at the beginning of the period.
For instance, if you lose 150 out of 2000 customers during school holidays in June and July, your seasonal churn rate is 7.5%.
What is an acceptable churn rate?
A good annual churn rate is generally considered to be 5%. However, this may not be achievable for startups and SMBs that are still refining their product-market fit. A 10-15% is much more realistic.
What about the monthly churn rate?
Again, large organizations catering to enterprise customers tend to have lower monthly churn rates than small and medium ones (1% vs 3-5%). That’s because they have longer contracts that are more difficult to cancel.
Recurly research suggests that involuntary churn accounted for a quarter of the average churn among software companies (0.8% vs 3.5% in total).
Ultimately, an acceptable churn rate depends on individual factors, like the business’s size, maturity, and target market.
You may find it challenging to search for reliable data specific to your niche, which is why I suggest using your current churn rate as a baseline and then working on improving it.
Why is it important to monitor the churn rate frequently?
Here are three main reasons why monitoring customer churn rates is vital for your SaaS.
Detects issues early on
An increasing churn rate could be an indication that you’re losing your product-market fit or competitive advantage.
For example, your customer needs may have changed, and your product is failing to satisfy them. Or your competitors may have reviewed their pricing, and suddenly, your product will come across as pricey.
Sometimes, usability and technical issues spoil the user experience and their ability to get their jobs done so much that they churn.
Regardless of the nature of the issues, monitoring churn rates regularly allows you to pick them up before they spiral out of control.
That’s how one of our customers, Unolo, realized their customers weren’t entirely satisfied with their product experience. After collecting customer feedback, they implemented measures that increased satisfaction and, consequently, reduced the churn rate by up to 1%.
Improves customer lifetime value
Reducing the churn rate can help you increase the customer lifetime value.
Think about it:
The longer a paying customer stays with your company, the more money they spend. Not just because they keep subscribing for longer but also because they’re more likely to upgrade to higher plans.
Results in better revenue forecasting
By monitoring the churn rate trends, you can predict the future revenue and demand of your business more accurately.
For example, if you’re in a highly seasonal niche, this allows you to budget for lean periods and ensure that you have adequate resources to meet customer needs in the busy periods.
How to reduce churn rate and retain customers?
To finish, let’s look at five ways to reduce customer churn rate in your SaaS.
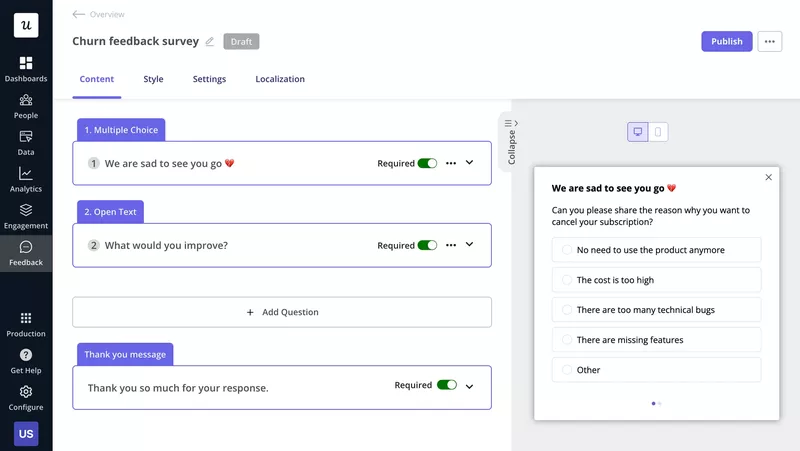
Use churn surveys to collect feedback from lost customers
By embedding churn surveys in the cancellation flow, you can identify the reasons for customers leaving. Such insights can help you improve the customer experience and find ways to add value to your product. And increase customer retention in the long run.
In your survey, ask your customers two questions:
- A closed-ended question about the main reason for cancellation, like high cost or technical issues. This is quick to answer, so make it compulsory.
- An open-ended one which gives the user a chance to explain their reason in more depth. As this takes longer to answer, it should be optional. Otherwise, the number the responses might suffer.
In-app surveys work well for paying customers but not so well for those on free plans. The latter have nothing to cancel, so they can disappear into thin air without any consequences.
How do you get the feedback from them?
Send the survey by email and reach out to a few of the churned customers with an interview invite. Give them a voucher or some other freebie, and they might be willing to help.
Improve the product experience for new and existing customers
What makes excellent product experiences?
They’re frictionless. They allow users to complete their tasks with as little effort as possible.
For prospective customers, this is signing up for the product and experiencing its value during the free trial. For existing ones, getting their jobs done.
You can discover the friction points in the user journey with a product analytics tool like Userpilot. And to enhance mobile product experiences, Userpilot now helps you onboard and engage mobile app users by creating personalized messaging, push notifications, and surveys.
Start by segmenting users based on their use cases and conduct funnel analysis for each segment to identify the bottlenecks where they drop off or slow down considerably.
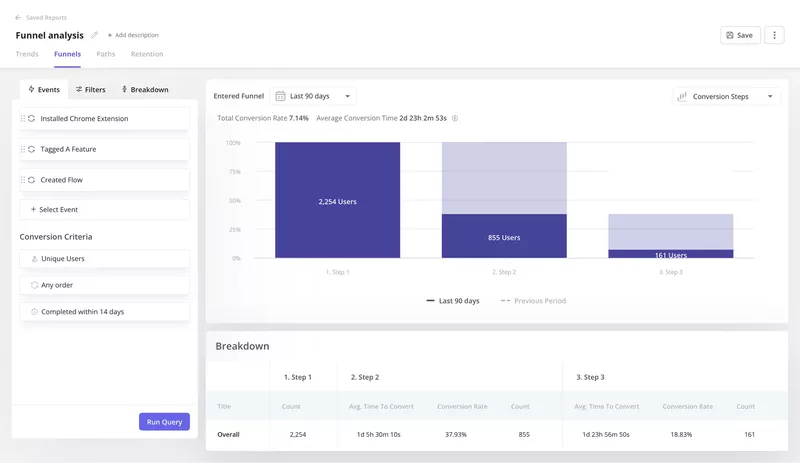
Once you know where the friction is, use path analysis to map out all the actions leading to churn. Compare them to the paths of the successful users. Can you see any significant difference between the two groups?
Keep digging. Use session recordings to zero in on specific actions. Look for frustration signals like rage-clicking, which can shed light on users’ usability issues.
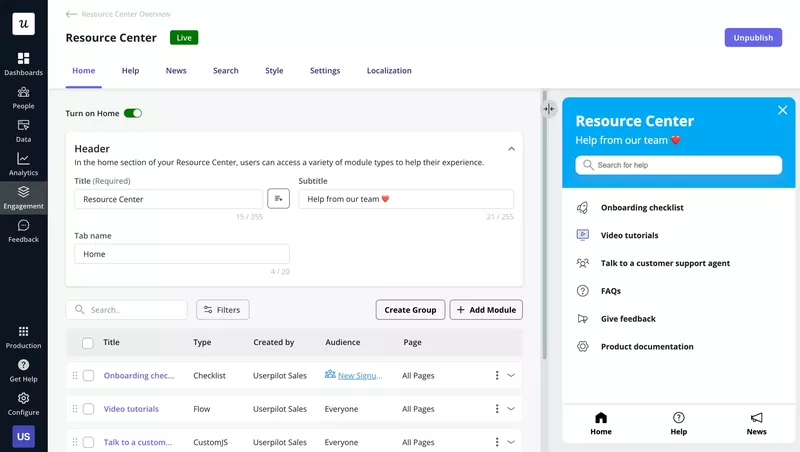
Provide proactive customer support via a resource center
If you know what kind of issues users face, address them proactively by providing self-service support materials.
A resource center with product documentation, how-to guides, video tutorials, and a chatbot enables users to solve their problems independently without waiting for customer support agents to respond, which may take hours and is plenty to disrupt a user’s working day.
Don’t get me wrong: such resources won’t solve all problems. Sometimes, contacting support is the only way to tackle more complex issues. However, the support agent will be able to help them in less time if they try out common solutions first.
Improve product value by adding new features
Adding new features is an obvious way to enhance product value.
Obvious doesn’t mean easy, though.
Building new features takes time and effort, so you need to make sure that they truly benefit your users – not waste your resources.
Here’s how to reduce the risk:
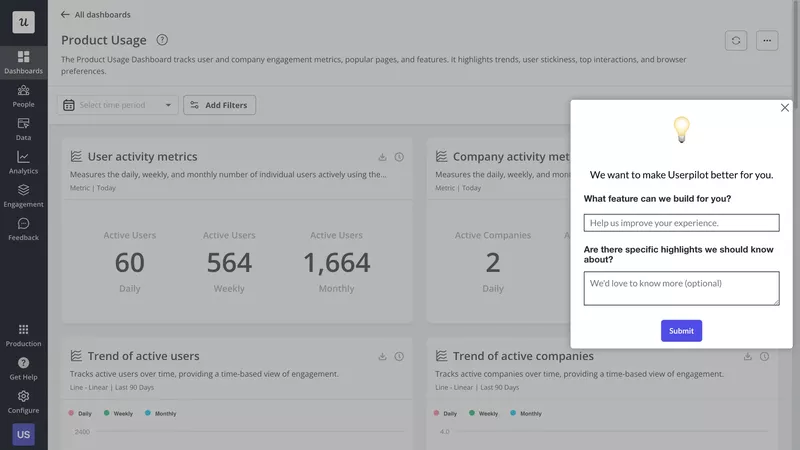
- Collect feature requests via in-app widgets and analyze competitor offerings. Focus on features you don’t have.
- Identify what problems the features solve.
- Conduct customer research to validate the problems. Is there enough demand for a solution? Can the customers pay for it?
- Ideate. Look for original solutions to the problems. Don’t copy blindly features from other products.
- Validate the solution ideas through experimentation and prototype testing. For example, fake door tests.
- Build the solution in small increments and test it iteratively.
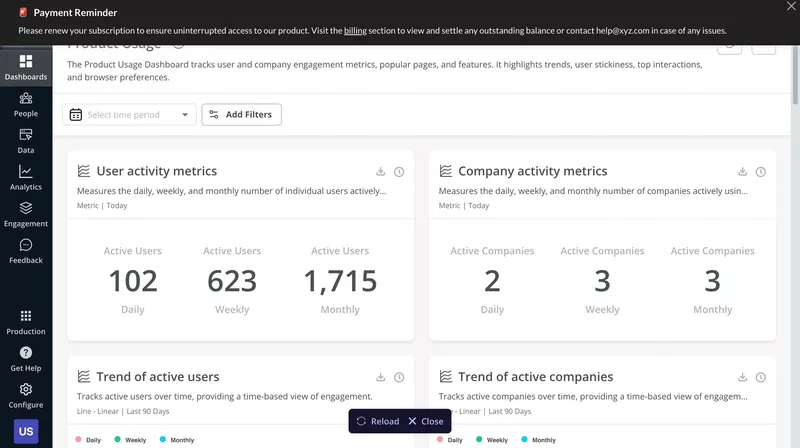
Trigger automated payment reminders to reduce involuntary churn
To prevent involuntary churn, use automated in-app messages to remind users about upcoming payments or advise them about payment issues.
Here’s an example of such a banner created in Userpilot.
Thanks to our audience and triggering settings, you can send such reminders to the right users at the right time.
For example, you can send them a message that their credit card expires in a week, and then every time they log into the product, they see the banner until they update their details.
In-app messages allow you to reach active users when they’re interacting with the product, which reduces the risk of missing reminders.
However, in B2B SaaS, users aren’t always responsible for payments. So, back up all in-app reminders with email ones. Most CRMs, like HubSpot or Salesforce, give you such an option.
Conclusion
Churn calculation allows you to track the effectiveness of your retention and account expansion efforts.
However, to improve your customer retention rates and drive growth, you need more in-depth and diverse data, like product usage or customer feedback.
If you’d like to learn how Userpilot can help you collect the data and use the insights to create in-app experiences that will reduce customer churn, book the demo!
About the author