Conversion Funnel Analysis: How to Analyze and Optimize it with AI Agents


Conversion funnel analysis has one job: show you exactly where prospects and leads give up before they become paying customers.
For most of this decade, tracking funnels was a task you did manually: you’d pull up a dashboard, squint at a drop-off, and determine an appropriate fix. In 2026, that process can be simplified to a great extent with an AI agent that can do the pulling, most of the squinting, and a fair chunk of the guessing.
The pressure behind that shift is simple: products ship faster, funnels multiply, and conversion funnel analysis stops being a once-a-quarter project the moment you have more flows than people to watch them.
The funnel itself hasn’t changed, though.
In this article, we’ll explore how you can speed up the funnel analysis process using AI agents and turn it into an ongoing process instead of a once-in-a-quarter tactic.

What conversion funnel analysis actually shows you
A conversion funnel is the ordered set of steps a user takes on the way to a goal: sign up, activate, upgrade, whatever counts as “converted” for your product. Funnel analysis measures the drop-off between each step, helping you discover the one or two steps losing you the most people. Everything else, the awareness stage, the interest stage, the desire stage, is just labeling for a path that narrows every time someone gives up.
Most funnels follow the same pattern: 60-80% of total drop-off concentrates in one or two “leaky” steps. The drop-offs may not be evenly spread across the whole flow, too. Free trial conversion typically lands around 3-9% for freemium products and 10-20% for stronger, more targeted trials. Finding the leaky step and fixing it can help resolve most of the problems.
Here’s how we used it:
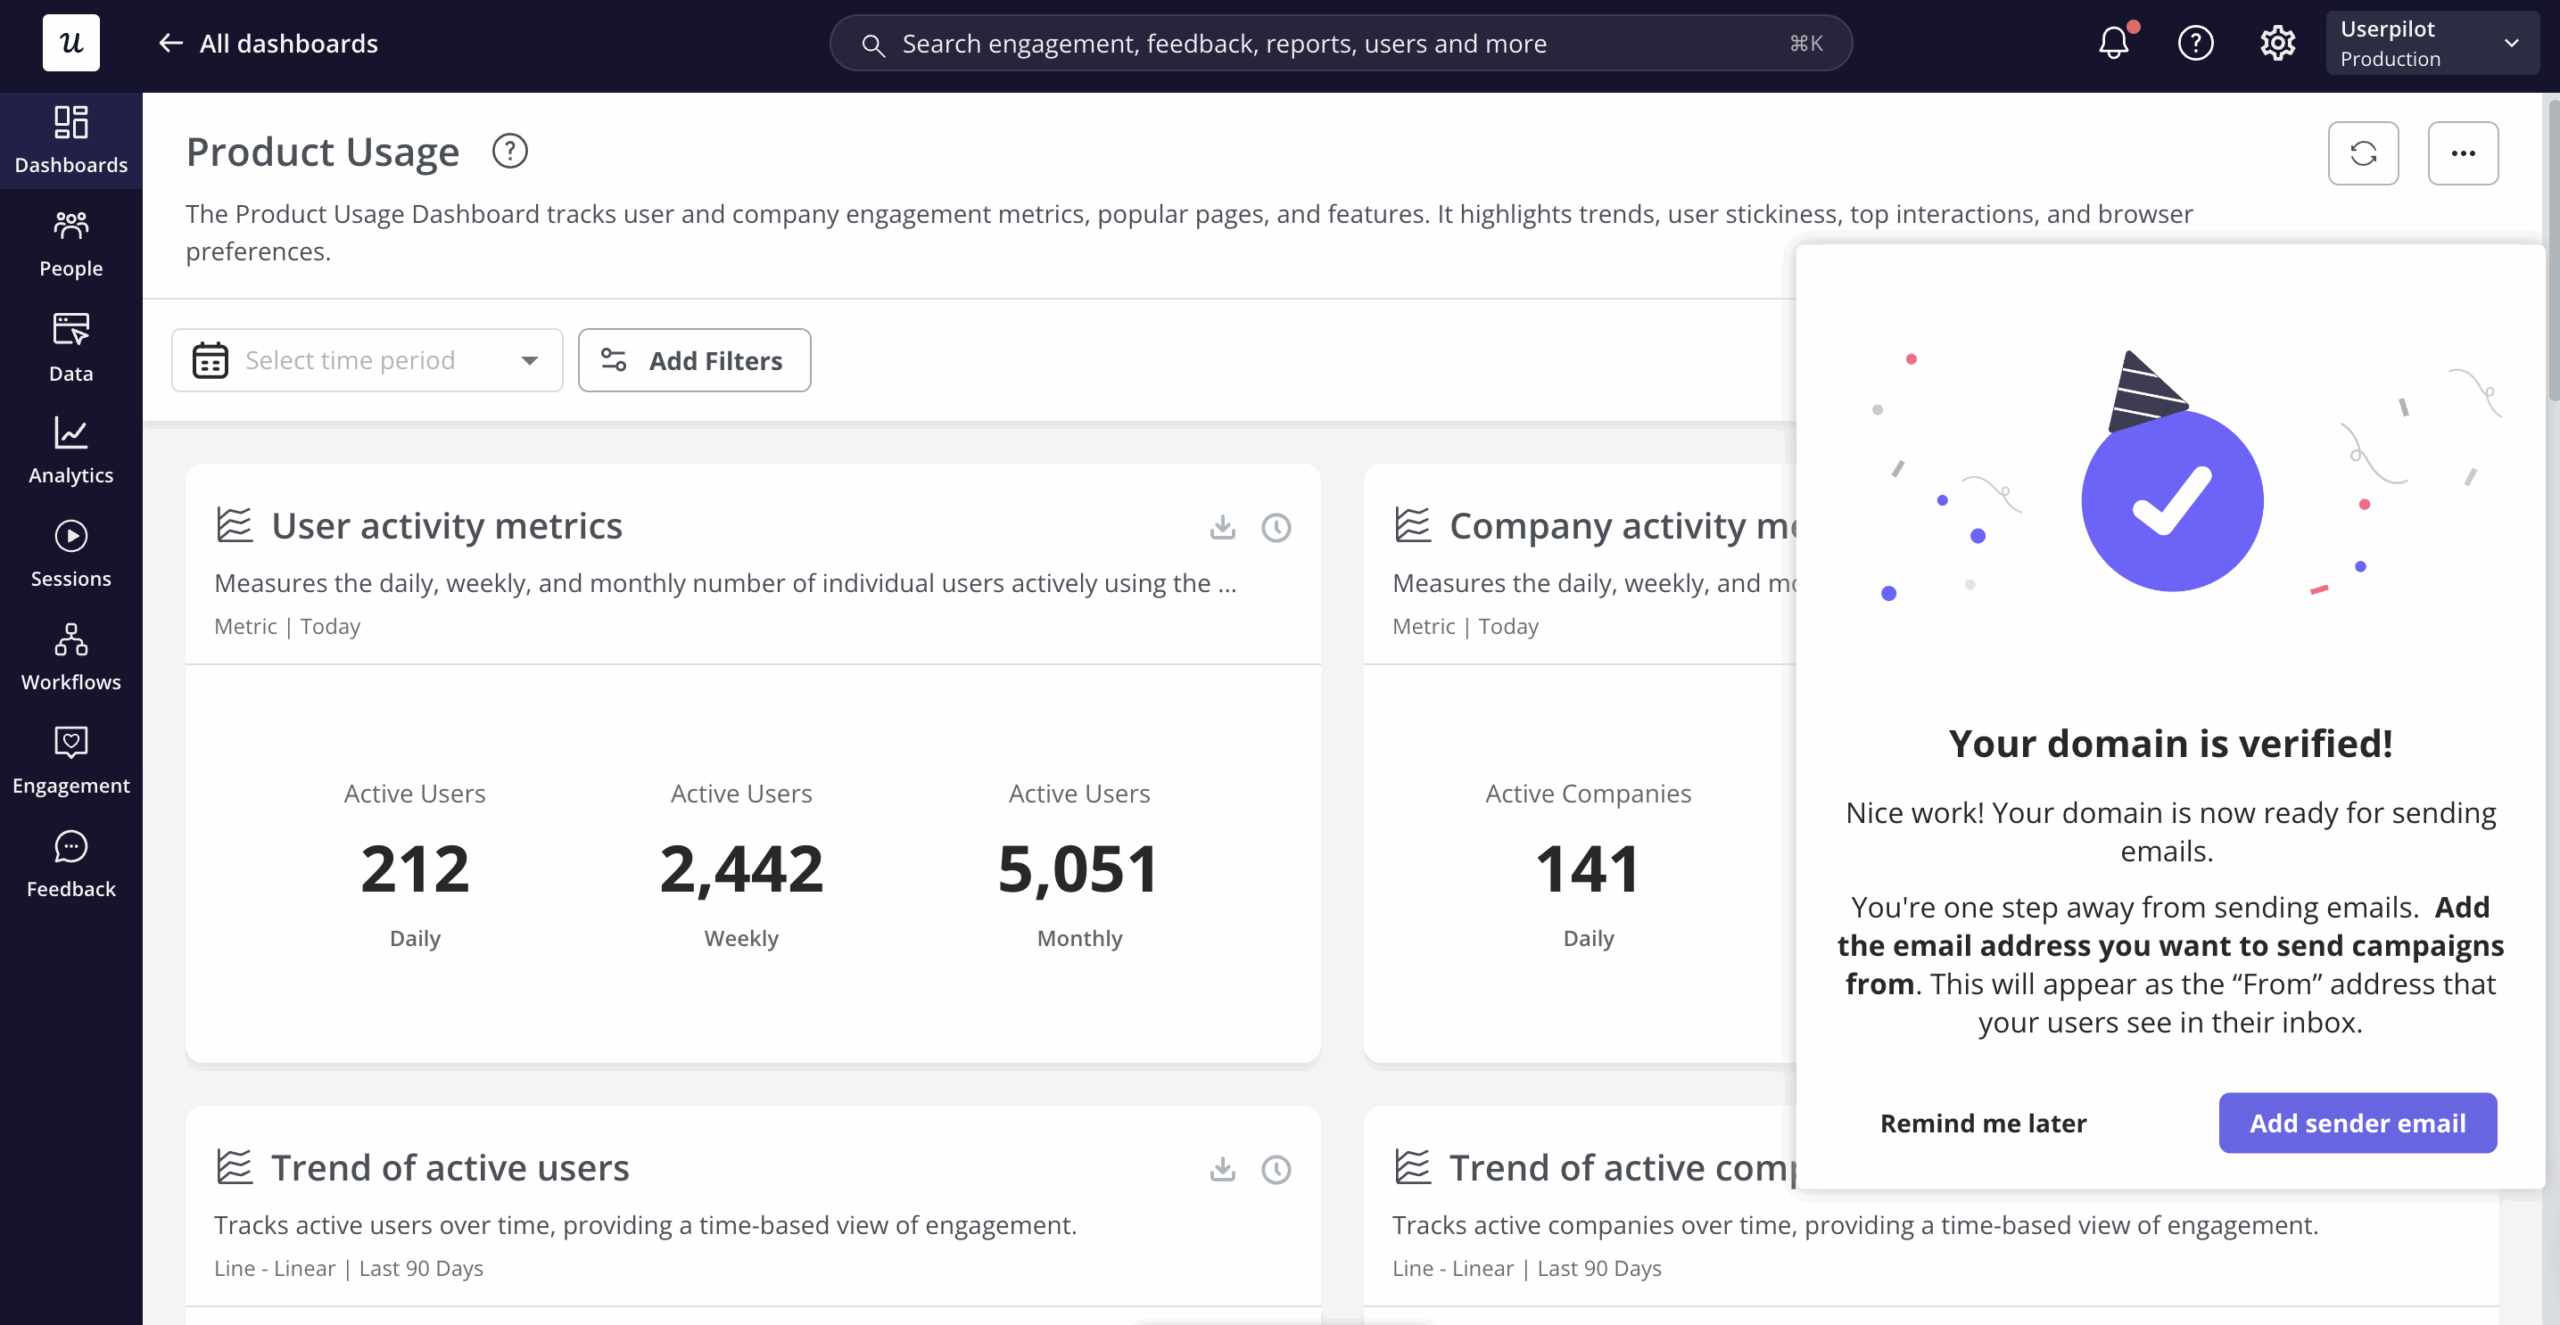
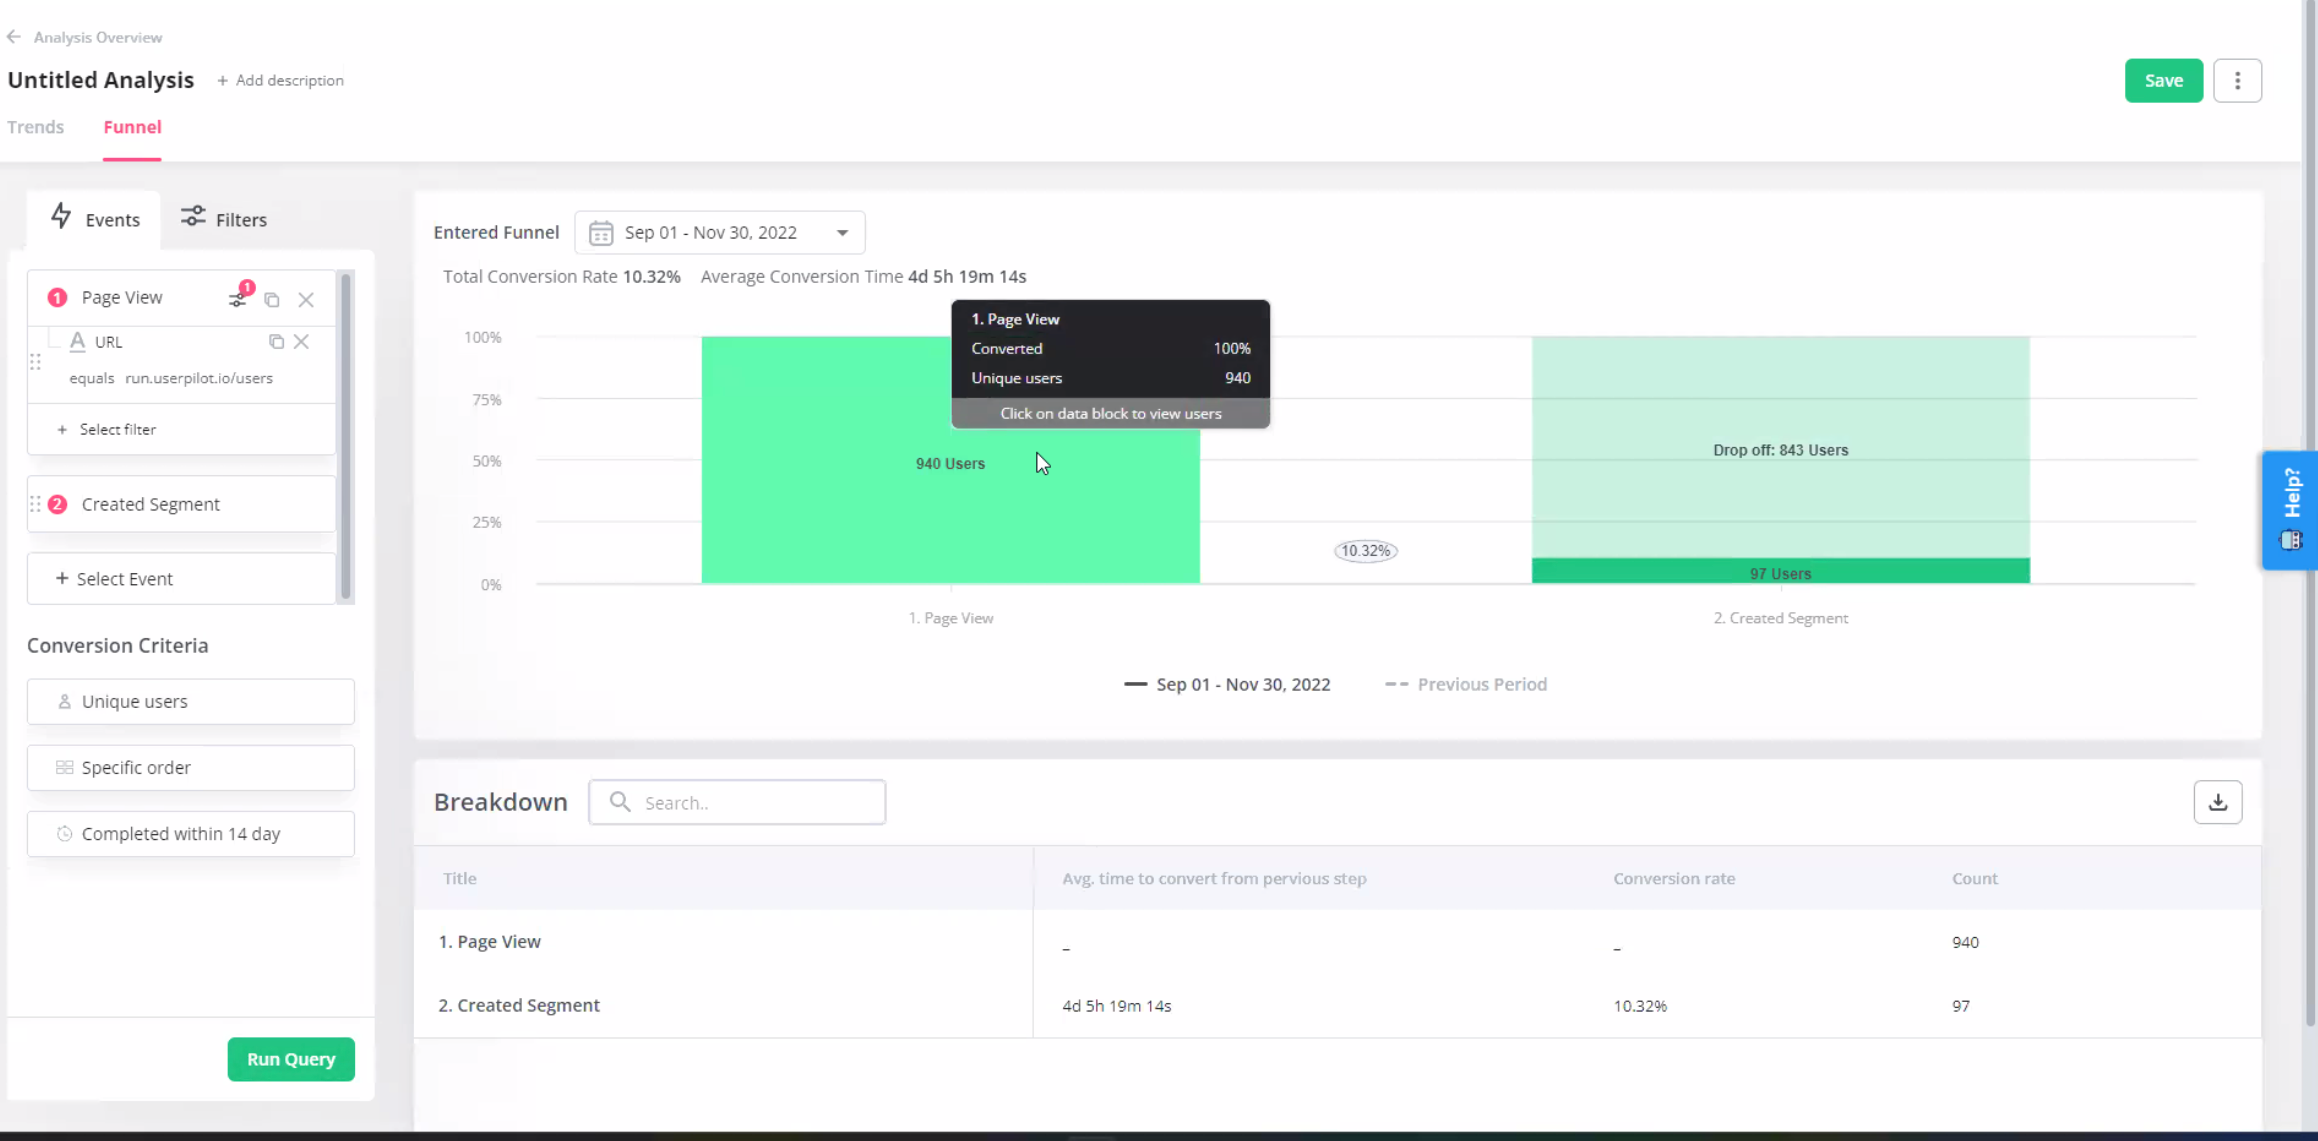
When Userpilot shipped its email feature, the funnel showed a sharp drop-off right at domain verification, the exact step most teams would call the activation point for that flow. A few years earlier, that drop would have meant a ticket, a sprint, and a multi-week wait for engineering. But now, it was different:
“Within a few hours, I just created a targeting tooltip and showed it to users and highlighted the correct steps for them to make it clear what to do next. That helped a lot on reducing friction and supporting users in real time without involving our dev team.”
The drop-off closed within days, no engineering ticket required. That’s the whole point of funnel metrics: they don’t just tell you conversion went down, they tell you which specific step to go fix.
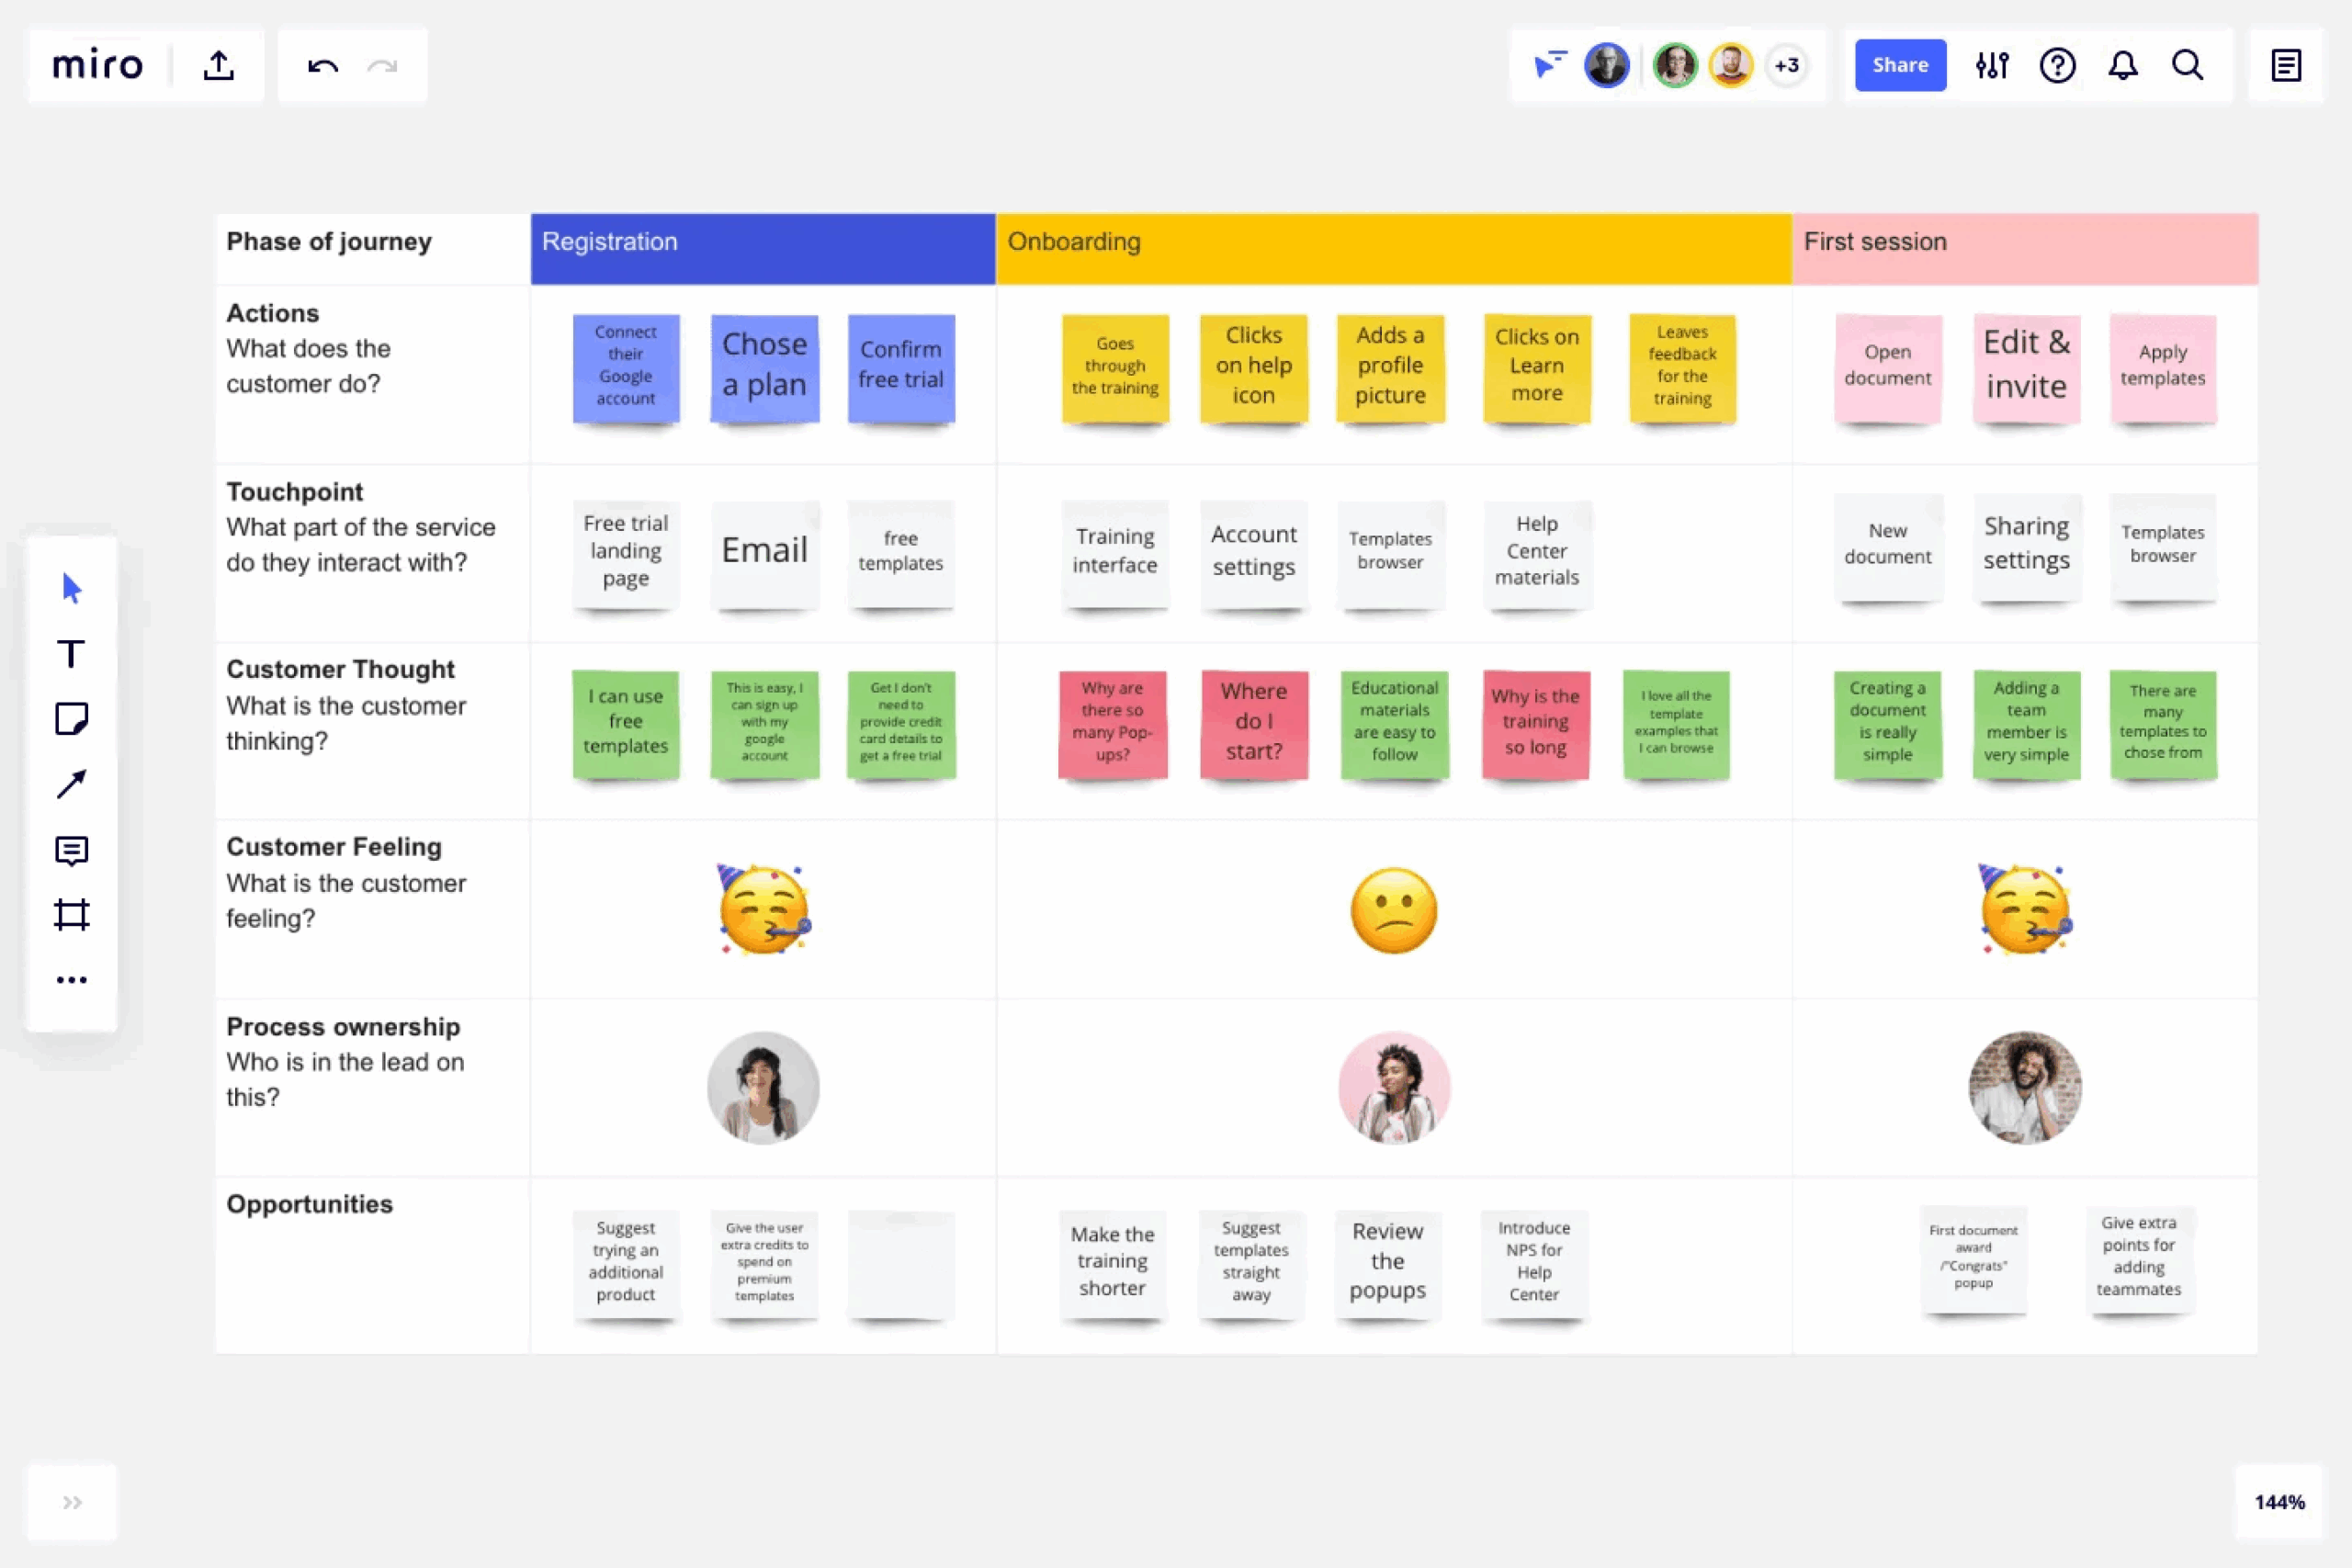
If you want the fuller picture before narrowing it into a funnel, a customer journey map is the wider version of the same idea. It plots every touchpoint a user has with your product, not just the ones that lead to conversion. Using both together can help in driving conversions.
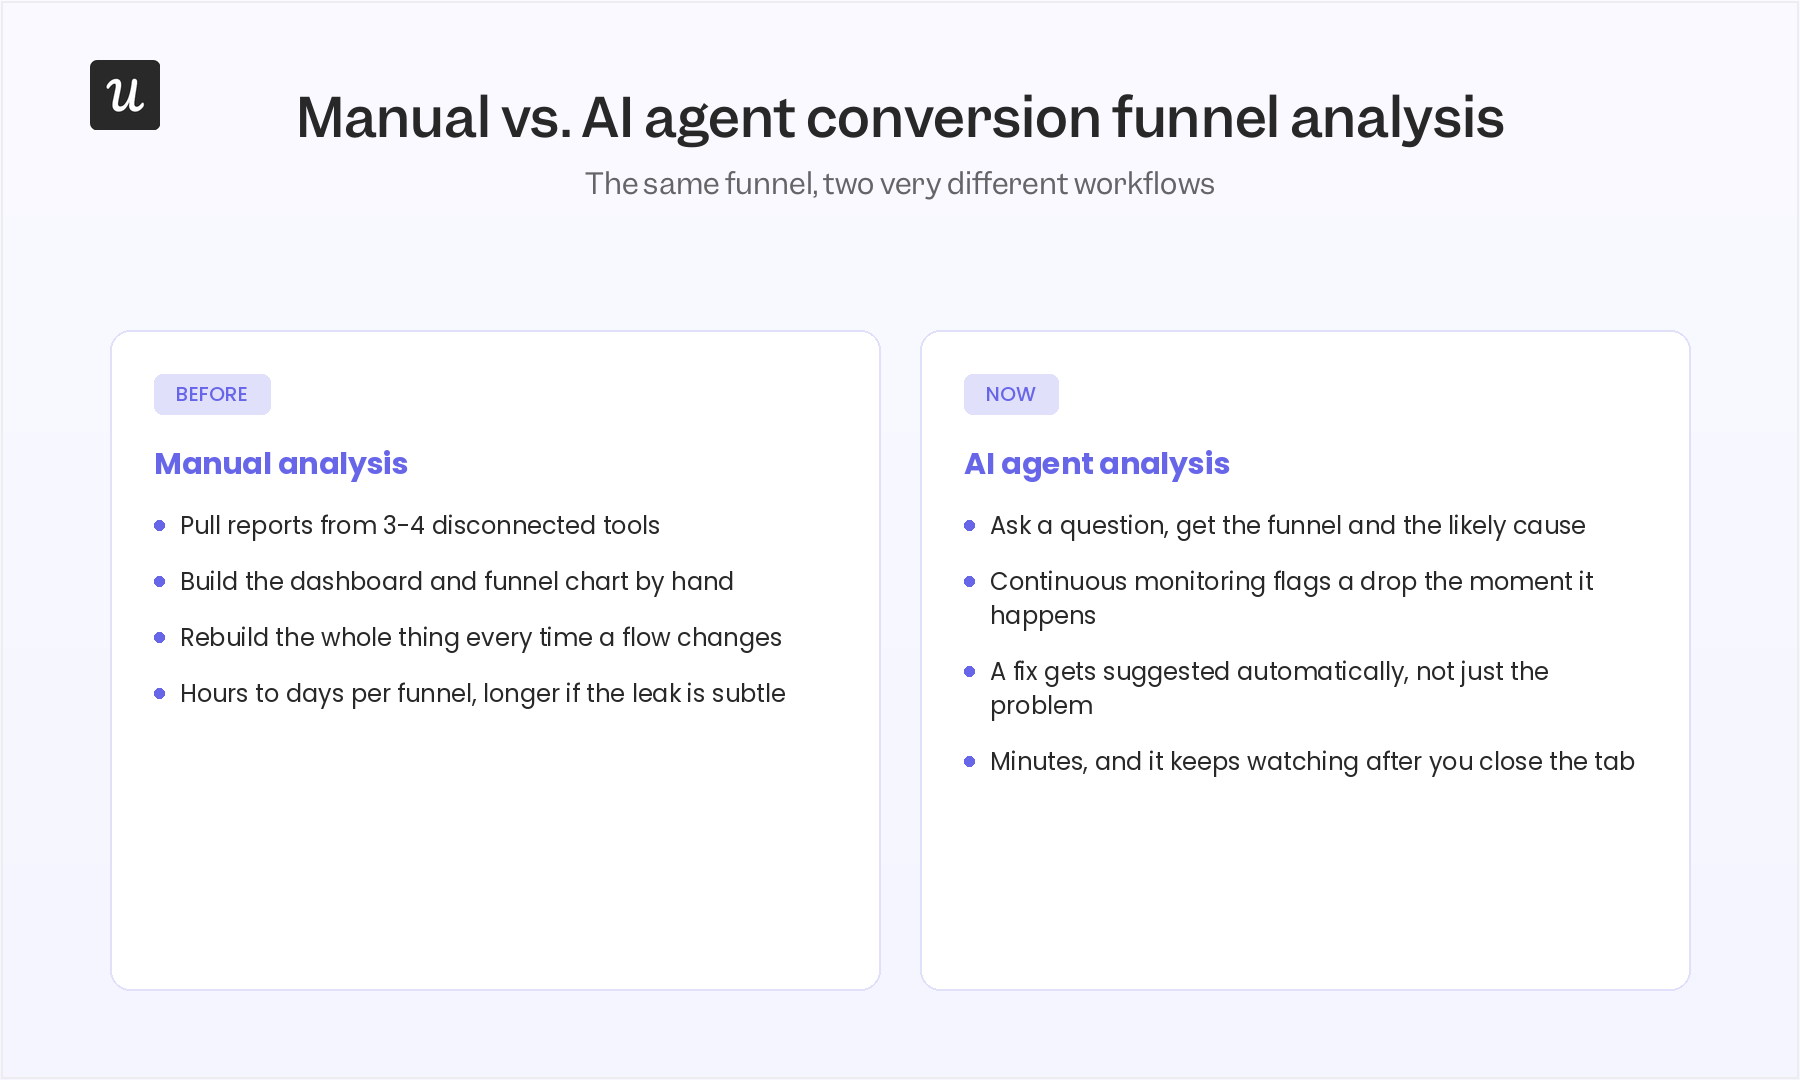
The manual method ate entire days
Conversion funnel analysis has been around for a long time and plays a critical role in helping you improve conversions, but the process itself was quite time-consuming. Doing a proper conversion funnel analysis meant a CRO specialist pulling reports from three or four tools, stitching them into one dashboard, and building the actual funnel by hand.
Every new flow meant repeating the whole process from scratch. Essentially, finding friction points was a project.
Here’s a breakdown of the manual process:
- Pulling data from scattered tools: An analytics dashboard, a session replay tool, and a spreadsheet for whatever neither one tracked, none of it living in the same place.
- Cleaning it before you could even look at it: Deduping users, aligning event names across tools, throwing out the test accounts that skewed every chart.
- Finding the actual leaky step: A funnel chart tells you a step is losing people, but not why. So, someone still had to watch session replays one at a time to spot the exact micro-interaction causing it.
- Visualizing a multi-step funnel properly: Most tools handle three or four steps cleanly and turn into a mess past that, which pushed teams toward oversimplified funnels that hid real drop-off.
- Staying objective about what the data actually shows: After two days spent building a funnel by hand, it’s tempting to go looking for the fix you already assumed was there instead of the one the numbers are pointing to.
And funnels don’t stay fixed once you’ve mapped them. New features ship, user behavior shifts, and a funnel that made sense in January can be misleading by March, which means someone has to keep rebuilding the same report on a loop just to stay current.
And even if a tool could pull it all together, you’d still have a significant amount of heavy lifting to do.
Whenever the flow changed, you’d have to go through the process all over again.
How AI agents like Lia automate conversion funnel analysis
This is where 2026 actually looks different.
Lia, Userpilot’s AI agent, answers funnel questions the same way you’d ask a colleague: “why did signups drop last week” or “where are trial users getting stuck.” You get the report and the likely cause in one pass, not a dashboard you still have to interpret. The best part about agents is that you don’t need a CRO to fetch the reports. Any team member can ask natural language queries and get instant responses from Lia.
What makes AI agents like Lia even better is the fact that they don’t clock out.
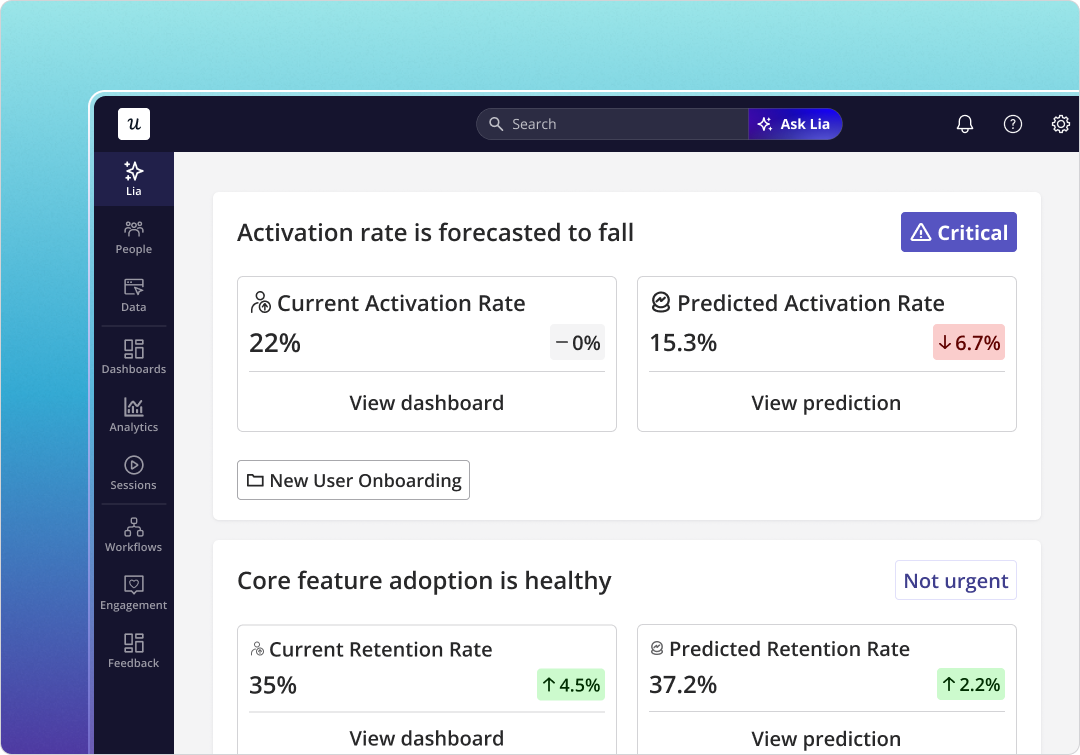
It watches every funnel continuously, flags a drop-off the moment it crosses a threshold, and keeps going without anyone opening Userpilot to check. The manual process simply couldn’t achieve this level of continuous tracking.
The manual method involved brainstorming fixes. But with AI agents like Lia, that changes as well.
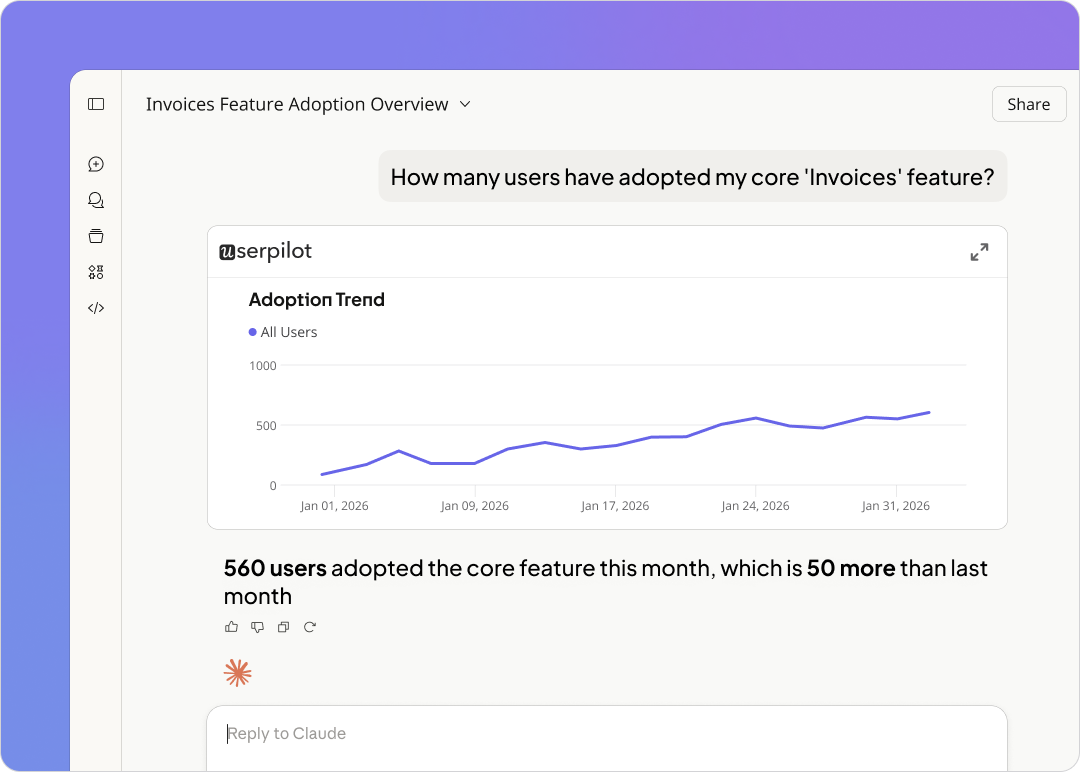
Beyond flagging, Lia suggests the fix. It instantly provides multiple options that you can deploy to fix the funnel leaks. These recommendations serve as great starting points.
This is also where event data stops being something you configure once and forget. Every custom event you track feeds the agent’s view of the funnel, so the tracking work you already do gets more valuable instead of sitting in a dashboard nobody opens.
What changes the process even more is Userpilot’s MCP Server. It lets any AI tool you already use, such as Claude or ChatGPT, query your product usage, session replay, and survey data directly, so you can run a conversion funnel analysis without opening Userpilot at all. This speeds up the process further and makes insights more accessible.
Yazan Sehwail, Userpilot’s CEO, described the shift this way:
“If you as a marketer wanted to see, using session replay, NPS data, survey data, and product usage data, you’re able to get your answer without having to go to Userpilot, without having to pull data and upload it to someone. So this is why MCP is gonna be a game changer.”
In a nutshell, AI agents automate large parts of the conversion funnel analysis process, making it easier to gain insights and deploy fixes. They also make these insights available to non-technical users.
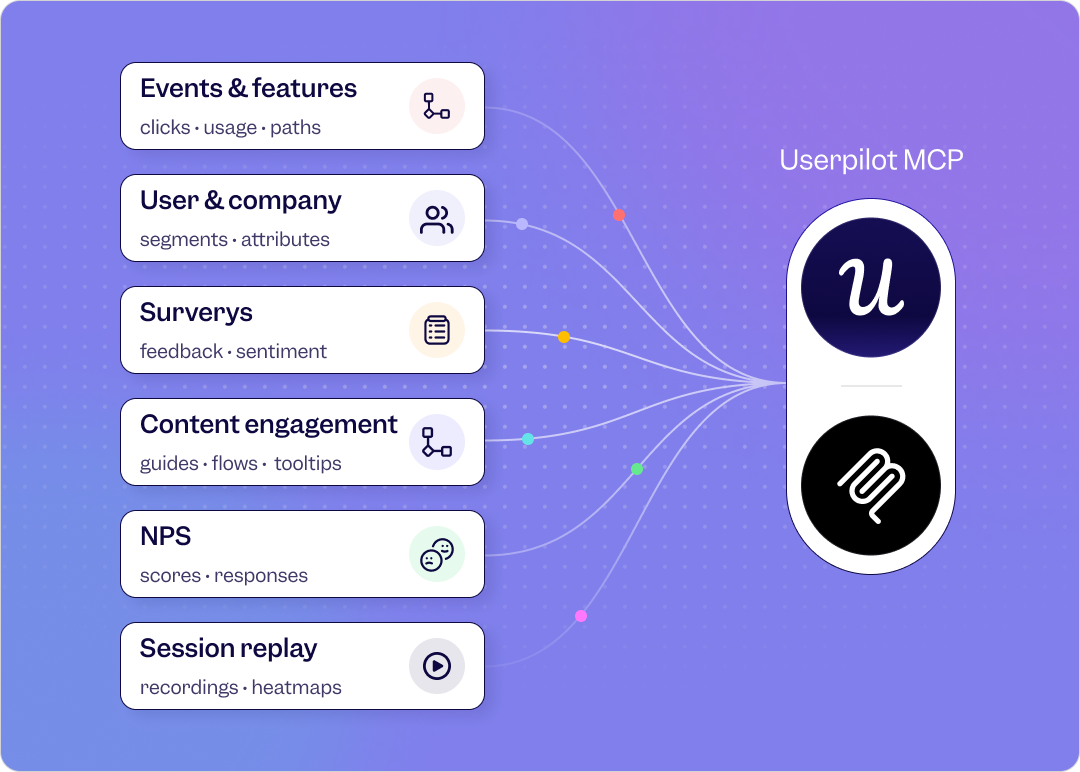
Userpilot’s MCP Server, connecting product usage data to whatever AI tool you’re already working in.
Stack all of that together and a few concrete benefits show up fast:
- Hours turn into a question: What used to take a CRO specialist half a day to assemble now takes one prompt and a few seconds of processing.
- Analysts get their time back: Instead of touching every routine funnel question, the team only steps in for the handful of calls that actually need human judgment.
- Small fixes compound: An agent watching daily instead of quarterly catches a leaky step in week one instead of the next audit, and those early catches add up over a year.
- Recommendations are grounded, not guessed: Every suggestion comes from the same usage data everyone else can see, not a hunch from whoever happened to check the dashboard last.
Why AI-powered conversion funnel analysis is a necessity now
The most obvious payoff from AI-powered conversion funnel analysis is UX. When Lia flags a drop-off, it’s almost always pointing at the same handful of culprits: a confusing form, an error message that doesn’t explain itself, or a step that just takes too long. Fixing those improves customer experience without anyone needing a full redesign.
It also changes what gets prioritized. Instead of investigating a funnel because it feels urgent, you can see the exact step losing the most people in raw numbers and start there, so the next sprint targets the drop-off actually costing conversions instead of the loudest complaint in Slack.
Messaging is the piece teams underrate most. It’s not always a bug or feature error. Sometimes, the messaging could be confusing.
“Once we release a feature, we need to create a report and track meaningful events to see the usage and the feature health. From there, I look for where the drop-off is happening, in which step users are getting stuck. Sometimes it’s not engineering. Sometimes it’s just the in-app messaging.”
Continuous monitoring also surfaces the opposite problem: a segment or channel converting unusually well that nobody went looking for. Those hidden wins are often worth more than fixing the leak everyone already knew about, because they point at something worth doubling down on instead of just patching.
AI-powered analysis also makes segmentation cheap enough to do by default. Instead of waiting on an analyst to slice a funnel by behavior, you can just ask which segment is dropping off and get an answer in the same conversation.
None of this replaces judgment. It just means the judgment happens on better information and faster, which is the actual reason retention and conversion move together instead of trading off against each other.
Start analyzing your conversion funnel
With AI agents like Lia, conversion funnel analysis has become faster, because the watching, the diagnosing, and a good chunk of the fixing now happen in the background instead of on your to-do list. It’s also become more accessible as natural language queries help uncover insights without needing a CRO to pull up multiple reports.
Want to see how this works practically? Start a free Userpilot trial and see how Lia works to help speed up conversion funnel analysis.
FAQ
What's a good conversion rate for a SaaS funnel?
It depends entirely on which step you’re measuring. Self-serve signup typically converts at 10-15%, per the benchmark data cited above, while enterprise sales-led motions run much lower. The rates are much higher for free trials that require credit cards at 25-35%.
What counts as a good trial-to-paid conversion rate?
Free trial conversion typically lands around 3-9% for freemium products and 10-20% for stronger, targeted trials. If you want to move that number, figure out what’s actually causing trial users to drop rather than guessing at a redesign.
How is AI-powered conversion funnel analysis different from the manual version?
The steps for funnel analysis are the same: define the funnel, measure the drop-off, diagnose the cause, and ship a fix. What changes is who does steps two and three. Instead of a person with a spreadsheet, you have an AI agent that comes up with insights quickly, more frequently, and continuously instead of once a quarter.
About the author