Conversion Funnel Analysis: How To Analyze & Optimize It?


Trying to conduct a conversion funnel analysis to find out why your sales conversion rates are still not up to the mark? You’ve come to the right place!
Conversion funnel analysis tracks a customer’s journey from the initial point of contact to the final conversion point. It is an essential process to get the necessary insights for conversion rate optimization and your SaaS product growth.
In this article, we will look into the ins and outs of the conversion funnel and how to analyze and optimize it.
What is a conversion funnel?
A conversion funnel (also known as the sales funnel) represents the journey that users take from the initial awareness of a product or service to the ultimate desired action of converting into a paying customer.
What is a conversion funnel analysis?
Conversion funnel analysis examines the specific steps that potential customers take within a conversion funnel. It can help you identify where your potential customers convert and where they drop off.
Conversion funnel analysis example
Suppose your SaaS company launched a new marketing campaign for a product line. In the first week, 100 users signed up for a free trial. Then 60 reached the activation point, and the remaining 40 dropped off. Later on, only 18 of the 60 users chose the premium plan.
Based on the data from this example, we can see:
- 100 users took the free trial.
- 60% of the 100 users reached the activation point.
- Of the 60 users, only 30% subscribed to the premium plan.
For every 100 free trial users, you will have approximately 18 paying customers or an 18% trial-to-paid conversion rate.
What are the benefits of conversion funnel analysis?
Conversion funnel analysis can help you drive more revenue and growth by improving the customer experience and conversion rate.
Track user behavior and identify drop-off points
One of the key benefits of conversion funnel analysis is you can easily track user behavior and identify drop-off points. It helps you get a crucial advantage in understanding the customer journey and identifying areas for improvement.
You can gain valuable insights into how customers interact with your product by tracking user behavior at each conversion funnel stage. It includes understanding customers’ product usage, actions, and drop-off points in the conversion funnel. Armed with this data, you can begin to identify friction points and the reasons behind them.
Improve funnel metrics and optimize conversion rate
So what is your conversion funnel analysis telling you? To have a better understanding, you can track funnel metrics, like trial-to-paid conversion rate, etc., to identify the underperforming funnel stages and the issues. After identifying them through conversion funnel analysis, it is easier to start working on them.
Suppose you’ve noticed many users dropping off at the checkout stage. You may then streamline the process to make purchase completion easier and improve your sales conversion rate.
An improved conversion funnel helps customers easily move through each stage of the funnel until they convert into paying customers. It also begins the process of retaining the customers longer with a long customer lifetime value. This conversion funnel optimization can help you secure more repeat customers, which is critical for SaaS companies.
Sync marketing and product efforts
Conversion funnel analysis can help you align your product and marketing efforts to bring better results. You can determine the effectiveness of your marketing efforts by analyzing the conversion and marketing funnel. It can help you determine effective marketing strategies and continue them to optimize the MQL to SQL conversion.
The product teams can also work to create a more seamless user experience by understanding the areas for improvement in the funnels. Therefore, conversion funnel analysis can create a positive feedback loop where marketing efforts and product development work together to drive growth and increase revenue.
How to conduct a conversion funnel analysis?
Let’s see how you can conduct a conversion funnel analysis in detail.
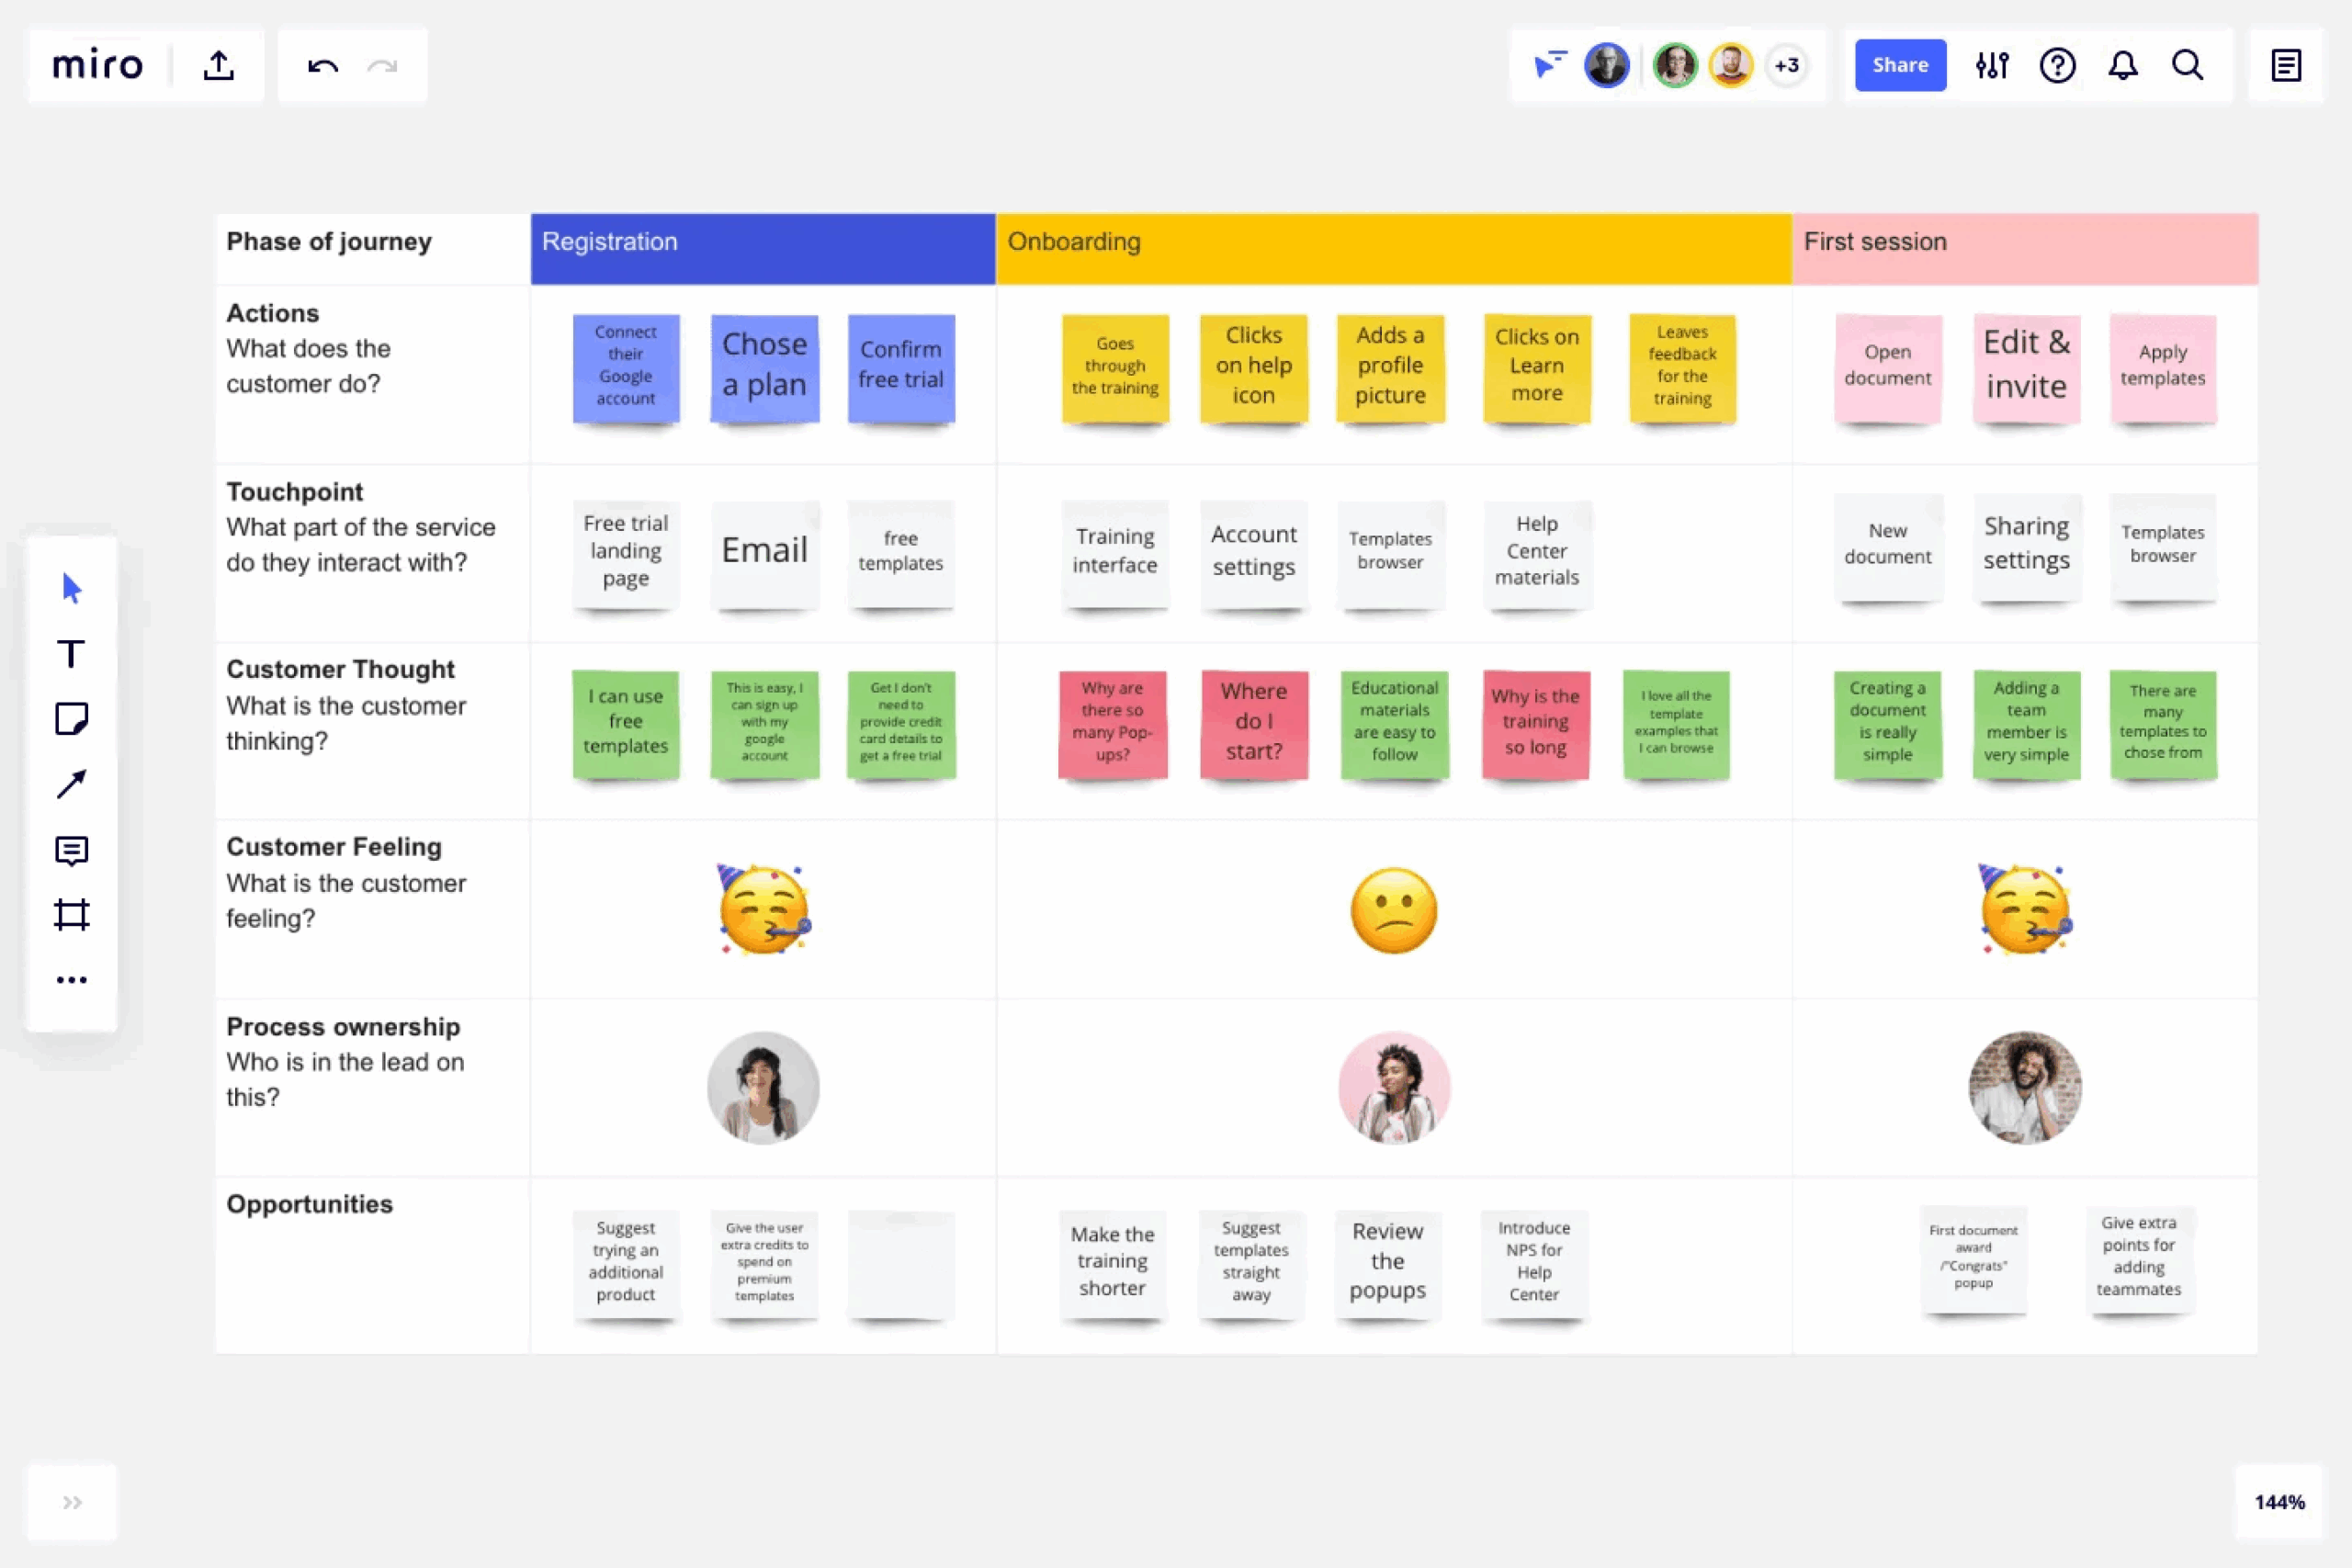
Define the customer journey and map out touchpoints
It is critical that you define the customer journey with all touchpoints to track them effectively for a successful conversion funnel analysis. The customer journey map typically includes several stages: awareness, consideration, decision, and retention. Each stage has specific touchpoints that customers interact with.
You should create a customer journey map to see how customers move through the conversion funnel stages, how often they reach the AHA! moment, and what touchpoints they encounter.
Understanding the customer journey and touchpoints can help you identify which stages and touchpoints need improvement to optimize your conversion funnel.
Set up conversion events and track the customer experience
Setting up and tracking macro and micro conversion events can help you gain insights into how customers progress. But it’s also important to consider that different funnel stages may require different conversion events based on your target audience and their level of engagement.
After tracking the customer interaction, you will better understand who completes the goals (like subscription purchases) and who drops off. The drop-offs are important hints for possible friction points in your customer journey.
So once you have identified the customers dropping off, you should dig deeper into the data to find possible friction points. Friction points can give you valuable information on what improvement customers need in your product and customer experience to perform your desired actions.
You can use a product growth tool to set custom events without coding to track important funnel stages.
Use session recordings to understand why customers drop off
Session recordings are video recordings of a user’s session on your app or product. By watching these recordings, you can see exactly how customers interact with your product, where they encounter problems, and how they navigate through the funnel.
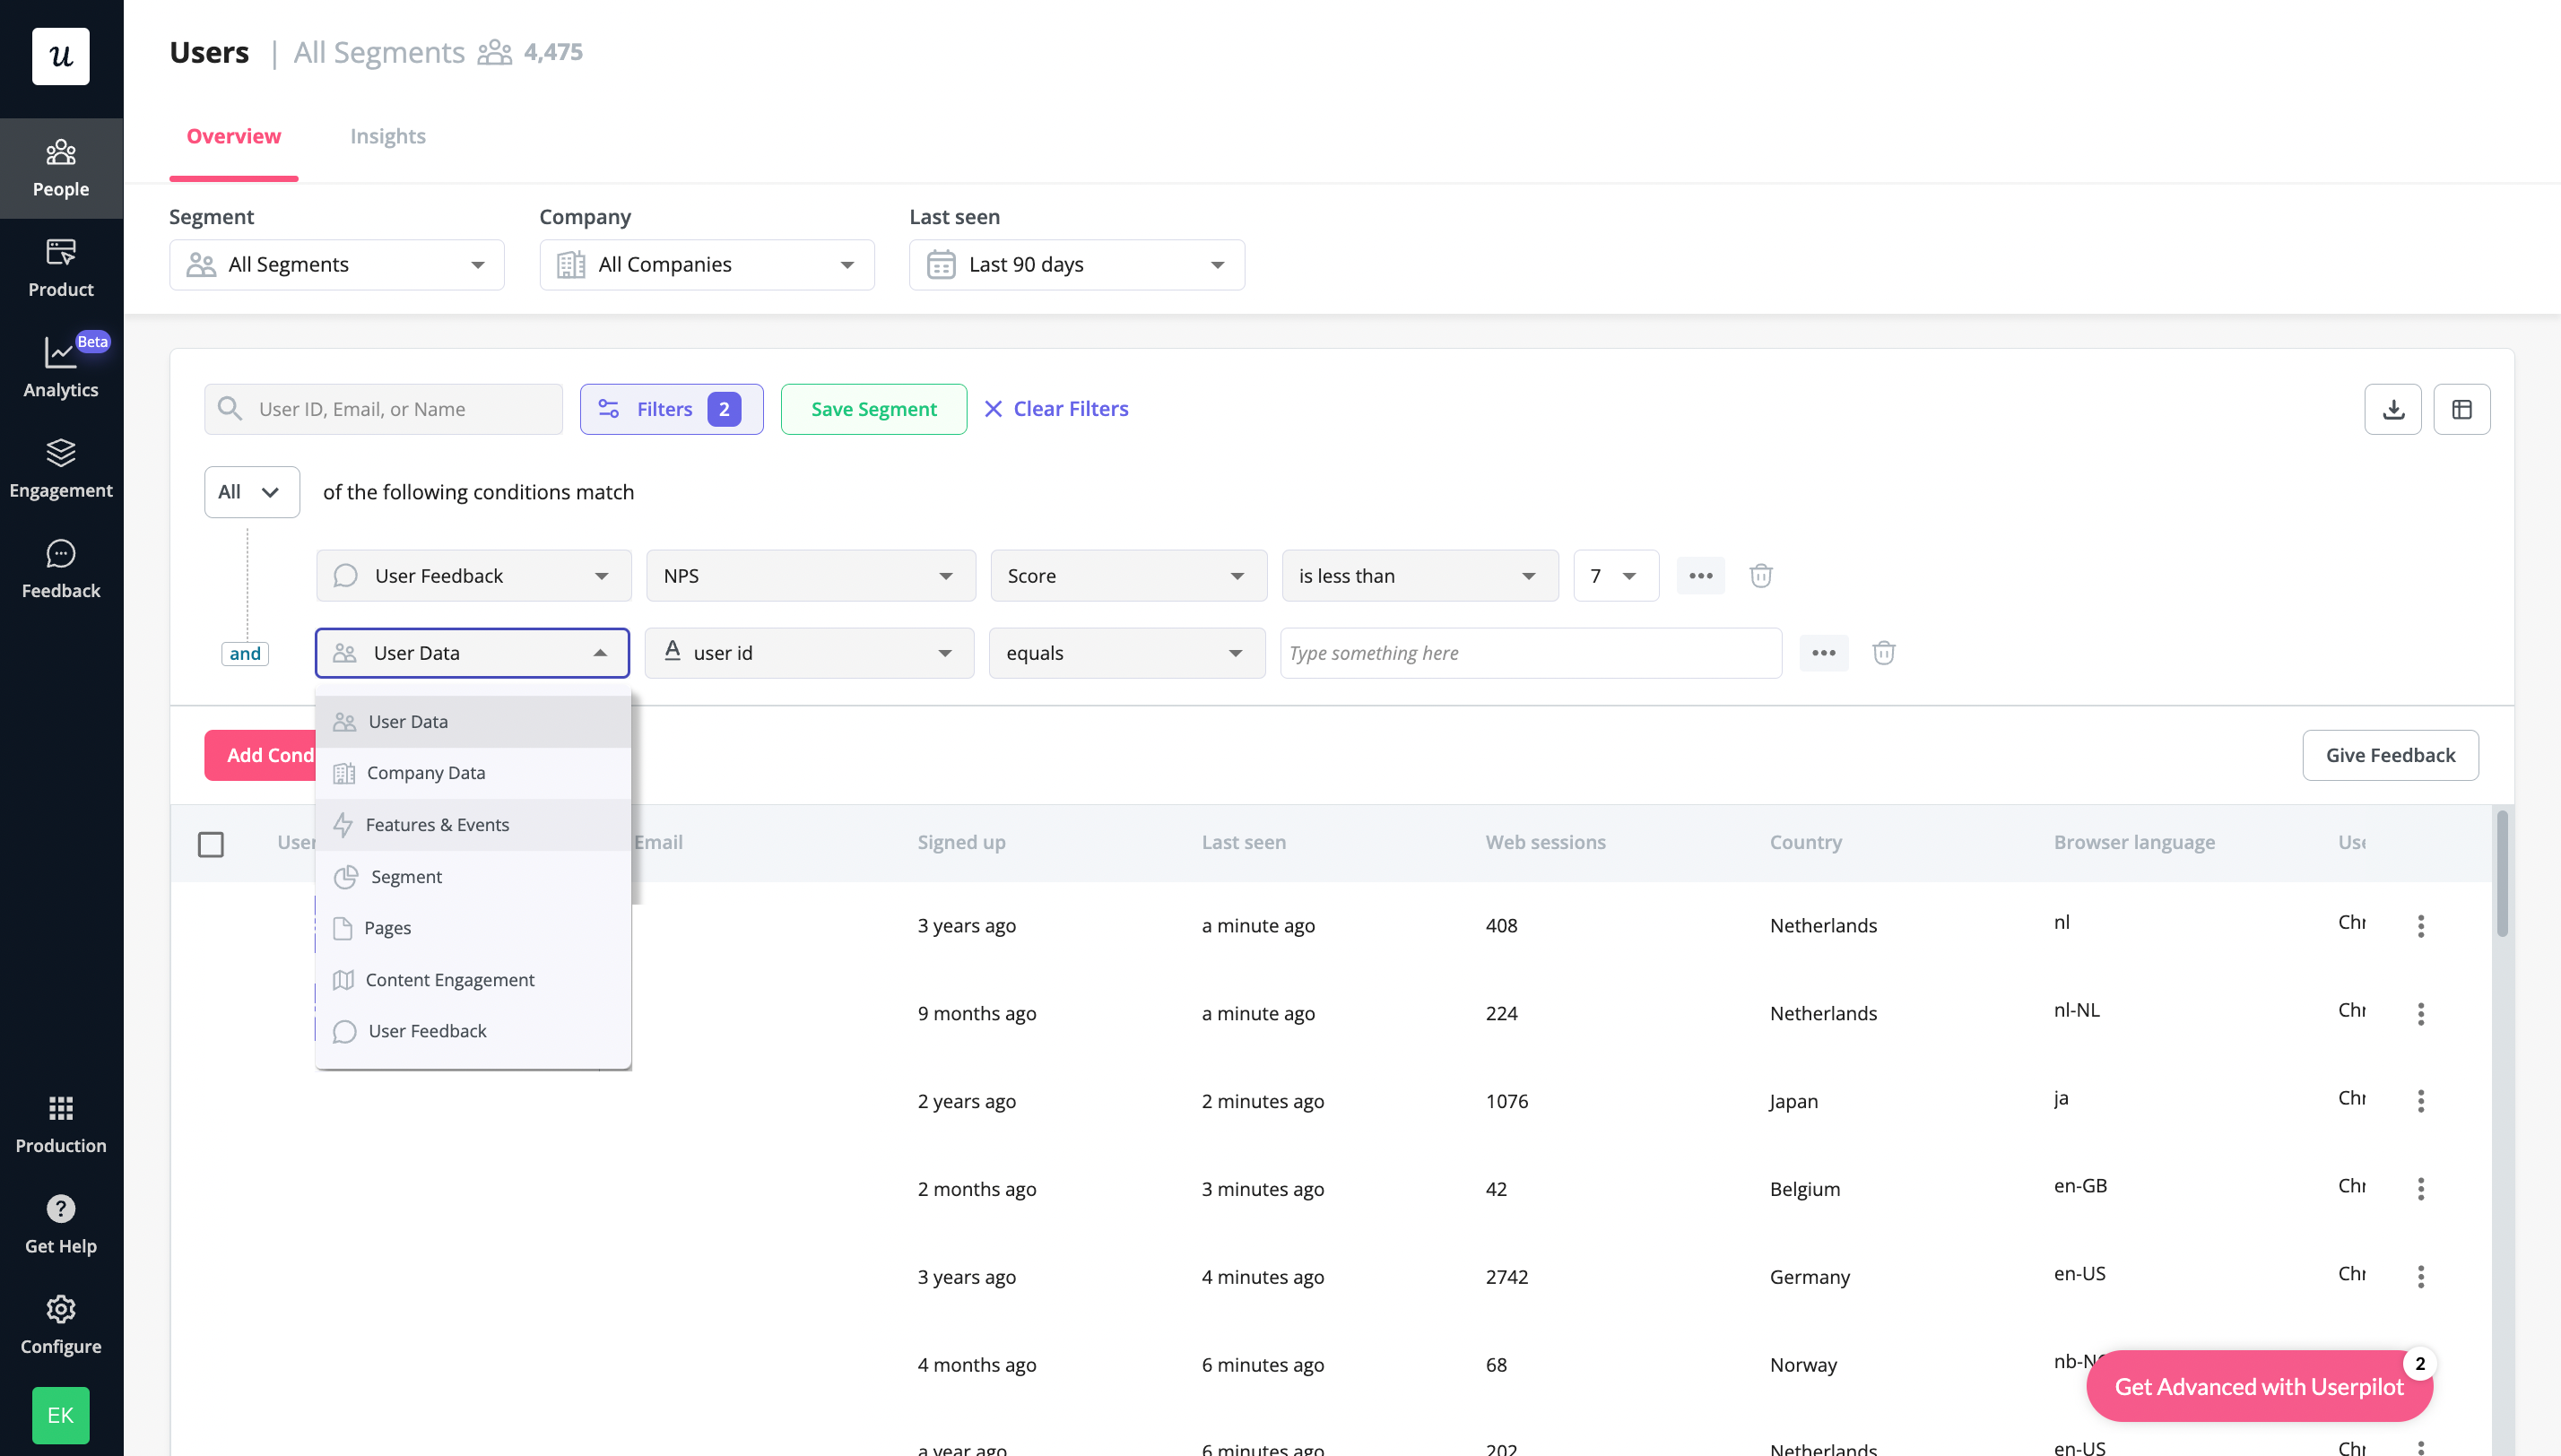
Segment customers based on conversion points
Segmentation is an integral part of conversion funnel analysis. It allows you to identify patterns in customer behavior and track how customers progress through the funnel.
You should find out the key conversion points in your company’s conversion funnel. Then you can group customers based on conversion points, like trial sign-up, purchase, etc. You can have customer segments like trial users, paying users, new users, activated users, power users, etc.
Customer segmentation can help you better understand the behavior of each group and tailor your strategies accordingly. For instance, if free trial users drop off at a particular point in the funnel, you can offer additional resources to encourage those users to convert.
You should also prioritize determining how the conversion funnel looks for your power users. Using this data, you can learn what worked for these loyal customers and use the formula to improve the funnel for other users.
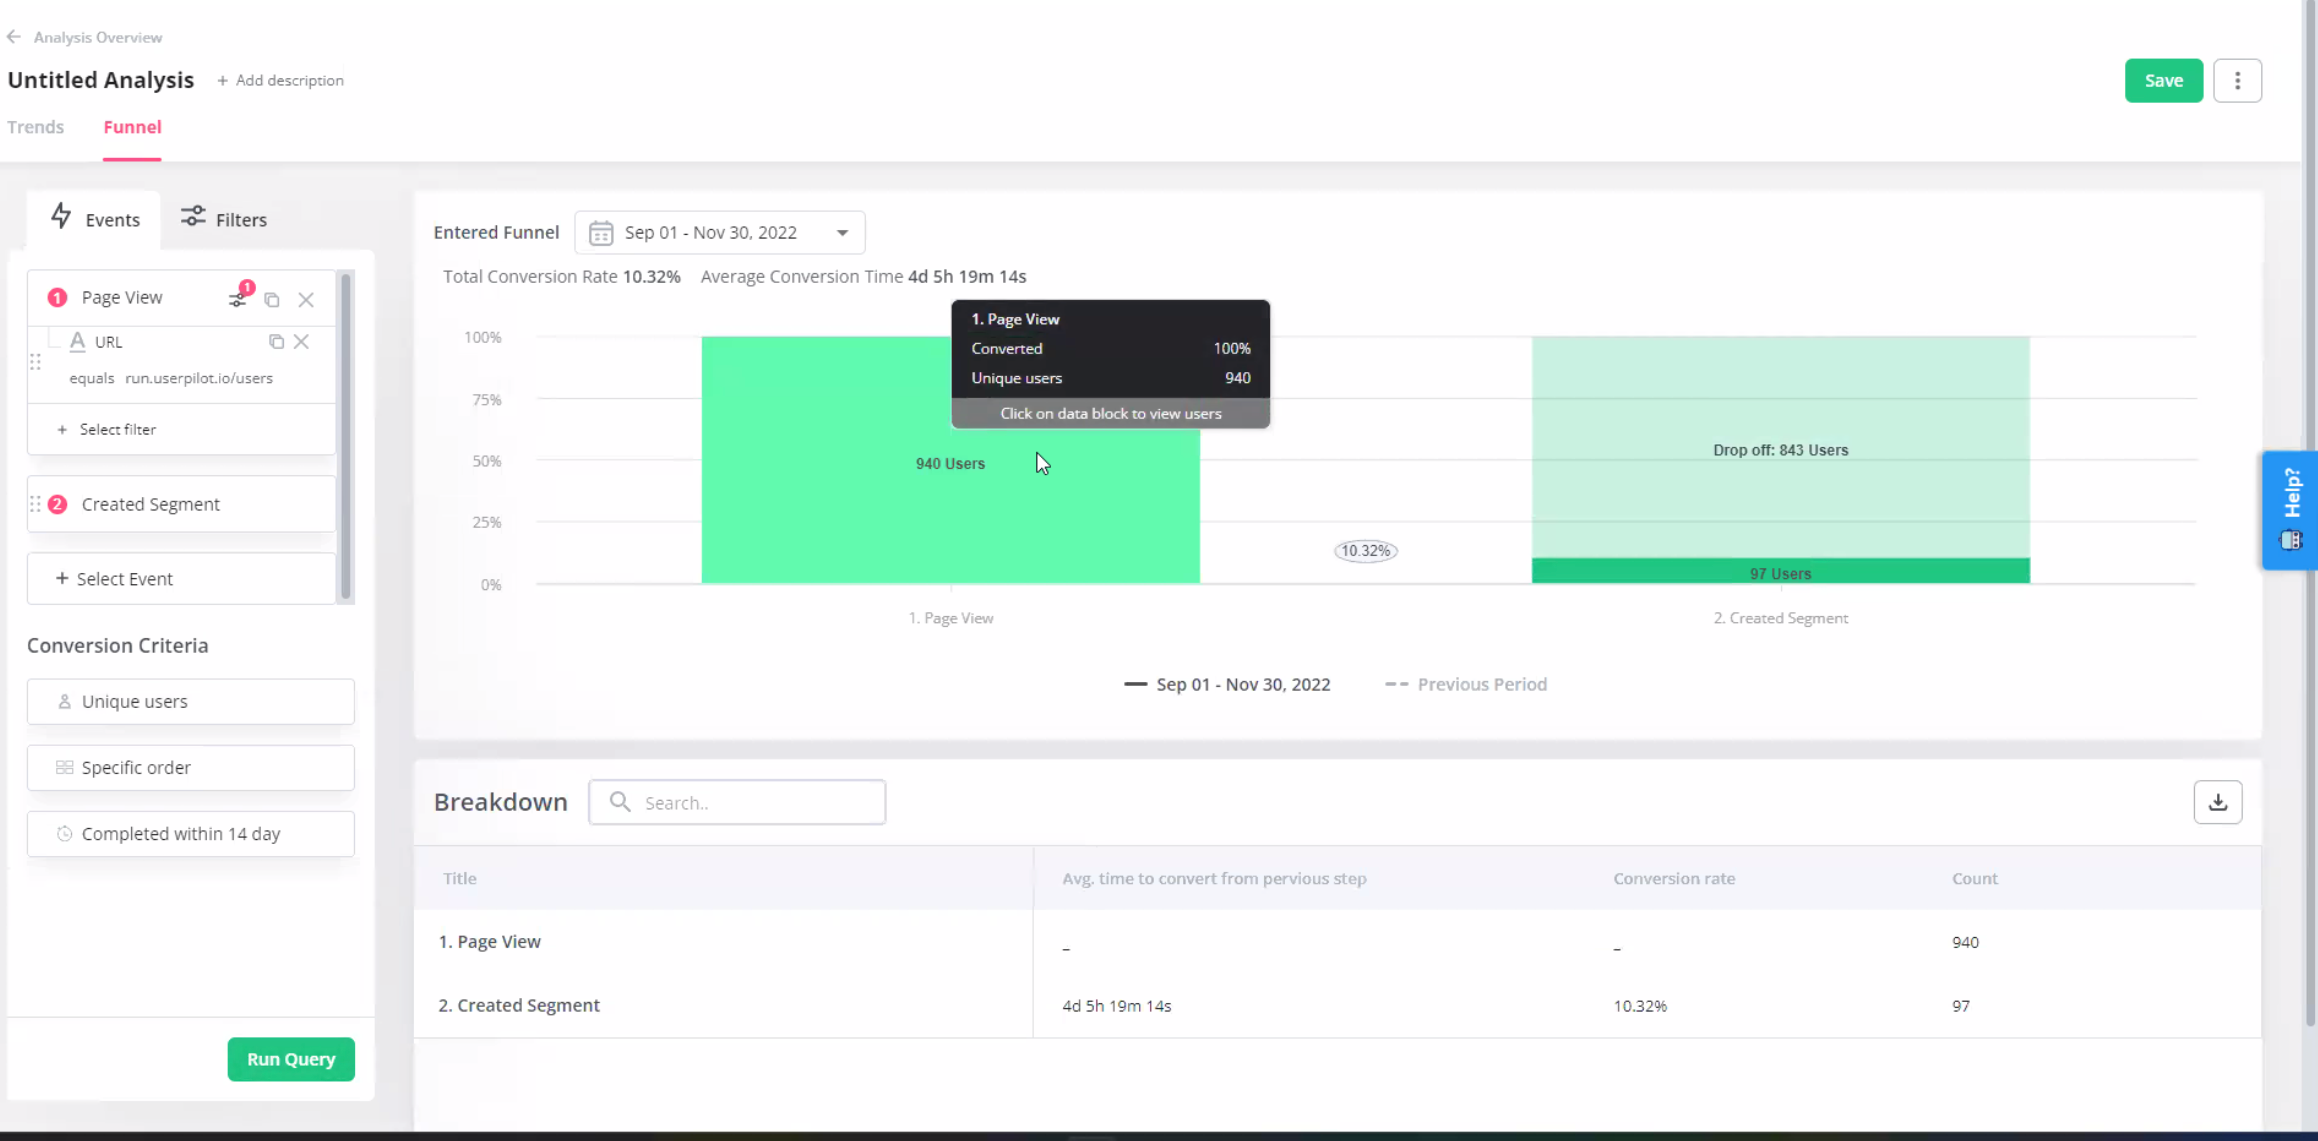
Use a funnel analysis tool to visualize the data
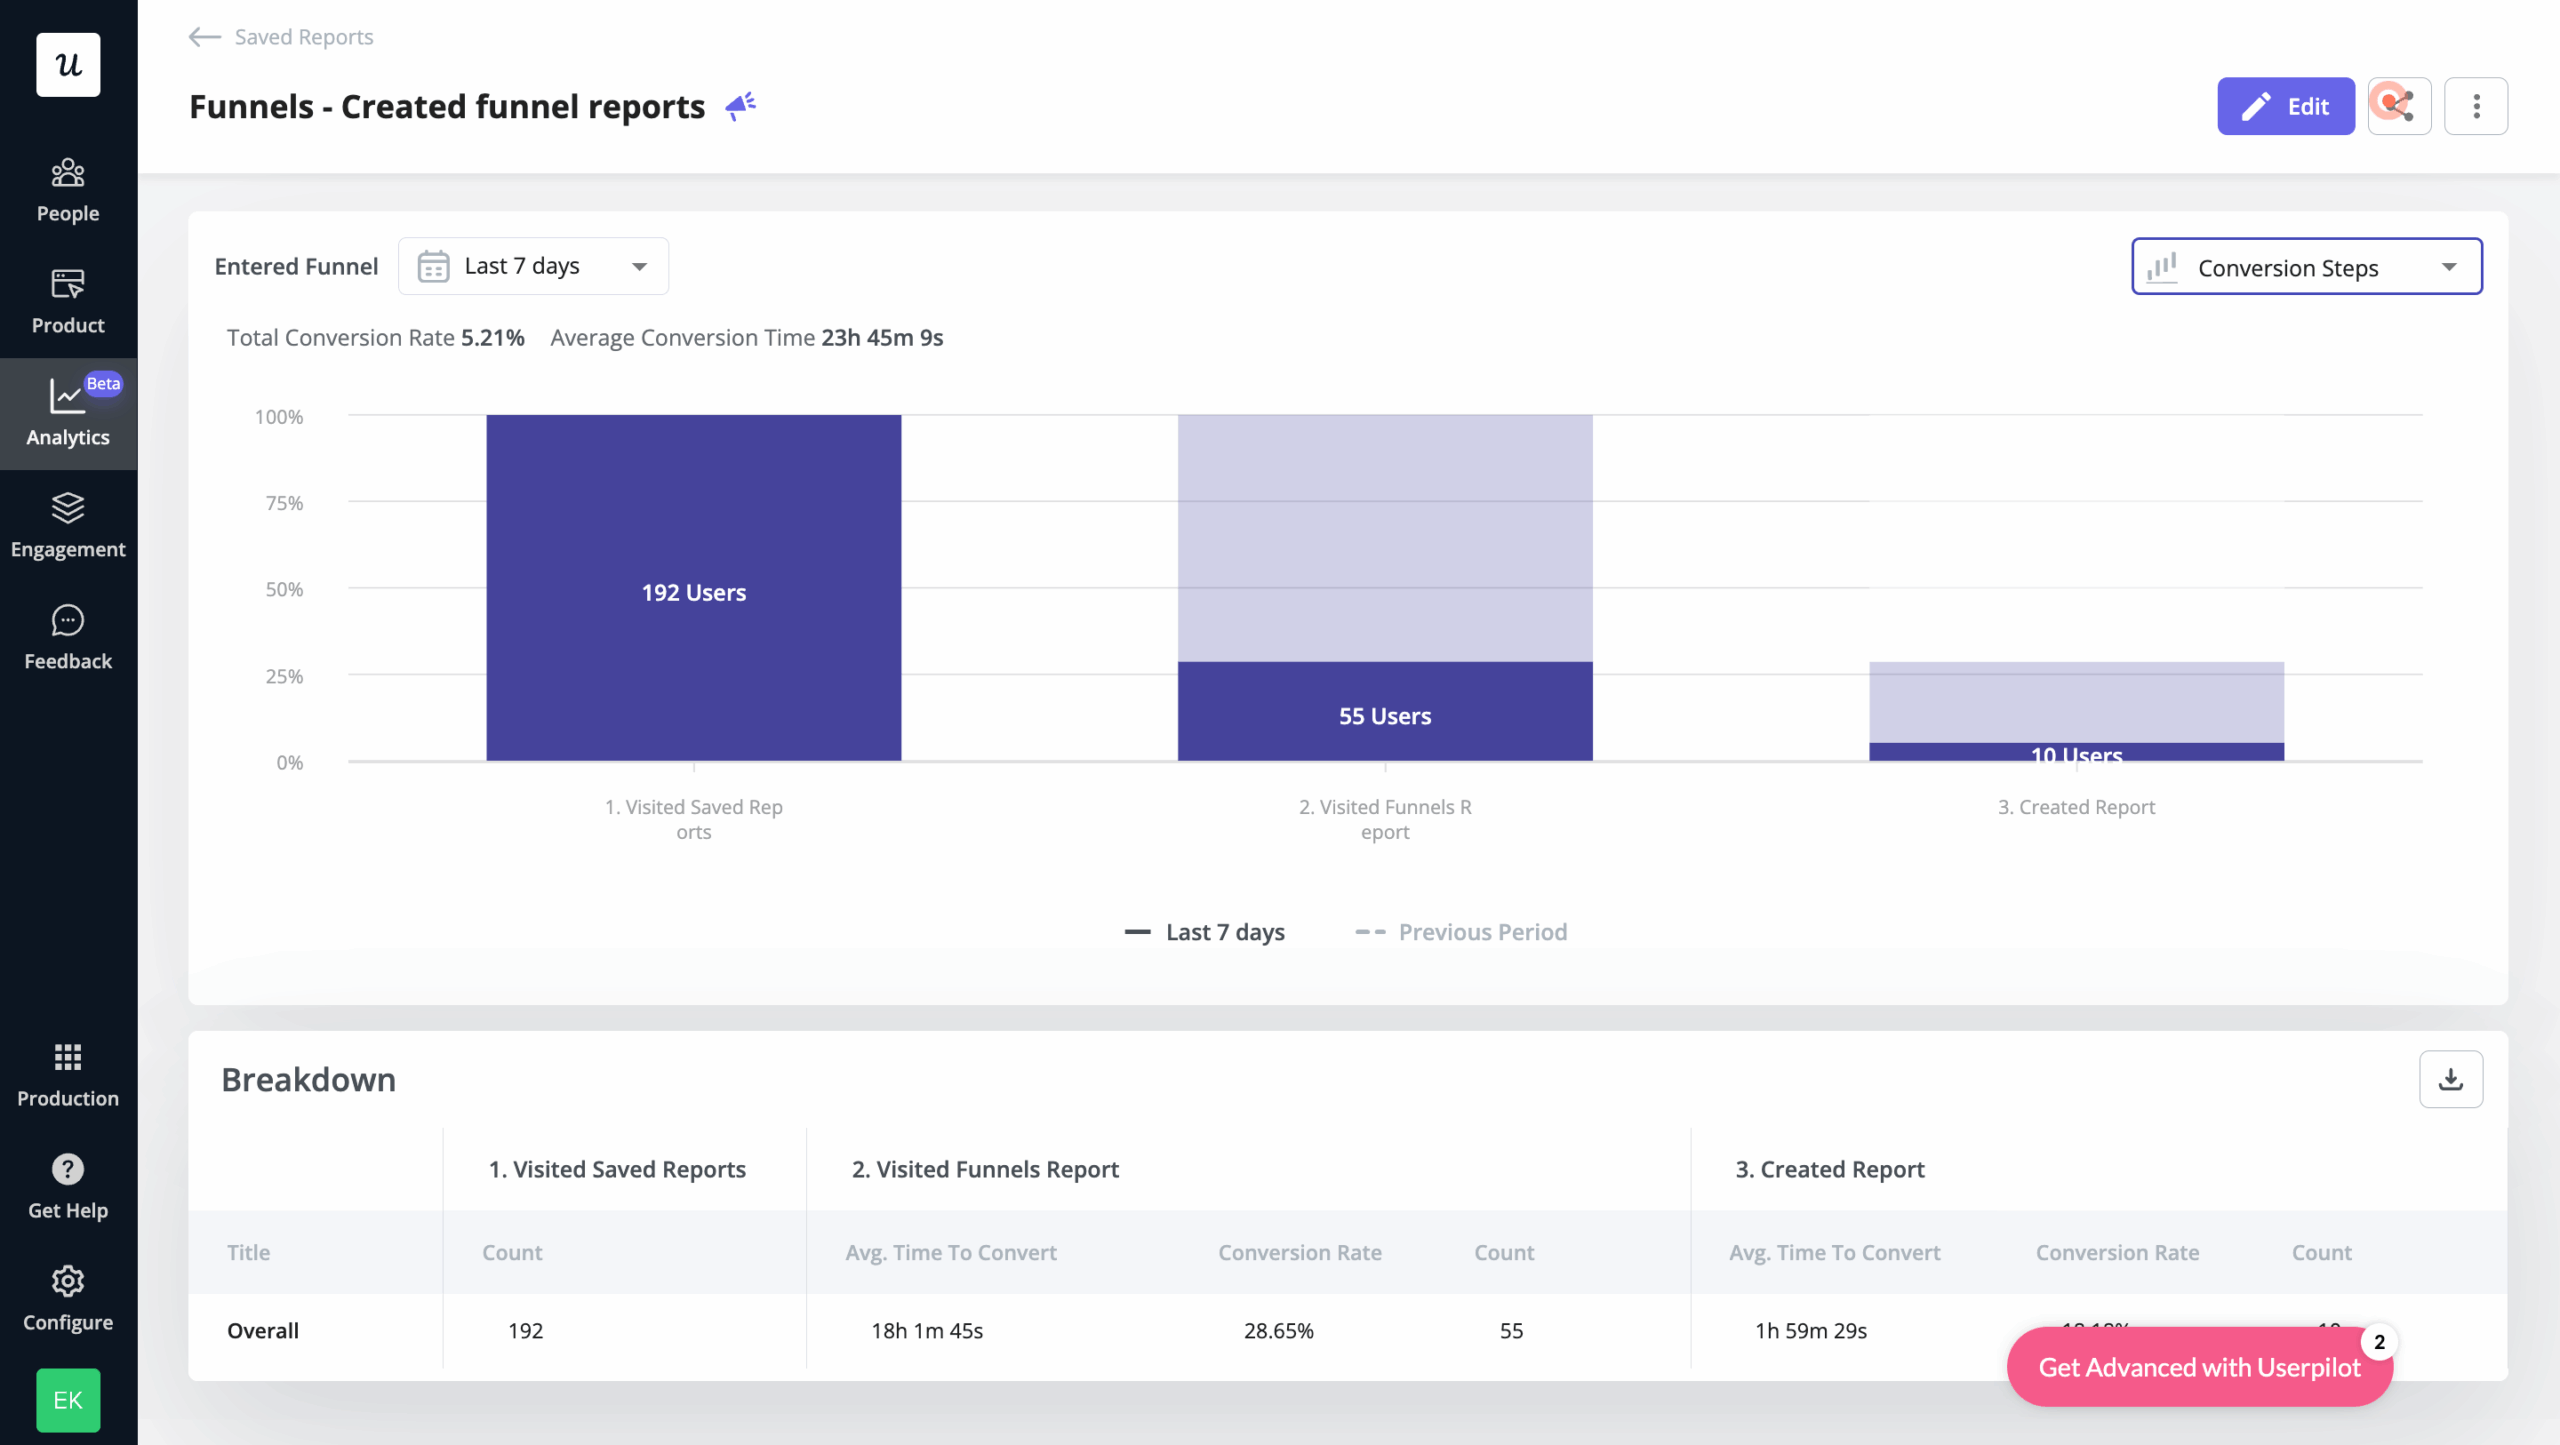
You need to use a funnel analysis tool to make sense of the data you acquire. A funnel analytics tool can help you visualize your data and make the funnel analysis more effective.
Using a funnel analysis tool allows you to combine all the data from different sources in one place. It helps you easily analyze and draw insights from the data and identify the issues in the conversion funnel. A funnel analytics tool lets you pinpoint the parts of your conversion funnel where customers drop off and take steps to optimize those areas.
It can also help you create reports to offer an in-depth understanding of how customers interact with your SaaS business.
Conclusion
Conversion funnel analysis is the key for SaaS businesses to increase conversions and generate more revenue. It can help you understand what is working and what needs further attention. So you get to bring out the highest potential from your product and customer experience and convert more customers.
About the author