Mixpanel vs Google Analytics: Which is Better for Your SaaS Business?


What is Mixpanel?
Mixpanel is a simple and powerful product analytics tool that allows product teams to track and analyze in-app product engagement. It allows your team to understand user interactions, so you can make changes that work.
In addition, it lets you explore data freely without using SQL. Set up your metrics to measure growth and retention. Slice and dice data to uncover trends and see live updates on how users interact within your app.

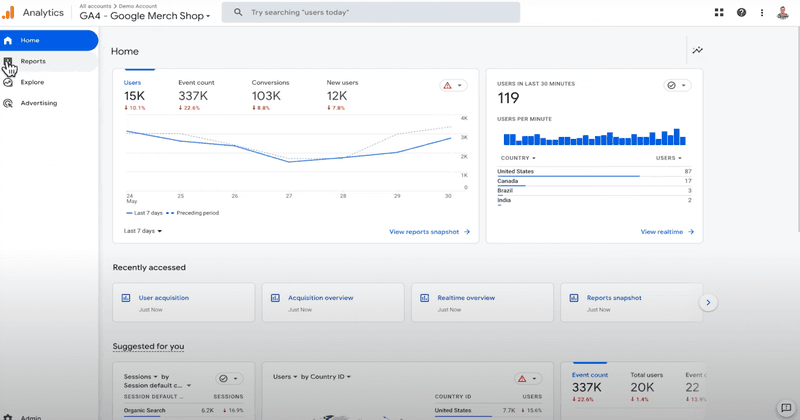
Google Analytics is a universal analytics service offered by Google that tracks and reports website and mobile app traffic and user engagement events, currently as a platform inside the Google Marketing Platform brand.
It’s a popular tool for e-commerce businesses that focuses on tracking conversion and purchase-related data and leveraging such data for advertising purposes.
You only need to link your website to your Google Analytics account to get started.
Mixpanel for user behavior tracking
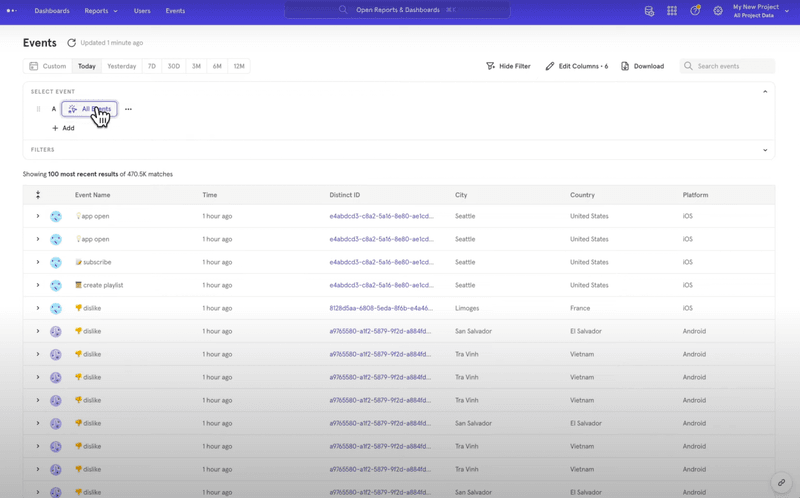
Event tracking in Mixpanel is a crucial means of understanding user behavior and product performance. It involves monitoring specific user actions or events within your product and is typically implemented in just a few steps.
There are two main methods for event tracking in Mixpanel:
- Server-side: Events are sent from your servers to Mixpanel by Mixpanel’s Server SDKs.
- Client-Side: Events are generated on the client device (web or mobile app) and sent to the Mixpanel API. While this method is accessible, it’s less reliable due to ad blockers and can be harder to update since it may require app redeployment. Server-side tracking is preferred, with client-side tracking used when necessary.
As you get started with the tool, it’ll recommend you track two main events:
- Sign Up Event: Track when a user creates an account with mixpanel.track(‘Sign Up’). This helps gauge your product’s growth by counting new users over different time periods.
- Value Moment Event: Track when a user reaches a significant value point in your product, such as completing a purchase, watching a video, or creating a document. You can customize these events to align with your product’s unique features.
Google Analytics for user behavior tracking
Google Analytics 4 (GA4) also uses events to display user interactions or occurrences on your website or app. Events can be anything from a button click to a video view to a form submission.
You’ll find a number of auto-collected events that are mainly for marketing efforts and conversion purposes such as:
- click
- impression
- session
- subscription
- in-app purchases
- download
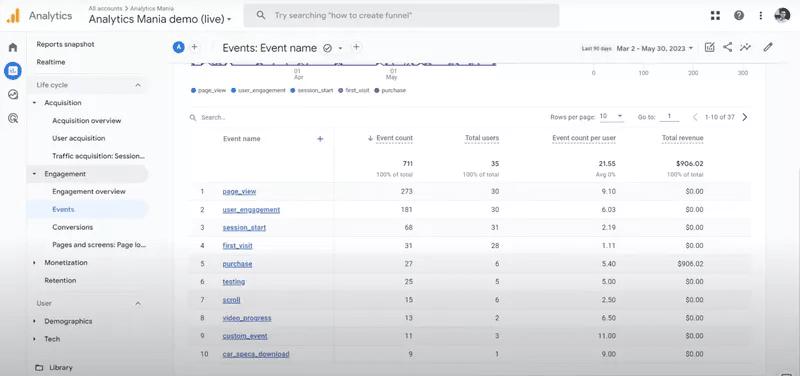
Auto-collected events in GA4.
You can refer to the full list in their docs here.
Apart from that, to track and collect other Google Analytics data – those that are not in the auto-collected list, you need to define events and set trigger conditions in Google Tag Manager.
Such event tags will send the custom event data to GA4, and you’ll be able to see these events’ analytics under the Event Report section.
Mixpanel for user segmentation analysis
User segmentation is the process of separating users into distinct groups or segments.
What features serve as a bedrock for Mixpanel’s functionality on segmentation analysis:
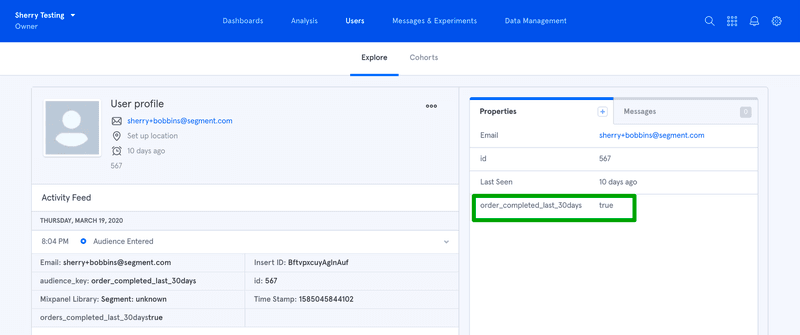
- Custom properties: By using custom properties, you can create more refined segments that align with your business goals and user characteristics. Custom properties let you combine existing properties into new properties on the fly, using a simple Excel-like formula language.
- Segmentation logic: An expression or logic consists of a property combined with one or more operators that can perform mathematical operations, logical operations, or typecasts. Mixpanel provides segmentation logic that allows you to create complex user segments using a combination of attributes, events, and properties.
Google Analytics for user segmentation analysis
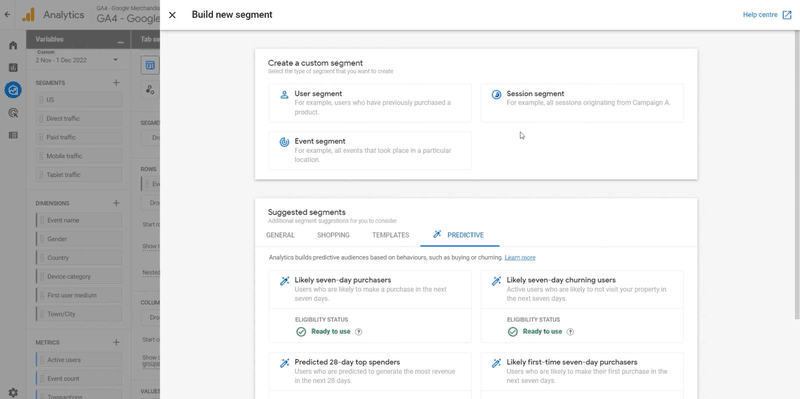
You can segment your users in two ways in GA4, either by templates or by building custom segments.
For templates, there will be suggested templates that are of common interest to e-commerce businesses, such as Purchasers, Checked-out starters, Basket abandoners, etc.
You can also segment users using predictive analytics, which will help you segment users who are likely to:
- purchase in 7 days
- churn in 7 days
- make a purchase for the first time in 7 days
- spend the most in 28 days
- stop purchasing in 7 days
If not using a template, you have three options to build a custom segment based on:
- Users – a subset of your users who are defined by properties such as id, device, behavior, etc.
- Sessions – a subset of your sessions (i.e. sessions from a marketing campaign), and these sessions can include multiple sessions from the same user.
- Events – a subset of your events (i.e. events that come from a specific country), and these events can include repeated events from the same user.
Mixpanel for funnel analysis
Conversion funnel analysis is the key for SaaS businesses to increase conversions and generate more revenue.
Mixpanel’s funnels make it easy to track user progress throughout the customer journey. It does not simply provide a cluster of data but instead breaks down a user’s journey into sequential steps that are easy to track and analyze.
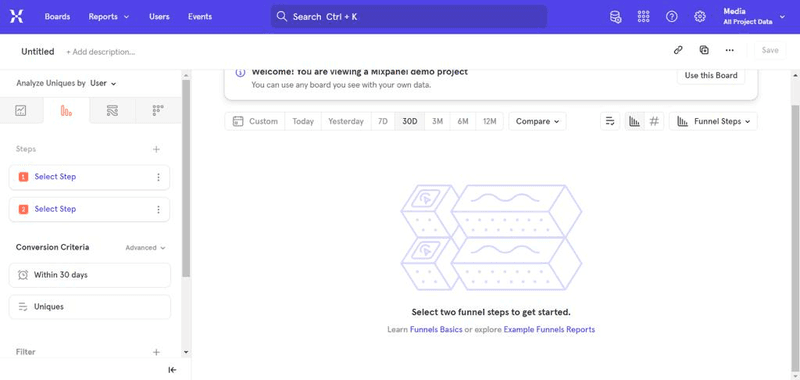
Here are features on MixPanel for tracking user funnels:
- Backfilling: Mixpanel’s default “backfilling” feature adds missing event properties. When a property appears in later funnel steps but not earlier ones, it is seamlessly integrated.
- Custom events: Mixpanel enables the creation of custom events by combining multiple events into one. This flexibility allows you to design funnels with multiple pathways leading to the same goal.
- Intuitive reporting: With Mixpanel, funnel reporting is user-friendly. The platform automatically generates graphs and charts as data flows in, providing instant visual insights.
Mixpanel has its own event tracking SDK, but it is much more limited in scope than Segment. It only tracks first-party data generated when customers use an app, website, or other digital channels.
Unlike Userpilot, you can’t analyze user paths up to 4 pages at a time at a glance on Mixpanel. In addition, Userpilot can track feature usage by user segments with heat maps directly on the different pages of your product.
Google Analytics for funnel analysis
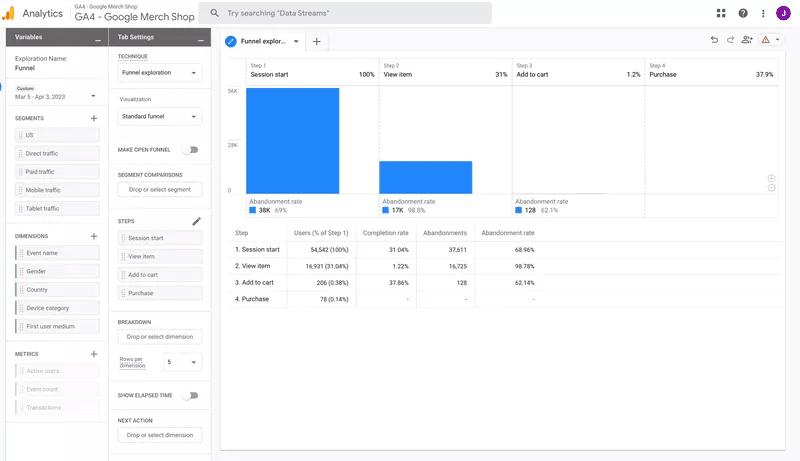
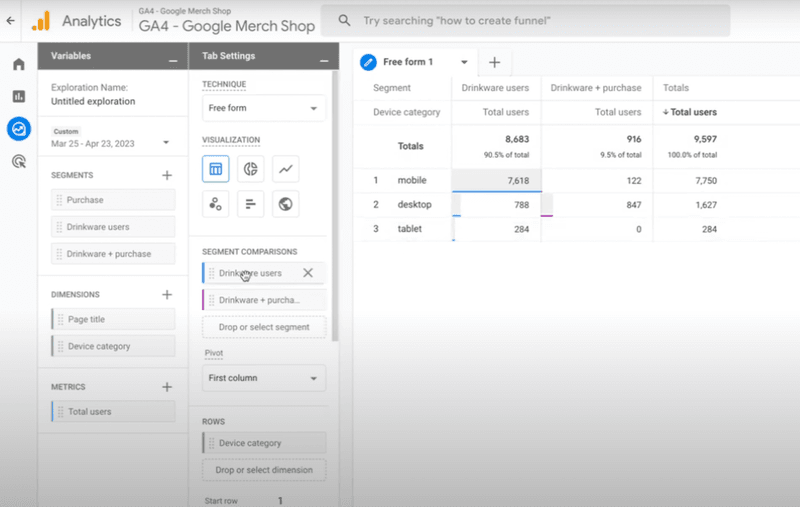
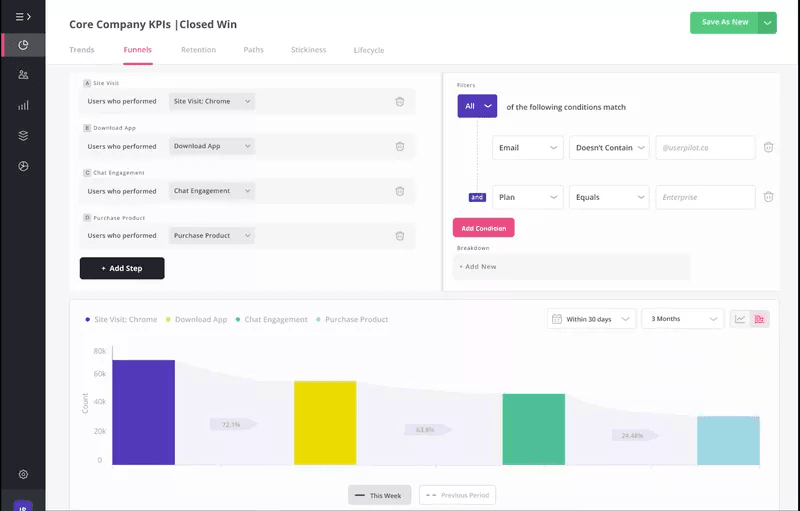
There are two ways to view funnels in GA4 – you can see the default user purchase journey under the Monetization dashboard or customize a funnel in the Exploration dashboard. Here are the main funnel features in detail:
- Custom Funnels: It’s easy to see how well your users do at each step with Custom Funnels. Each stage of Custom Funnels has a graph showing the number of users who completed or dropped off.
- Funnel Exploration: Analyze, segment, and break down user journeys. Users can identify and improve inefficient or abandoned customer journeys using funnel exploration.
- Notifications: In Google Analytics, users can receive alerts when the funnel conversion rate spikes or drops — helping teams stay in the loop.
- Multi-Channel Funnel Report: With Google Analytics, you can see what channels (clicks and referrals) led to which conversions and transactions.
Mixpanel for retention analysis
User retention measures how successfully you keep hold of your customers over a given time frame. Product owners and managers study user metrics over time and across multiple sessions to understand how and why customers churn.
Here’s a closer look at some of Mixpanel’s retention analysis features:
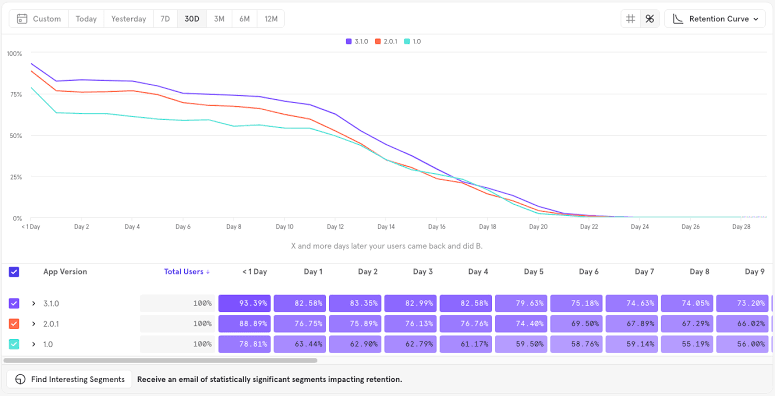
- Flexible user segmentation: Mixpanel provides the flexibility to segment users based on criteria such as user properties, cohorts, attribution sources, locations, and behavior.
- Timeframe customization: The default retention reports cover up to 60 days, but you can extend this period by choosing the “Each Week/Month” option in the Retention Criteria settings.
- Comparison baseline: Setting a baseline for improvement and comparing retention rates over time is the best way to track progress. Mixpanel suggests using 7-day retention to predict 30 or 90-day retention rates. If your product’s natural usage cycle is longer than three months, you can use 90-day retention to predict the one-year rate. You can adjust this timeframe in Mixpanel’s Retention report.
Mixpanel takes a practical approach to calculating retention. It focuses on completed time intervals when determining average retention rates, avoiding skewing the results.
Google Analytics for retention analysis
In Google Analytics 4, you can set up a cohort analysis by selecting the cohort template in the Exploration section.
By default, it helps you track user retention of segments having the same acquisition date and return criteria being any event – meaning any repeating interaction with your website or app will be counted.
If you want to track otherwise, for example, a specific returning event such as clicking on a feature, you have to configure it.
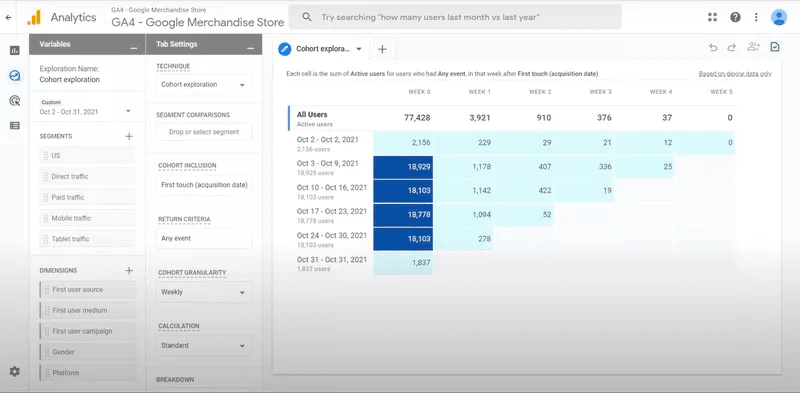
When performing cohort analysis, GA4 allows you to analyze retention by seeing differences in active users, event count, transactions, or purchase revenue.
Mixpanel for A/B testing
A/B testing is a scientific, evidence-based method to optimize the performance of a product or landing page.
With Mixpanel’s A/B testing, you can experiment with variations of your product, features, or user experiences and make data-driven decisions based on user behavior.
So, what features make this a reality:
- Experiment creation: With the experiments feature, you can create different versions of your interface, messaging, or features to test how users respond to each variation.
- Event tracking integration: Mixpanel’s event tracking functionality integrates events into your experiments, allowing you to track user interactions and behaviors within each variation accurately.
- Iterative testing: You can implement changes based on the results of one test, continuously refine your product variations, and drive ongoing improvements.
There are other specific comprehensive A/B testing features like grouping, which are not found on Mixpanel. For instance, Userpilot makes it easy to test flows against a control group (Userpilot vs. nothing). With that data, your team can now make more informed decisions and measure the impact that flows are having on your growth goals with higher accuracy.
Google Analytics for A/B testing
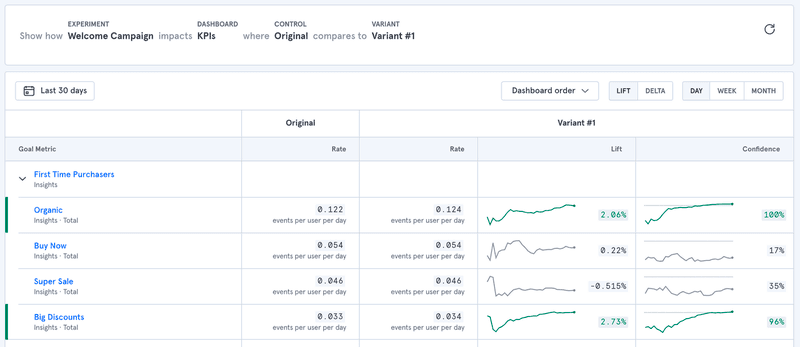
A/B test in Google Analytics is limited due to its nature as more of a web analytics tool than a product analytics tool. So, here are two key features of Google Analytics for A/B testing:
- Content experiment: Google Analytics has a content experiment feature. Users can compare different variations of pages with it. In an A/B test, you can create two or more variants of the same web page, with variant A being the original and variant B containing at least one modified element.
- Segmentation: You can segment users in Google Analytics based on user behavior, demographics, locations, and interests. Analyze the performance of various segments. And double down on the best-performing segments.
Mixpanel’s pricing
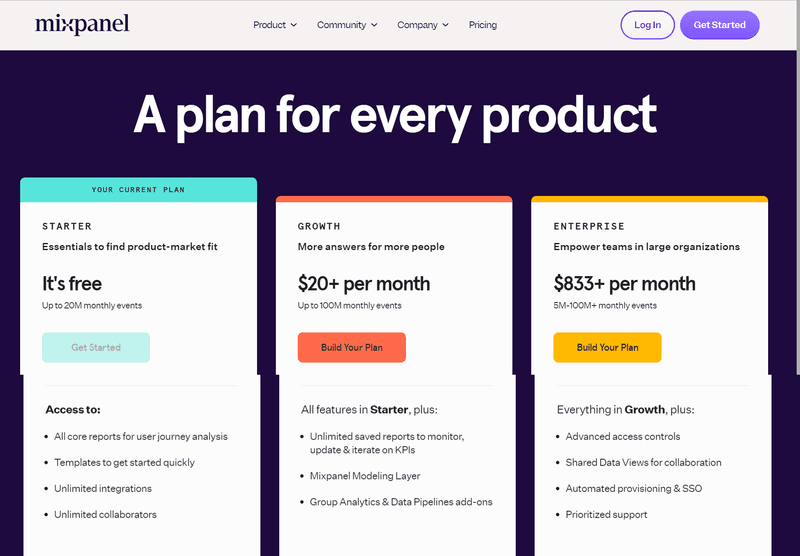
Mixpanel’s pricing plan is divided into 3 plans; the starter plan, the enterprise plan, and the growth plan.
Here’s an overview of the pricing plans and features of each plan:
- Starter plan: This plan features essentials to find product-market fit. It is free and allows up to 20M monthly events.
- Growth plan: This plan costs $20+ per month for up to 100M monthly events. You get all features in the starter plan plus unlimited saved reports to monitor, update, and iterate on KPIs, Mixpanel modeling layer, and so on.
- Enterprise plan: This plan empowers your team, especially if you have a large organization. It costs $833+ per month for up to 5M-100M+ monthly events. This plan features all the benefits of the growth plan plus advanced access controls, shared data views for collaboration, automated provisioning and SSO, and prioritized support.
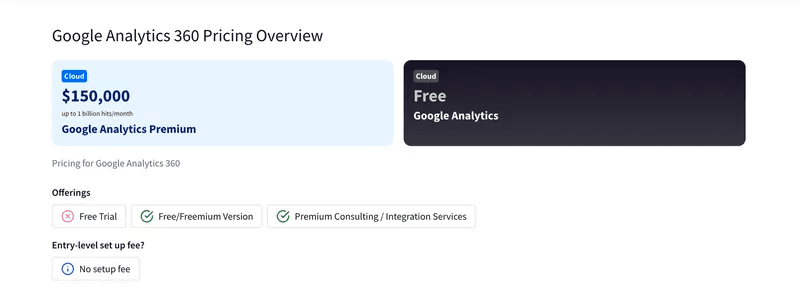
Google Analytics’s pricing
Google Analytics is a free tool with paid upgrades available for advanced features. It has two price plans: the free and 360 plans respectively:
- Google Analytics offers a free version that provides a wide range of features for basic website analytics. It’s suitable for individuals, small businesses, and websites with relatively low traffic.
- GA 360 (now GA4) provides higher data limits, BigQuery integration, service level agreements, custom variables, and a dedicated support team. The cost of Google Analytics 360 starts from $12,500 per month and $150,000 per year. Google suggests that the cost of Google Analytics 4 360 starts at a retail price of USD $50,000/year, which entitles customers to 25 million events per month at no additional cost.
Which tool should you choose?
Looking at the pros and cons of Mixpanel and Google Analytics can give you actionable insights for making your final decision.
Pros and cons of Mixpanel
As with any data analytics tool, Mixpanel has its strengths and weaknesses.
Pros of Mixpanel
Let’s have a look at the pros of using Mixpanel:
- Sophisticated features that enable granular data analysis are a significant advantage of using Mixpanel because they allow you to identify users and track user interaction.
- Unlimited segmentation capabilities based on attributes, user properties, and cohorts
- Easy-to-navigate UI patterns to help you work in the most organized way
- Powerful interactive and easily accessible visuals for quicker decision-making to beat analysis paralysis
Cons of Mixpanel
While Mixpanel is a powerful product analytics tool with many great features, there are still some downsides. Here are the main cons of the tool:
- The free plan works well for small SaaS businesses, but enterprise-grade features can be expensive depending on your needs.
- You will need the help of your engineering team to set up and configure the tool — The platform’s advanced functionalities, custom event tracking and segmentation, might require a steeper learning curve, especially for those without a strong background in data analysis.
- Limited Attribution Models: While Mixpanel offers various analytics features, its attribution modeling capabilities might be more limited.
- There is no user feedback or engagement functionality, so you need third-party tools.
Pros and cons of Google Analytics
Now let’s look into the pros and cons of Google Analytics.
Pros of Google Analytics
- Can get insights at a granular level using various event attributes.
- Have a great variety of custom graphs, charts, and reports for analyzing traffic data.
- Easily monitor e-commerce metrics and other vital metrics associated with online transactions.
- Integrate seamlessly with other Google products for marketing purposes such as Google Ads or Google Tag Manager.
Cons of Google Analytics
- Difficult to set up without knowledge of event properties and parameters.
- Too many configuration options are available meaning it takes time to configure the desired reports, apart from the default reports that are conversion and purchase-related.
- Poor UI that makes it challenging to navigate features.
- Data inaccuracies due to factors such as ad blockers, referral spam, or privacy compliance.
What do users say about Mixpanel and Google Analytics?
We’ll now go through some reviews about Heap and Google Analytics to understand how their users feel about them.
Mixpanel reviews
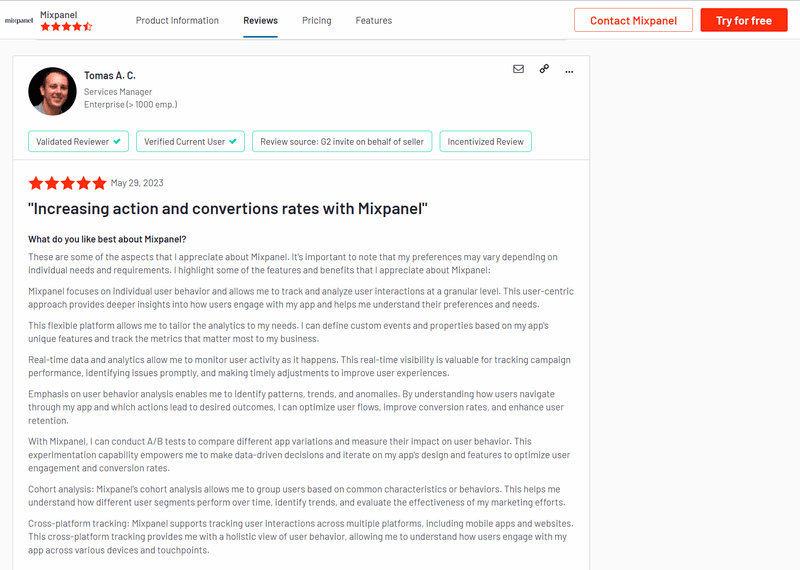
Mixpanel is consistently termed an excellent, powerful, and result-oriented tool by its loyal customers. Generally, customers say it’s easy to use, easy to customize, and how easily it tracks analytics.
Here are the great stories customers are telling about Mixpanel:
These are some of the aspects that I appreciate about Mixpanel. It’s important to note that my preferences may vary depending on individual needs and requirements. I highlight some of the features and benefits that I appreciate about Mixpanel: Mixpanel focuses on individual user behavior and allows me to track and analyze user interactions at a granular level. This user-centric approach provides deeper insights into how users engage with my app and helps me understand their preferences and needs. This flexible platform allows me to tailor the analytics to my needs. I can define custom events and properties based on my app’s unique features and track the metrics that matter most to my business…
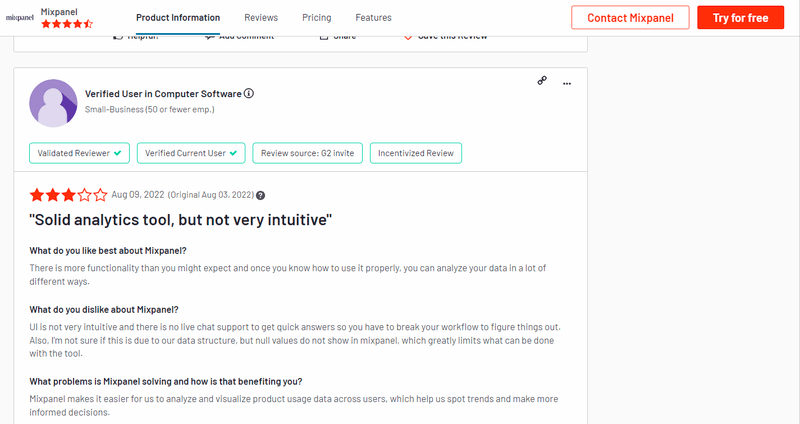
While Mixpanel has some great reviews, there are still some little downsides and quirks (same as every other SaaS tool). Here are some bad reviews of Mixpanel:
UI is not very intuitive and there is no live chat support to get quick answers so you have to break your workflow to figure things out. Also, I’m not sure if this is due to our data structure, but null values do not show in mixpanel, which greatly limits what can be done with the tool.
Google Analytics reviews
On G2, Google Analytics boasts an excellent rating of 4.5 out of 5.
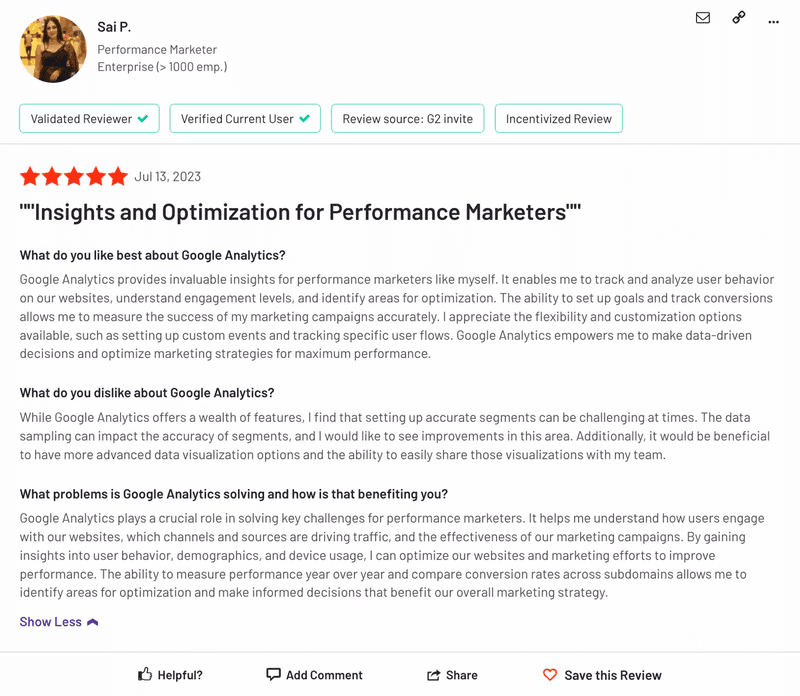
Google Analytics users found real-time tracking and comprehensive data analysis the most useful among its extensive features. Its customization and flexibility are also some other fan-favorite capabilities. Users also highlighted traffic analysis, goal tracking, and conversion features.
Here’s what Sai P., a performance marketer, had to say –
…The ability to set up goals and track conversions allows me to measure the success of my marketing campaigns accurately.
However, many users also mentioned some downsides, like data sampling, complexity for beginners, privacy concerns, etc. Its poor data accuracy because of dependency on cookies has been another major concern.
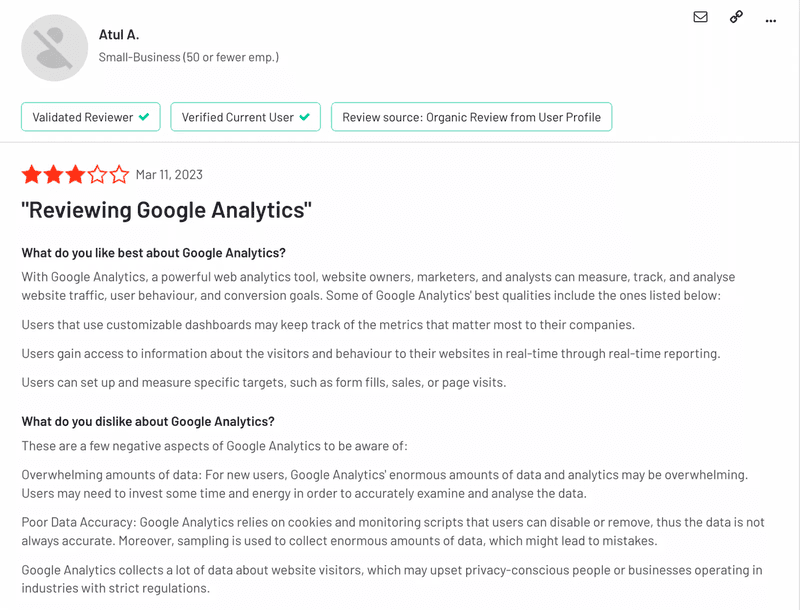
Atul A. pointed out some negative aspects of Google Analytics and said –
For new users, Google Analytics’ enormous amounts of data and analytics may be overwhelming.
Userpilot: A better alternative to both Google Analytics and Mixpanel
If you want an analytics tool that’s easier to use, has a more holistic set of features to drive growth, and is a better value for your money, Userpilot is the right choice for you.
Userpilot is a product adoption platform that offers advanced analytics capabilities and goes the extra mile by providing features for collecting user feedback and driving product adoption. Moreover, it’s a code-free solution that doesn’t require you to have any coding knowledge beforehand.
Userpilot analytics features
Userpilot’s analytics features are user-centric and provide actionable insights that resonate with your users’ journeys.
With Userpilot, you can also track user behavior via events by including both no-code and server-side events. You can feature tags and create custom events to track them to get granular insights into user interactions.
Userpilot takes the segmentation to a level beyond just grouping your users. It lets you understand users’ various behavioral nuances and segment them based on those with various user and behavioral attributes.
Userpilot’s built-in reports automatically translate the data into simplified reports and provide you with actionable insights into your user behavior data.
You can utilize these reports to understand your users better and gain product insights. To add to that, Userpilot also provides funnel analysis to offer you more actionable analytics.
Once you’ve sent NPS (Net Promoter Score) surveys and in-app surveys to your users, you can use the data to collect customer feedback, assess customer satisfaction and loyalty levels, and identify where you need to improve.
Pricing
Userpilot offers flexible pricing based on your monthly active users (MAUs). Plans start at $299 per month for smaller teams and scale as your user base grows.
Below are the pricing tiers you can choose from:
- The Starter plan begins at $299/month (billed annually) for up to 2,000 monthly active users. It includes in-app user engagement, usage trend analysis, NPS surveys, and essential product analytics—ideal for mid-market SaaS teams getting started.
- The Growth plan offers custom pricing and adds advanced analytics, retroactive event auto-capture, in-app surveys, session replay, and more. It’s the most popular choice for growing teams that need deeper insights and scale.
- The Enterprise plan offers custom pricing and includes everything in Growth, plus bulk data handling, custom roles and permissions, SOC 2 Type 2 compliance, and enterprise-level support.

Conclusion
Ultimately, Mixpanel and Google Analytics are valuable tracking tools, each with its own unique advantage. However, the choice between them should depend on which one aligns your needs better. And if you want to use an analytics tool that offers a more holistic solution for driving product growth, Userpilot is the right fit.
Want to see if there’s any tool that can give you the best of both? Get a Userpilot Demo and see how you can get better value and more user-centric analytical insights.
About the author