User Retention in 2026: Why Human Signals and Agent Signals are Now Two Different Things


User retention has changed more in the past 18 months than it did in the previous decade, and most teams are still measuring it the same way they did in 2019. The dashboards still show daily active users, the QBR slide still leads with NPS, and the renewal column still goes green when logins are up. None of that is wrong. It is just no longer enough.
Picture a CS manager opening her retention dashboard on a Monday. DAU is up, NPS is positive, the renewal forecast looks healthy. Four weeks later, the account churns. The reason: an AI agent the team had wired into her product through MCP stopped completing tasks three weeks earlier, and her dashboard never asked whether that agent came back. The humans were still clicking. The agents had quietly stopped.
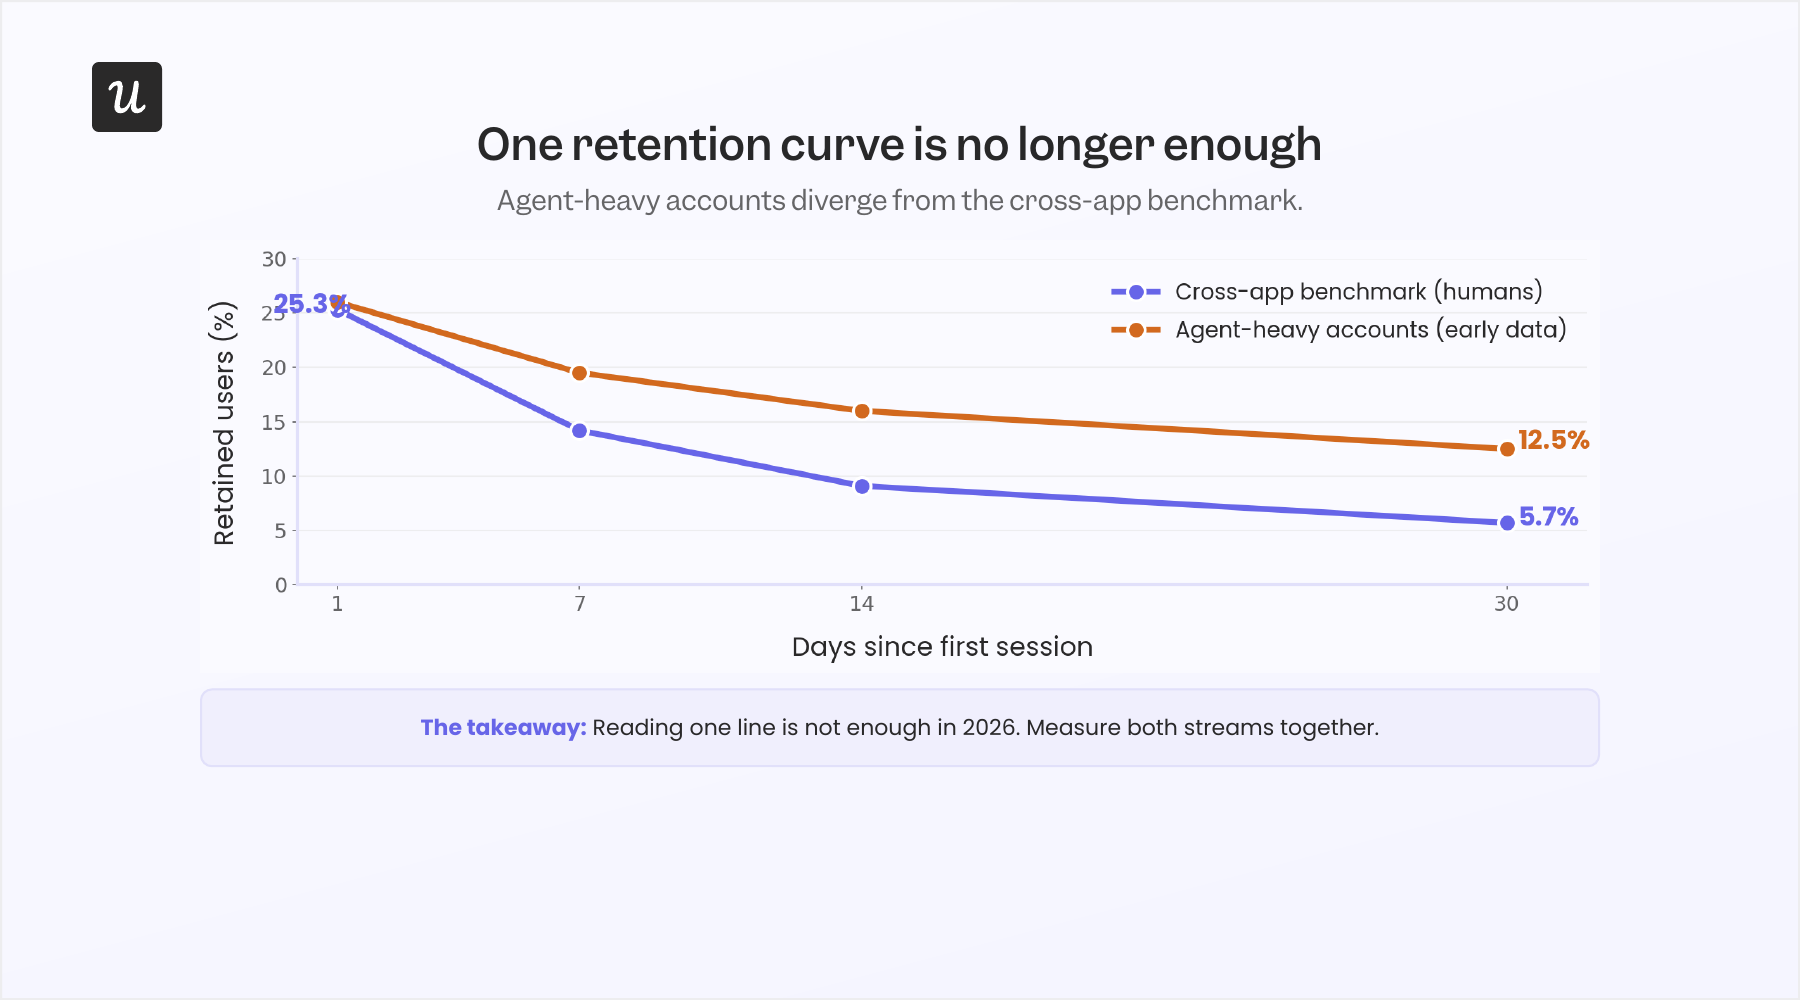
This is the new failure mode. According to Userpilot’s Agent Analytics, the customers most at risk of surprise-churn in 2026 are the ones with agents in production. Human metrics keep ticking up while agent metrics collapse, and nothing in the legacy retention stack is built to read both at once.
There is a second pressure compounding the shift, and it comes from the supply side. AI is now writing real production code, which means engineering teams that used to release one or two features per quarter are shipping seven, eight, nine. “Now it becomes even harder for product teams to manually track each one and understand usage for each one,” Yazan Sehwail, Userpilot’s CEO, told us recently. More features, more surfaces, more places where retention can quietly break, and a metric set that was already struggling to keep up with humans alone.
So here is the model the rest of this post will use. User retention is now two streams. Human signals (logins, sessions, NPS, feature adoption) and agent signals (task completion, agent return rate, MCP call success). Two sides of the same coin, measured separately, read together. Teams that build retention systems for both streams in 2026 will compound. Teams that keep measuring only the first one will lose accounts they thought were healthy.
What user retention actually means in 2026 and how it differs from customer retention
User retention is the percentage of users who continue using a product over a given period. It is a usage metric, calculated on individual user activity, and it tells you whether the people (and now agents) who signed up are still getting value from your product or service.
Customer retention is a financial metric. It tracks how many paying customers renew or stay subscribed during the same window. Same direction, different objects: user retention focuses on activity, customer retention focuses on revenue.
In a direct-to-consumer business, the two often collapse into the same number, because the active user is also the paying customer. In B2B, they diverge constantly. One paying account can have 200 seats, half of them inactive. The customer retention rate looks fine because the contract renewed. The user retention rate inside that account is telling you the renewal next year will not be so easy. Reading only one of these is how teams get blindsided by expansion targets they will not hit.
The definition of “user” has quietly expanded. For years, it meant a human sitting in your UI, clicking through flows you designed for them. Now it also means an AI agent connecting through MCP, receiving instructions from a human somewhere upstream and executing tasks without ever touching an interface. Same product, two different shapes of interaction.
The tricky part is that these two modes of use don’t produce the same signals. Human usage has been measured for over a decade — session length, activation rates, drop-off points, all the standard instrumentation. Agent usage is newer territory. What a healthy agent session looks like, which failure patterns matter most, how to tell the difference between an agent moving fast and an agent doing something wrong — most teams are still working that out.
This is the contrarian piece that has not landed in most user retention guides yet. If your retention model assumes every user clicks, scrolls, and opens sessions, you are measuring half your users.
Yazan put it this way when we talked about the MCP server build: “Someone in finance might not even know about Userpilot. They want to get information around product usage and how it relates to revenue. They talk to the foundational model. The foundational model is connected to Userpilot.” That finance person is the human. The model is the agent. Both are pulling value from the product. Only one of them is on your DAU chart.
The two streams of user retention: Humans and AI agents
This is the framework that the rest of this post turns into action. Treat user retention as two streams that need to be measured separately and read together.
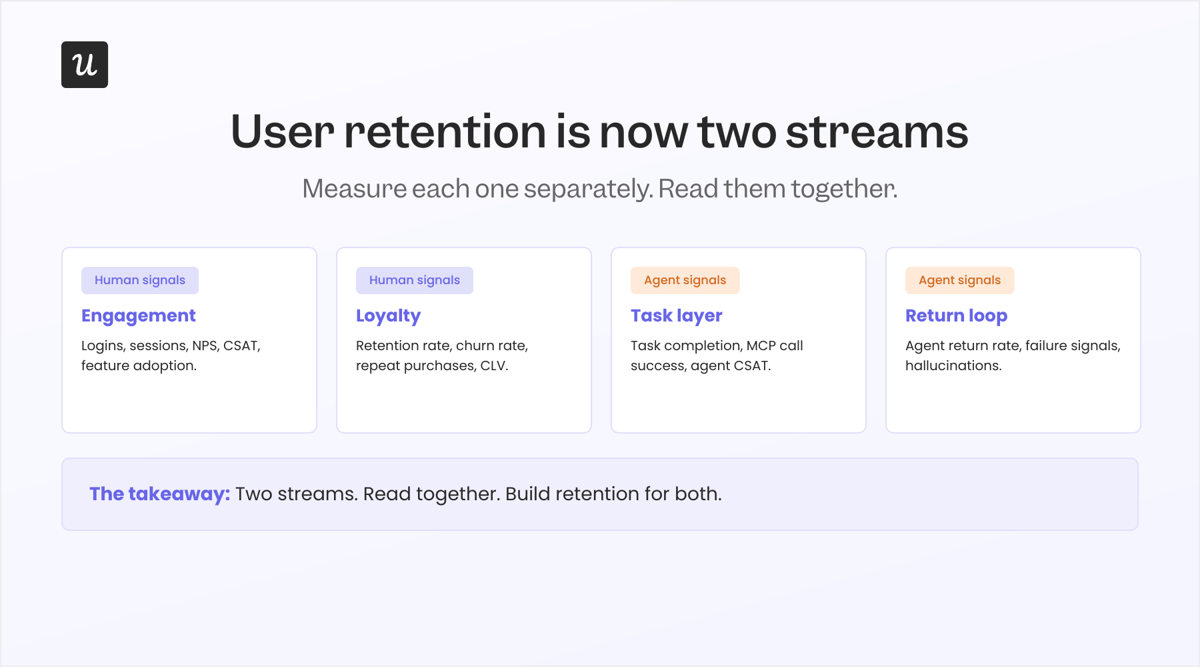
Stream one: Human signals
The stream every retention dashboard was built for has familiar metrics: logins, sessions, time on platform, feature adoption, NPS, CSAT, retention rate, churn rate. The classic loop: a user signs up, gets onboarded, hits activation, builds a habit, expands, advocates. Cohort analysis tracks how each group of new users behaves over time. Repeat purchases tell you the product is sticky. High retention here means you’re winning with humans.
This stream still matters. Most of your customer lifetime value still comes from humans who are genuinely happy with the experience, and satisfaction still drives whether they stay or leave. A smoother onboarding process still reduces early churn, particularly in the first 30 seconds when a new user is deciding whether to bother — Wyzowl once found that 8 in 10 people had deleted an app because they couldn’t figure out how to use it. Personalized in-app messages and behavior-triggered emails still bring people back. Surveys are still the cleanest way to understand why a cohort dropped off. None of that is going anywhere.
Stream two: Agent signals
The stream most teams have not started measuring yet is the one their forecasts will increasingly depend on.
Agents do not log in the way humans do. They authenticate once and then run, invisibly, without scrolling through your UI or triggering any of the session-length metrics your dashboard was built around. What they do instead is execute tasks, succeed or fail at them, and either return the next day or quietly stop. The signals that tell you which outcome you are heading toward are different from anything in a traditional retention stack.
Task completion rate is the closest thing agents have to an activation metric — did the agent actually finish what it set out to do? Agent return rate is the equivalent of repeat purchases, telling you whether the agent keeps coming back to your product or has started routing through a competitor’s MCP server instead. MCP call success tracks whether requests are landing at all, because an agent that receives 401 errors for three consecutive days is an agent that is about to be replaced. Some platforms now expose satisfaction-rate data at the individual agent interaction level, which Userpilot’s Agent Analytics tracks for accounts that ship agents. And then there are failure signals — hallucinations, ambiguous instructions, retried calls — each of which is a retention risk dressed up as a quality problem.
This is where Userpilot’s MCP Server changes the math. When an agent runs through MCP, you get visibility into what it asked for, what it received, and whether the task was completed, which is the closest thing agent interactions have to a session replay. As Yazan put it: “We will power all of that for your AI agent. As teams start deploying their own AI agents, those agents tap on our existing infrastructure that powers all of the usage and product data.”
The retention question for agent signals is not whether the user came back. It is whether the task got done, and whether the agent returned for the next one. That shift in framing changes which metric you watch, and it changes what you do when something breaks.
Reading both streams together
This is where most teams will struggle in 2026, and the reason is structural rather than strategic. The two streams can diverge for the same account at the same time, and a single rolled-up number will not show you that it is happening. Humans can be deeply engaged while agents are silently failing. Agents can be running smoothly while human users drift toward disengagement. A retention dashboard built around one “active users” figure hides exactly the signal you need to act on either problem.
The teams that get this right will build retention reporting that segments users by type, measures each stream against its own set of metrics, and fires interventions against whichever stream is showing strain. The teams that do not will eventually find the divergence, but they will find it at renewal, when the conversation is already about whether to stay rather than how to succeed.
The user retention metrics that still matter (and two that are starting to break)
Here are the retention metrics worth your time in 2026, with a short explanation of each:
- User retention rate: The percentage of users who stay active over a given period. The formula: ((users at end of period minus new users acquired) divided by users at start of period) times 100. Every cohort analysis is built on this number, and every retention conversation starts here.
- User churn rate: The mirror metric. The percentage of users who stopped engaging within a set timeframe, calculated as lost users divided by starting users times 100. High churn almost always points to something broken in onboarding or activation. Segmenting it by plan, persona, acquisition channel, or agent versus human is how you find where.
- Cohort analysis: Groups users by a shared characteristic — sign-up date, plan, acquisition channel, whether they have an agent in production — and tracks how each group retains over time. The method that separates “our product is getting worse” from “this quarter’s signups came in through a different channel.”
- Customer retention rate: The percentage of paying customers who remain subscribed across a period. In B2B, watch this alongside user retention rate rather than instead of it.
- NRR and GRR: The numbers your CFO and investors care about. NRR above 100% means existing customers are expanding faster than others are churning, which is what sustainable growth actually looks like. Top SaaS performers push NRR above 120%. Among AI-native companies, ChartMogul’s recent AI Churn Wave report shows median GRR climbing from 27% in January to 40% in September last year.
- Customer lifetime value: The dollar value of an average customer over their time with you, and the number most retention strategies are ultimately optimizing for. Retained users make repeat purchases, expand seats, and refer the next cohort. Acquiring a new customer costs five to 25 times more than keeping an existing one, per Harvard Business Review research, which is why fixing retention nearly always has a better return than increasing acquisition spend.
- Day-N retention curves: A curve that bends and flattens rather than dropping toward zero tells you the product has a habit loop. Cross-app benchmarks show average retention falling from around 25% on Day 1 to under 6% by Day 30. Any curve that flattens above zero before that point is worth paying attention to.
Not every metric that built its reputation in the last decade has kept pace with how products are actually being used. Two metrics still appear in nearly every retention guide on the internet. Both deserve a second look.
- DAU/MAU ratio: Still the standard stickiness metric, but increasingly misleading in agent-heavy accounts. DAU can hold steady while an agent is doing the actual work once a week and a human checks the result on Friday. The metric was built on the assumption that frequent visits equal ongoing value. That assumption breaks the moment agents do the work and humans only review the output.
- Session length: Long sessions used to mean engaged users. In 2026 they can mean confused users trying to fix what an agent just broke, or they can be replaced entirely by 30-second agent runs that deliver more value than a 45-minute human session. Session length stopped being a clean signal somewhere around the time MCP arrived. Most teams have not updated their dashboards to reflect that yet.
How to measure user retention (and read the data once you have it)
Measuring user retention effectively is a three-layer process: data collection, diagnosis and action. Most teams have layer one and call themselves done. The real work starts in second and third steps.
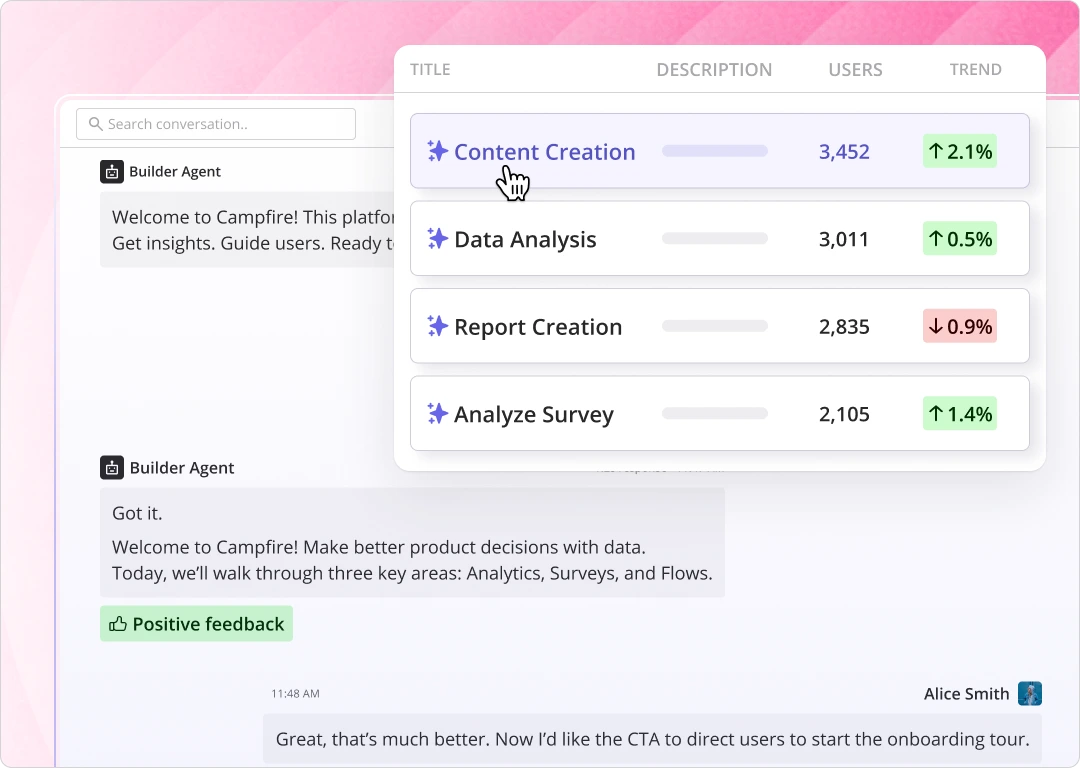
Step 1: Collect the right data
The easy layer. Set up your event taxonomy, track key actions, capture user properties. Auto-capture handles most of the front-end interaction data. For anything tracked on the backend, pass it as a custom event. Yazan again: “Setting up your events and your user properties is not very difficult. It takes maybe a few days, sometimes a week. That is not the hard part.”
![]()
For the agent stream, your event taxonomy needs to grow. Track the MCP calls themselves, the tasks the agents complete, and the user-on-behalf-of relationship (which human a given agent is serving). Without this, you cannot do segmentation between human users and agent users later.
Step 2: Diagnose the collected data
This is the hard one. You have the data. You need to understand why a cohort is dropping, not just that it is. The diagnostic triage that works:
- Funnels show you where retention breaks: Where in the user journey are users dropping off? Sign-up to first action? First action to second session? Activation to habit?
- Session replay shows you why: Once you know the where, replay the actual sessions of the users who dropped. Watch what they hit, what they ignored, what confused them.
- Surveys close the loop with the user’s own words: The session replay tells you what happened. The survey tells you what the user thought was happening. Both together are how you go from “feature unused” to “feature misunderstood, here is the fix.”
Abrar, one of our PMs, ran this exact triage on an email feature last quarter. The funnel showed drop-off at a specific step. Session replay showed the users were not noticing the setup option. He shipped an in-app checklist fix the same day, no engineering ticket required. Retention on that cohort recovered within the week. That is the speed the diagnostic triage gives you when it is wired together properly.
Step 3: Take action to improve user retention
Once the diagnosis is in, the action is usually one of three things:
- An in-app message at the moment of drop-off.
- A behavior-triggered email or push notification to re-engage inactive users.
- A structural change to the user journey itself.
The right communication strategies are behavior-triggered, not time-triggered. A user who has not opened the app in seven days does not need a generic “we miss you” email. They need an in-app message tied to the next action that gets them value.
This is also where Userpilot Workflows enters the narrative. Behavior triggers (a missed key action, an inactive user, a survey response below a threshold) fire workflows that orchestrate in-app messages, email, and mobile push together. The retention question is no longer “what should we send?” It is “what should fire, to whom, in which channel, in response to which signal?” Workflows answers that without code.
From operator to monitor: How AI agents are changing the retention workflow
This is where the post turns from “what retention is” to “what retention looks like when the team running it has its own AI agent.” We have spent the last six months rebuilding this workflow inside Userpilot, and the shape of the change is worth describing in detail because it applies to any product team in 2026.
The legacy retention workflow is, frankly, exhausting. You collect data. You build reports. You build dashboards on top of the reports. You monitor the dashboards. You spot a drop. You investigate the drop. You form a hypothesis. You build a flow or a campaign to fix the drop. You wait. You measure. You iterate. Every step happens in a different tool, and the work compounds as the product team ships more features.
This is what Yazan calls the operator workflow. You, the human, are doing the work. The tools are passive surfaces you visit one at a time.
“The future does not look like that,” he told us. “People do not want to do any of this. What we shifted towards is the approach where you literally do not need to do anything. You go, you create a project, you tell it what you want, and it does the rest. You change from an operator to monitoring.”
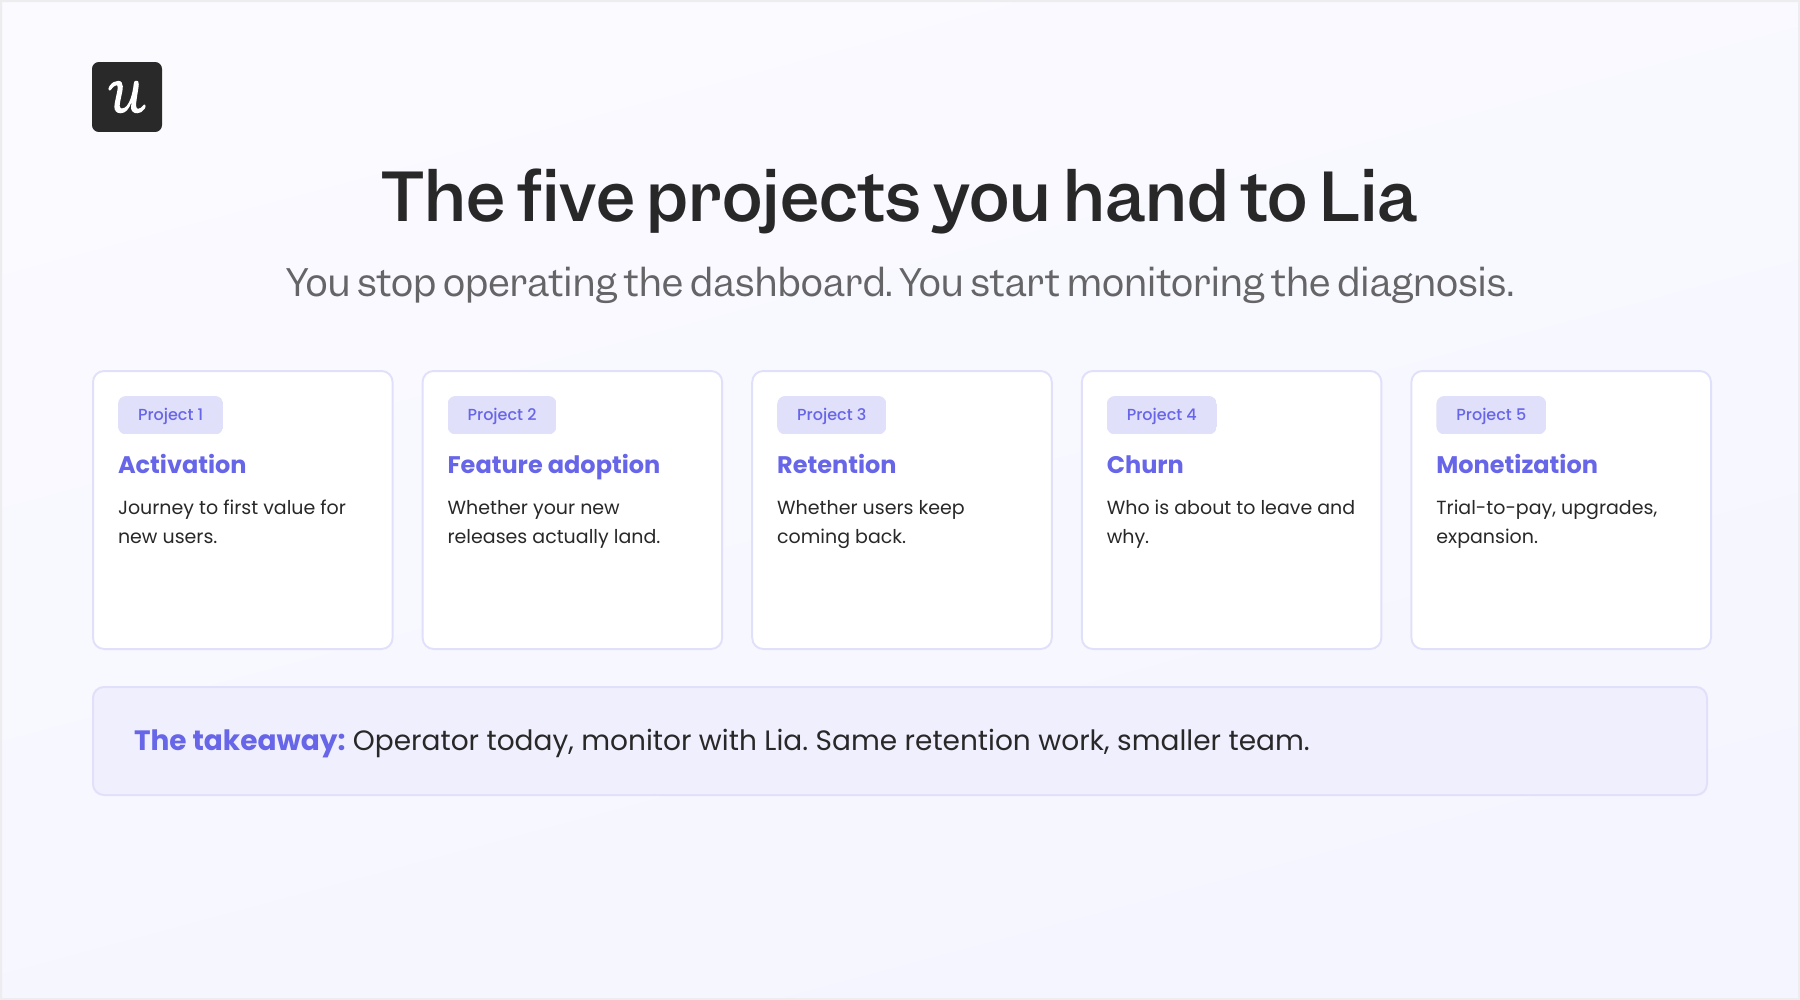
The five projects you can hand to Lia map directly onto the retention lifecycle:
- User Activation (the journey to first value)
- Feature Adoption (whether new releases land)
- User Retention (whether users keep coming back)
- Churn (who is about to leave and why)
- Monetization (trial-to-pay, upgrades, expansion)
For each one, Lia pulls the data, builds the reports and dashboards on its own, runs predictive models, and surfaces the actionable insight. You read the insight, you decide whether to act, you ship the in-app intervention if you do.
The churn project is the one that hits retention work hardest. Six months before renewal, Lia can flag the accounts most likely to churn, based on auto-captured product usage, NPS and survey data, and session replay. Three sources of data, one diagnosis, one recommendation. The CS team gets a list of accounts to save and a reason for each one. The PM team gets a list of product-level fixes that would move the curve.
This is the operator-to-monitor shift in practice. You are no longer building the dashboard. You are reading the diagnosis and deciding what to do about it. The agent is operating. You are evaluating. That is a different job, and the teams that organize around it in 2026 will get more retention work done with smaller teams.
Where user retention is heading: MCP, agents, and the infrastructure question
Two trends will shape user retention work over the next 18 months. Both are worth pricing in now.
Agents become users you have to retain
The first trend: AI agents will increasingly be your highest-volume users. They will execute tasks, integrate your product or service into longer workflows, and either keep doing it or stop. Agent retention will become a discipline of its own. The metrics already exist (task completion, return rate, MCP call success, agent CSAT), and the tooling is catching up. Userpilot’s Agent Analytics exists specifically for this: agent usage reports, conversation logs, failure signals, satisfaction tracking, all in one place.
The teams that win agent retention will look at the same things they already look at for human retention. Activation (did the agent succeed on the first task?). Habit (is the agent coming back?). Expansion (is the agent doing more this month than last?). Different surface, same logic.
The retention conversation moves into the foundational model
The second trend is bigger and harder to see if you are not building for it. As MCP matures, the conversations that used to happen inside your product analytics tool are going to happen inside foundational models. A marketer asks Claude or ChatGPT about feature adoption. The model queries your product usage data through MCP. The answer comes back in chat, with no one ever opening your dashboard.
“We see Userpilot as becoming the infrastructure that powers your product usage data for that sort of system,” Yazan told us. The model gets the question. Userpilot serves the data. The retention conversation happens in the chat surface, not in the dashboard.
This changes what your retention stack has to be good at. The dashboard is no longer the destination. The dashboard is one consumer of the data. The MCP server is the other, and increasingly the more important one. If your retention analytics tool cannot serve clean, structured data to a foundational model on demand, your retention conversation is going to happen in a competitor’s chat window.
A practical user retention playbook for 2026
If you take only one thing from this post, take this section. The five steps that move user retention forward in 2026, regardless of the size of your team.
- Audit your event taxonomy for the agent stream: If you do not have task-completion events and an “agent or human” property on every session, your data layer is not 2026-ready. Fix this before you redesign any dashboard.
- Segment your existing retention reports by user type: Pull every retention chart you have and split it into human users versus agent users. The accounts where the two streams diverge are the ones that need attention first.
- Stop reporting DAU/MAU as your top-line retention metric: Move it down the dashboard. Promote task completion rate, key actions completed, and behavior-triggered re-engagement coverage to the top. Defend the change with the agent-account divergence data once you have it.
- Wire the diagnostic triage: Funnels for where, session replay for why, surveys for what the user thought. All three connected. Without this, you are guessing why retention is dropping.
- Hand the monitoring work to an agent: The five-project Lia model (activation, feature adoption, retention, churn, monetization) is one way to do this. The pattern is more important than the specific tool: you are reading the diagnosis, not building it.
None of this is a one-quarter project. The teams that start now will compound. The teams that wait will discover the agent stream the way most teams discover problems: at the next renewal call.
Drive user retention for humans today, agents tomorrow
The two pressures this post opened with, shipping velocity and the agentic shift, are not getting easier. They are getting harder. Every quarter, your engineering team ships more features. Every quarter, more of your customers integrate AI agents into their workflows. The retention model you used in 2022 is going to keep working slightly less well, until one renewal cycle it stops working at all.
Two streams, read together. Human signals and agent signals, segmented by user type, diagnosed by funnels and replay and surveys, acted on through behavior-triggered workflows and the right communication strategies, monitored by an agent so you can spend your time on the decisions that matter. That is the user retention model that holds up in 2026, and the one that will drive retention and sustainable growth for the teams that adopt it early.
If you want to see what this looks like in a single platform that meets user expectations for both humans and agents, that is what we have been building. Get a Userpilot demo and we will walk you through it on your own product data.
About the author