Userpilot for New Customer Onboarding: Features, Pricing, and Review


What is Userpilot?
Userpilot is a product growth platform that drives user activation, feature adoption, and expansion revenue. It also helps product teams collect user feedback, streamline onboarding, and gather actionable insights from analytics.
With Userpilot, you’ll be able to track both product usage and user behavior to get a holistic view of how customers use your product — which will guide future development, improve the user experience, and inform your growth efforts.
Must have features of new customer onboarding tools
Before selecting your ideal new customer onboarding solution, it’s essential to ensure it encompasses a range of must-have features that will set the stage for successful user adoption. Here’s what you should be looking for
- Ability to create no-code microsurveys for gathering customer information that can be used for various purposes such as segmentation, product improvements, etc.
- User segmentation that allows you to categorize your new customers based on factors such as company size, user roles, jobs to be done, behaviors, etc. so you can offer personalized experiences.
- Ability to create interactive and engaging onboarding flows that guide users through essential features and actions.
- Features for creating and triggering tooltips and in-app guidance to provide contextual assistance by explaining specific elements or actions within your product.
- Options to build onboarding checklists to help new customers keep track of essential tasks and milestones, ensuring they make the most of your product.
Userpilot features for new customer onboarding
User onboarding is a crucial part of the customer journey as it speeds up the adoption process and increases retention rates. Onboarding is one of Userpilot’s core use cases along with product growth analytics and user feedback, so it has plenty of features that you can utilize.
Here are some Userpilot features you can use when onboarding new users:
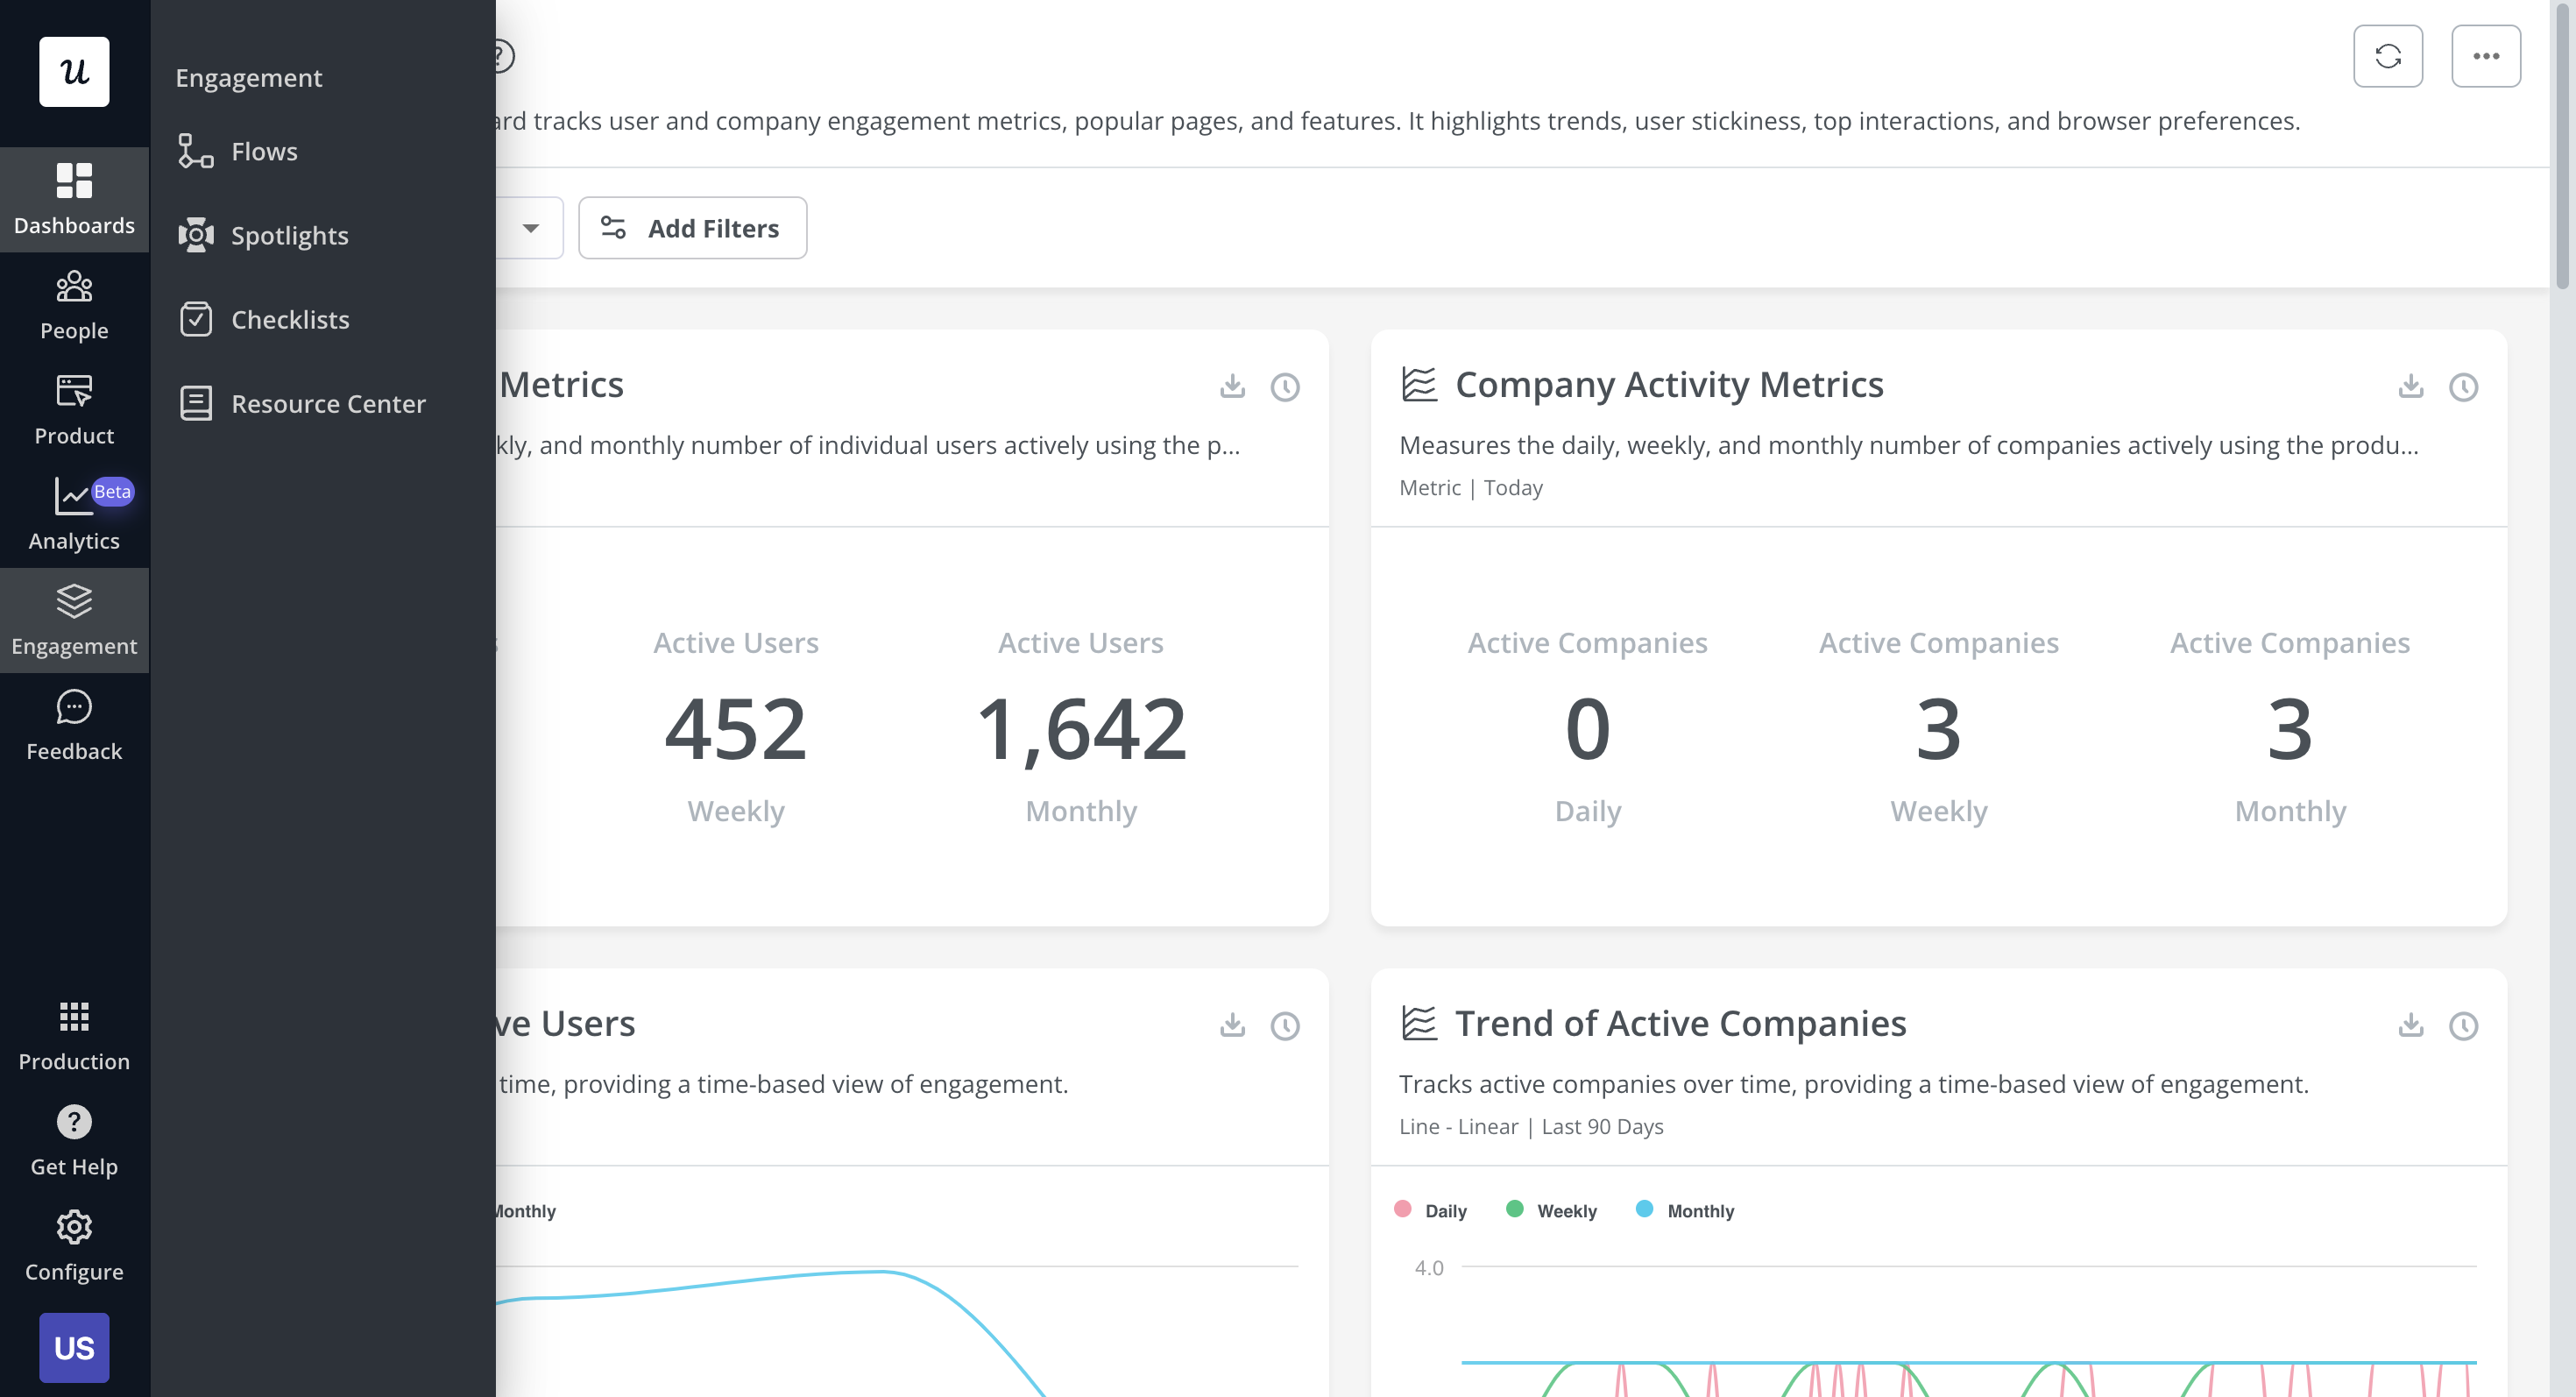
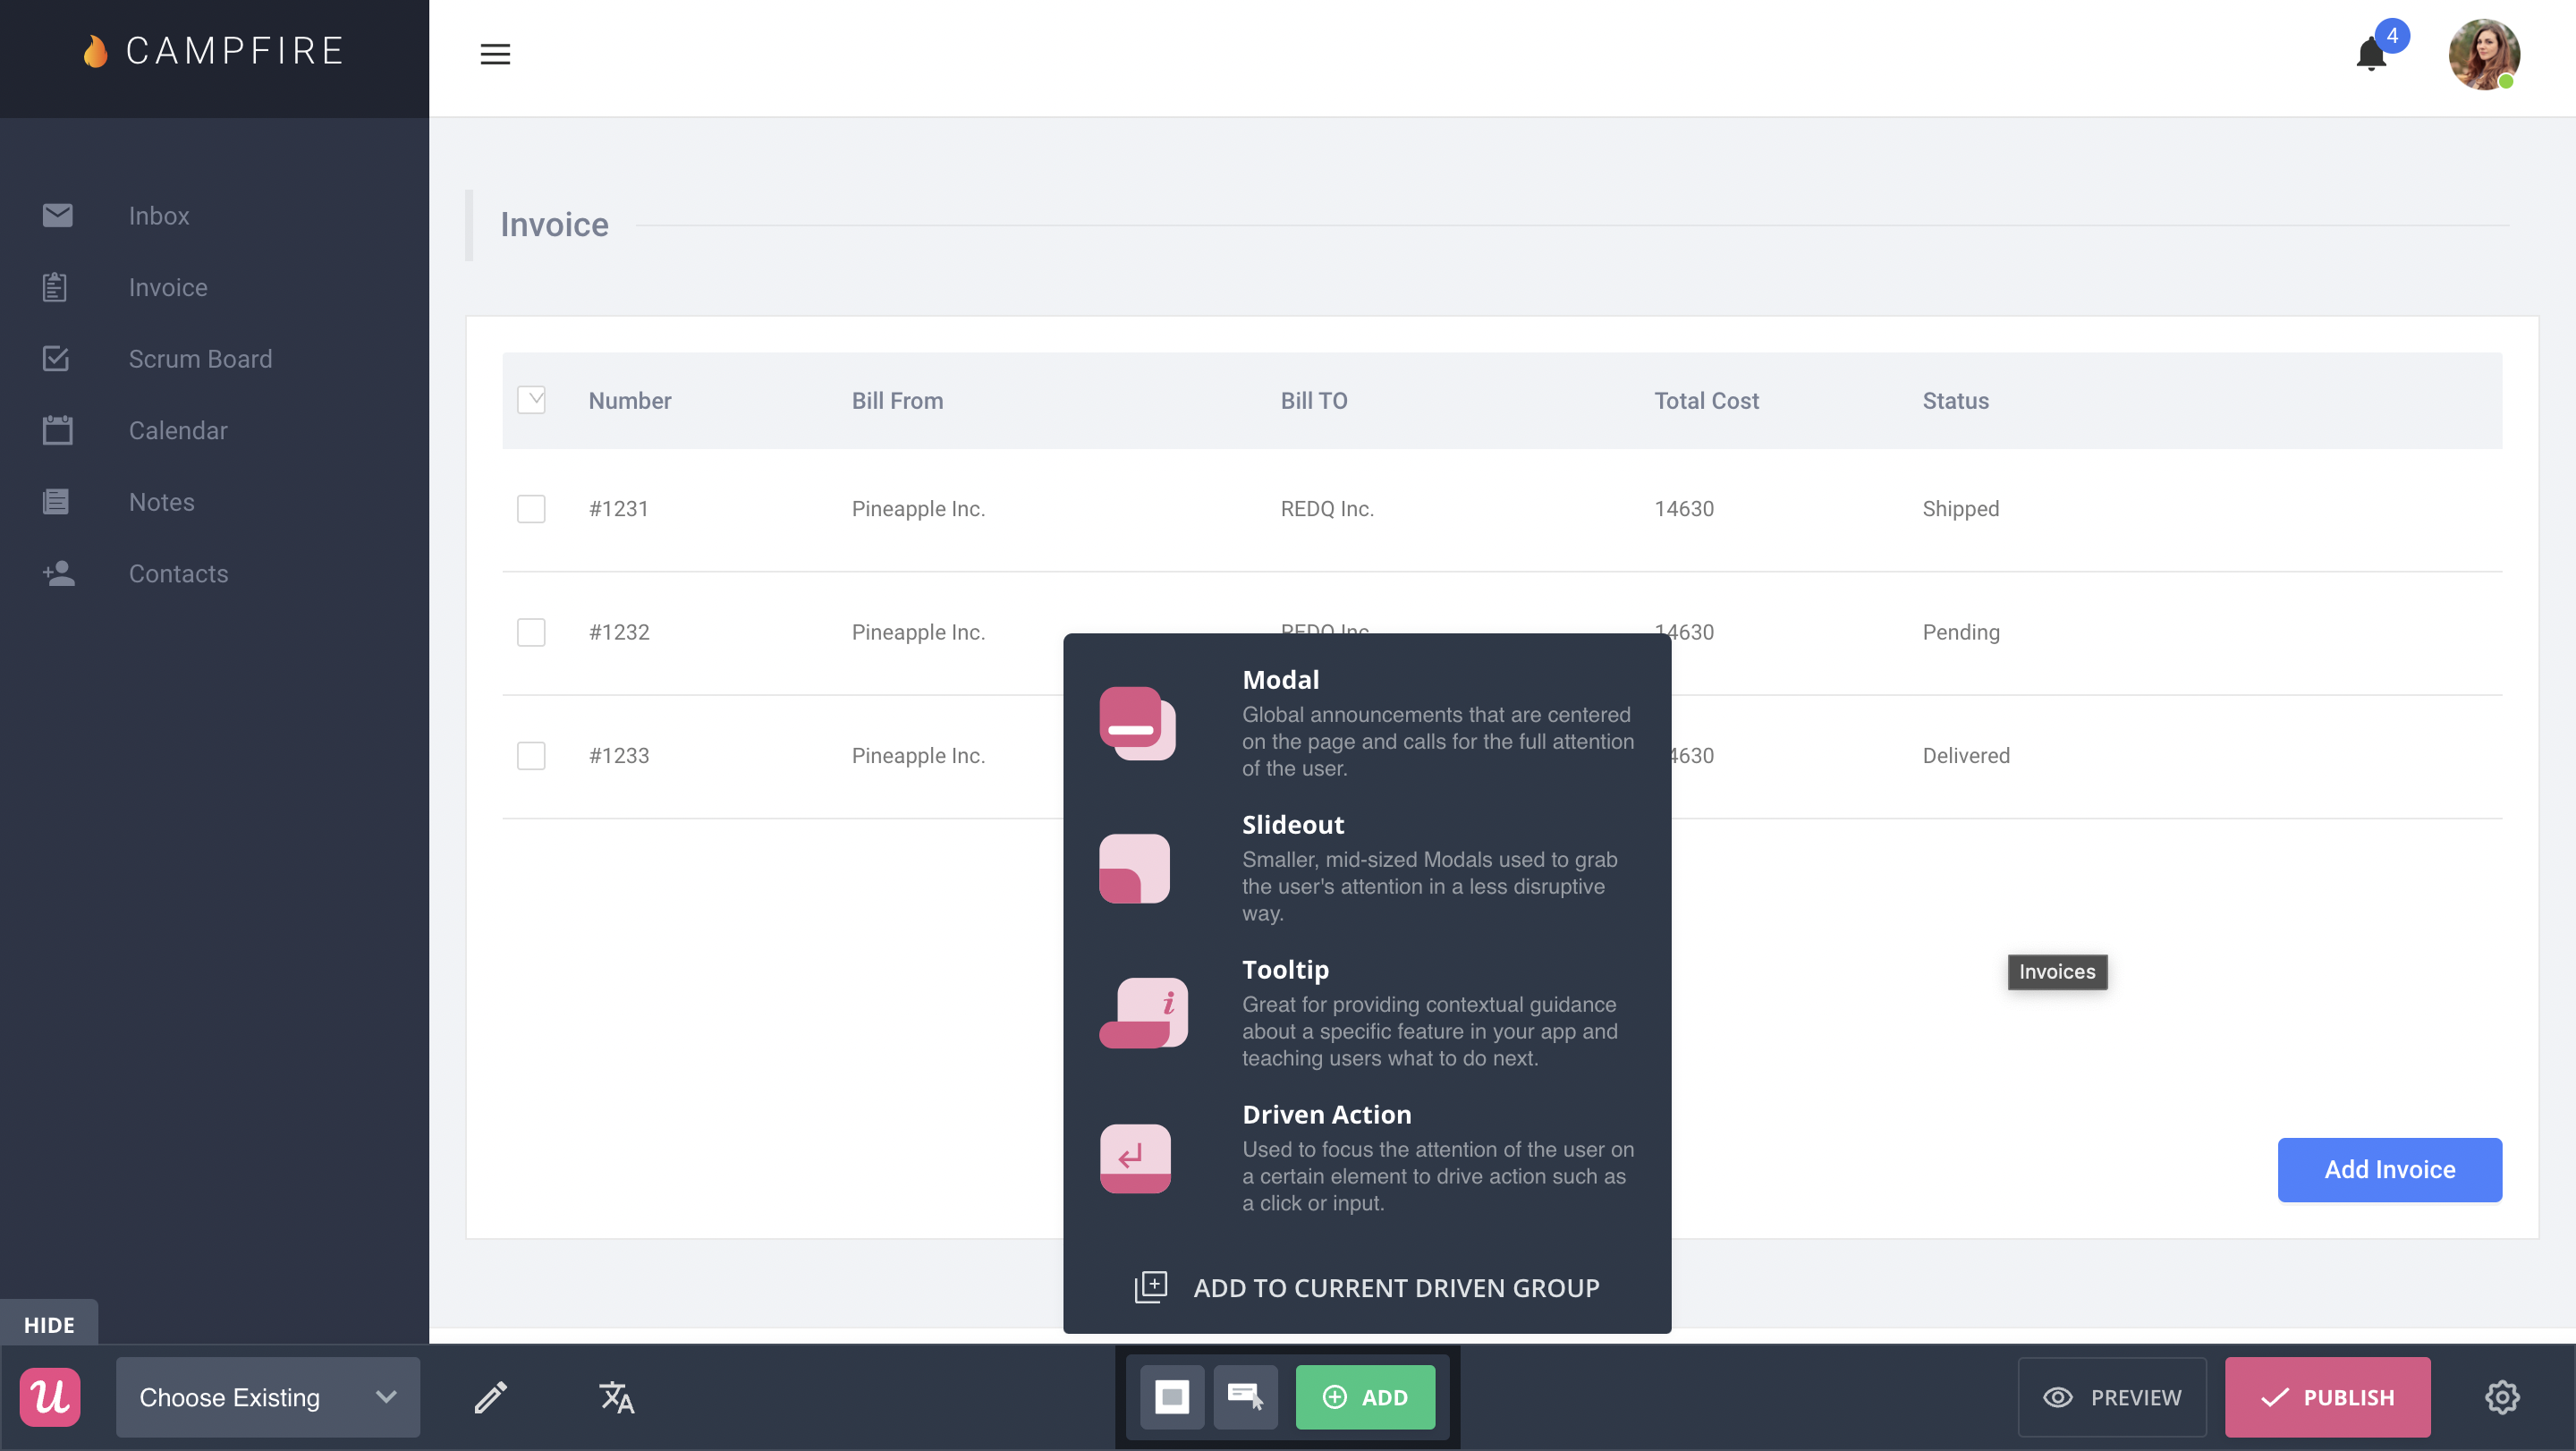
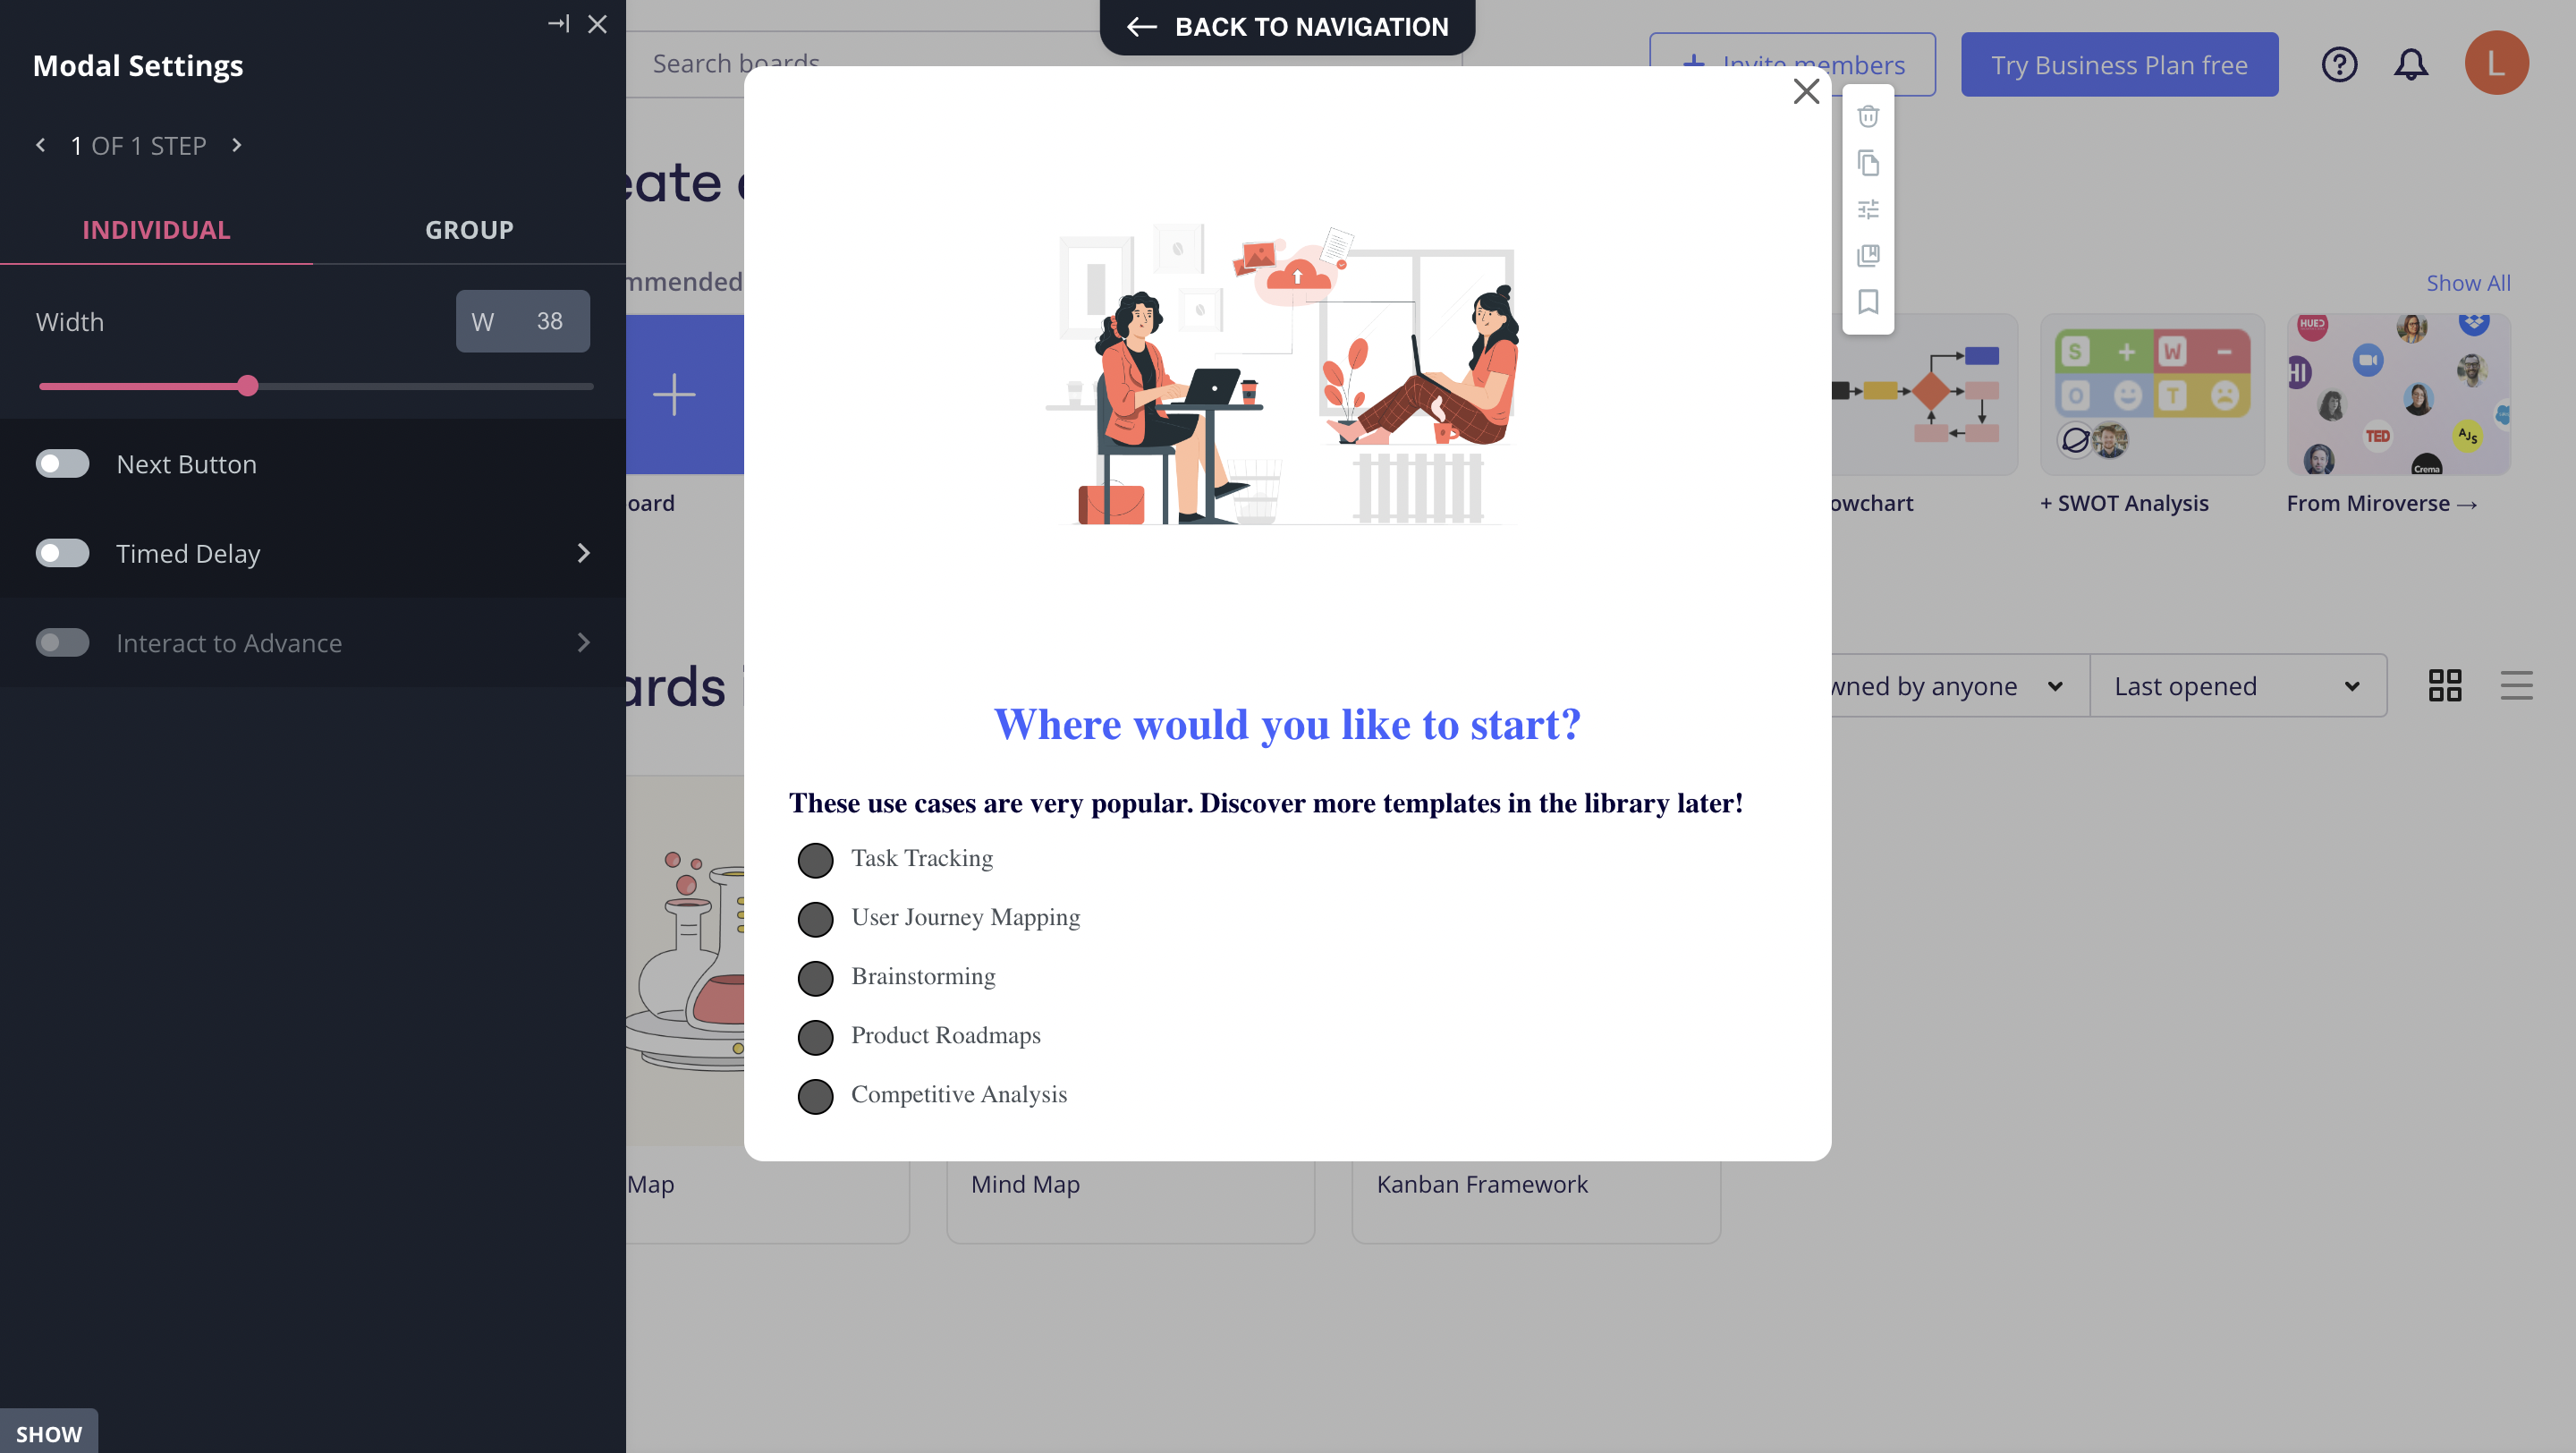
- No-code builder: Creating flows with Userpilot is as simple as installing the Chrome extension, selecting the UI patterns you’d like to use, and then editing the content/settings to suit your use case. You can also use templates to create modals, slideouts, tooltips, and driven actions.
- Native tooltips: Userpilot lets you create native tooltips that show up when users hover over an element or click on an information badge. Since these native tooltips attach to the element itself, they aren’t page-dependent and will show up on any screen where that element is visible.
![]()
- Funnel analytics: Userpilot’s advanced analytics lets you create funnel reports that track the onboarding journey. You can also add filters (like name, user ID, signup date, operating system, country, etc.) and monitor the total conversion rate from the first step of the funnel to the last.
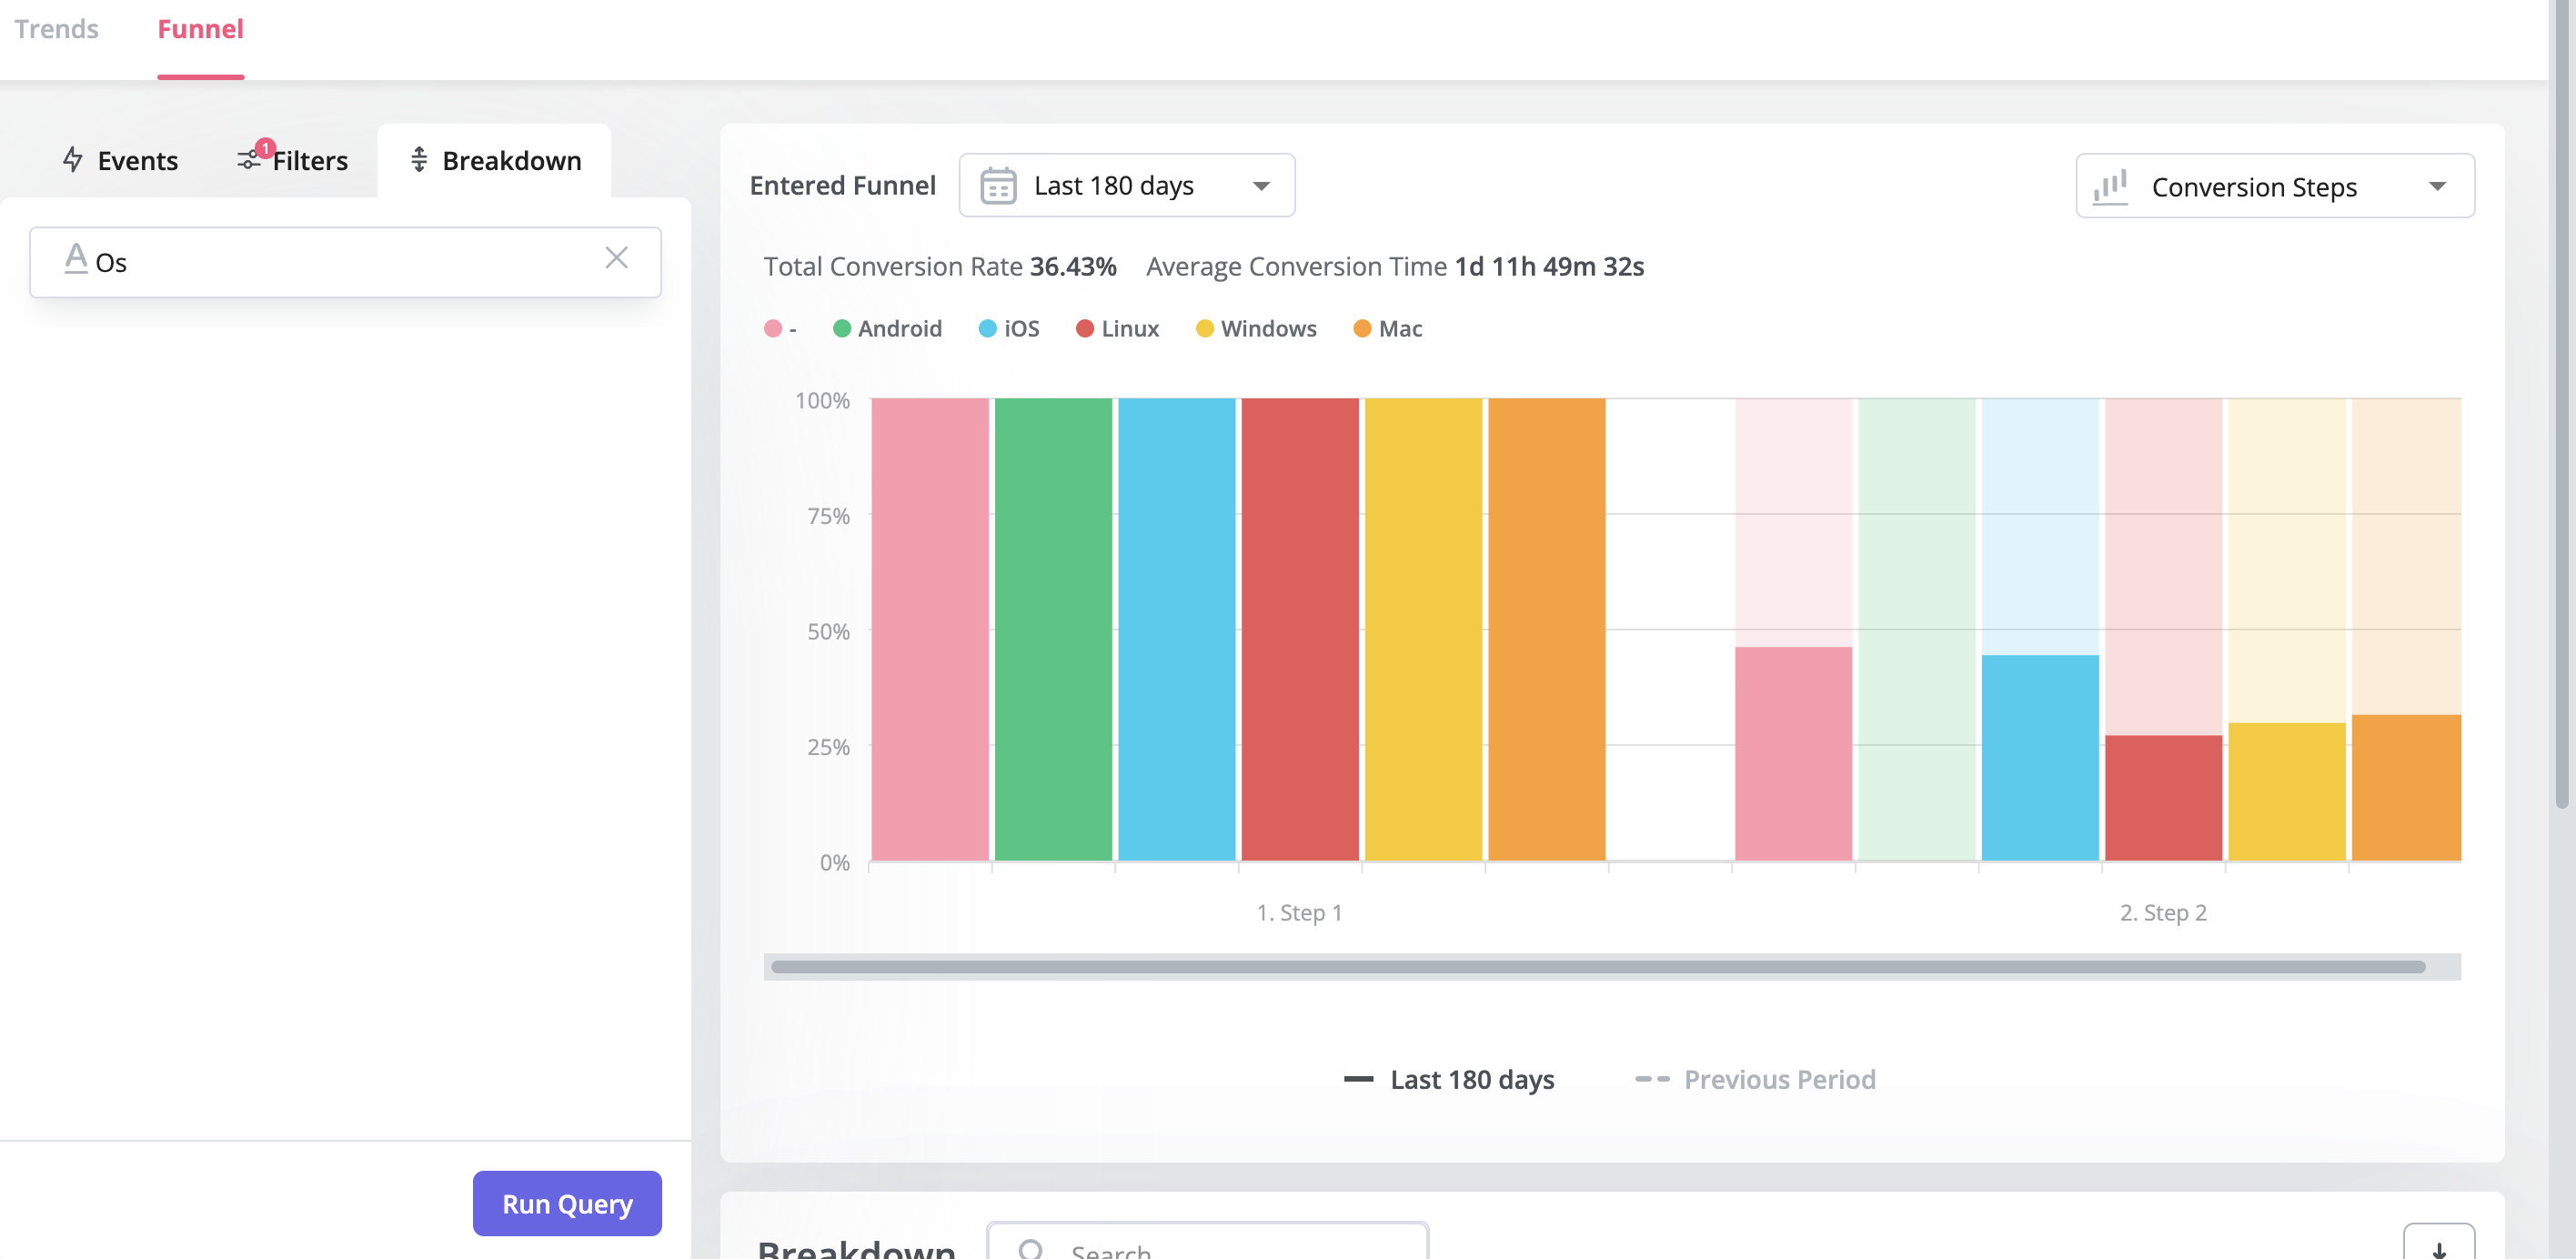
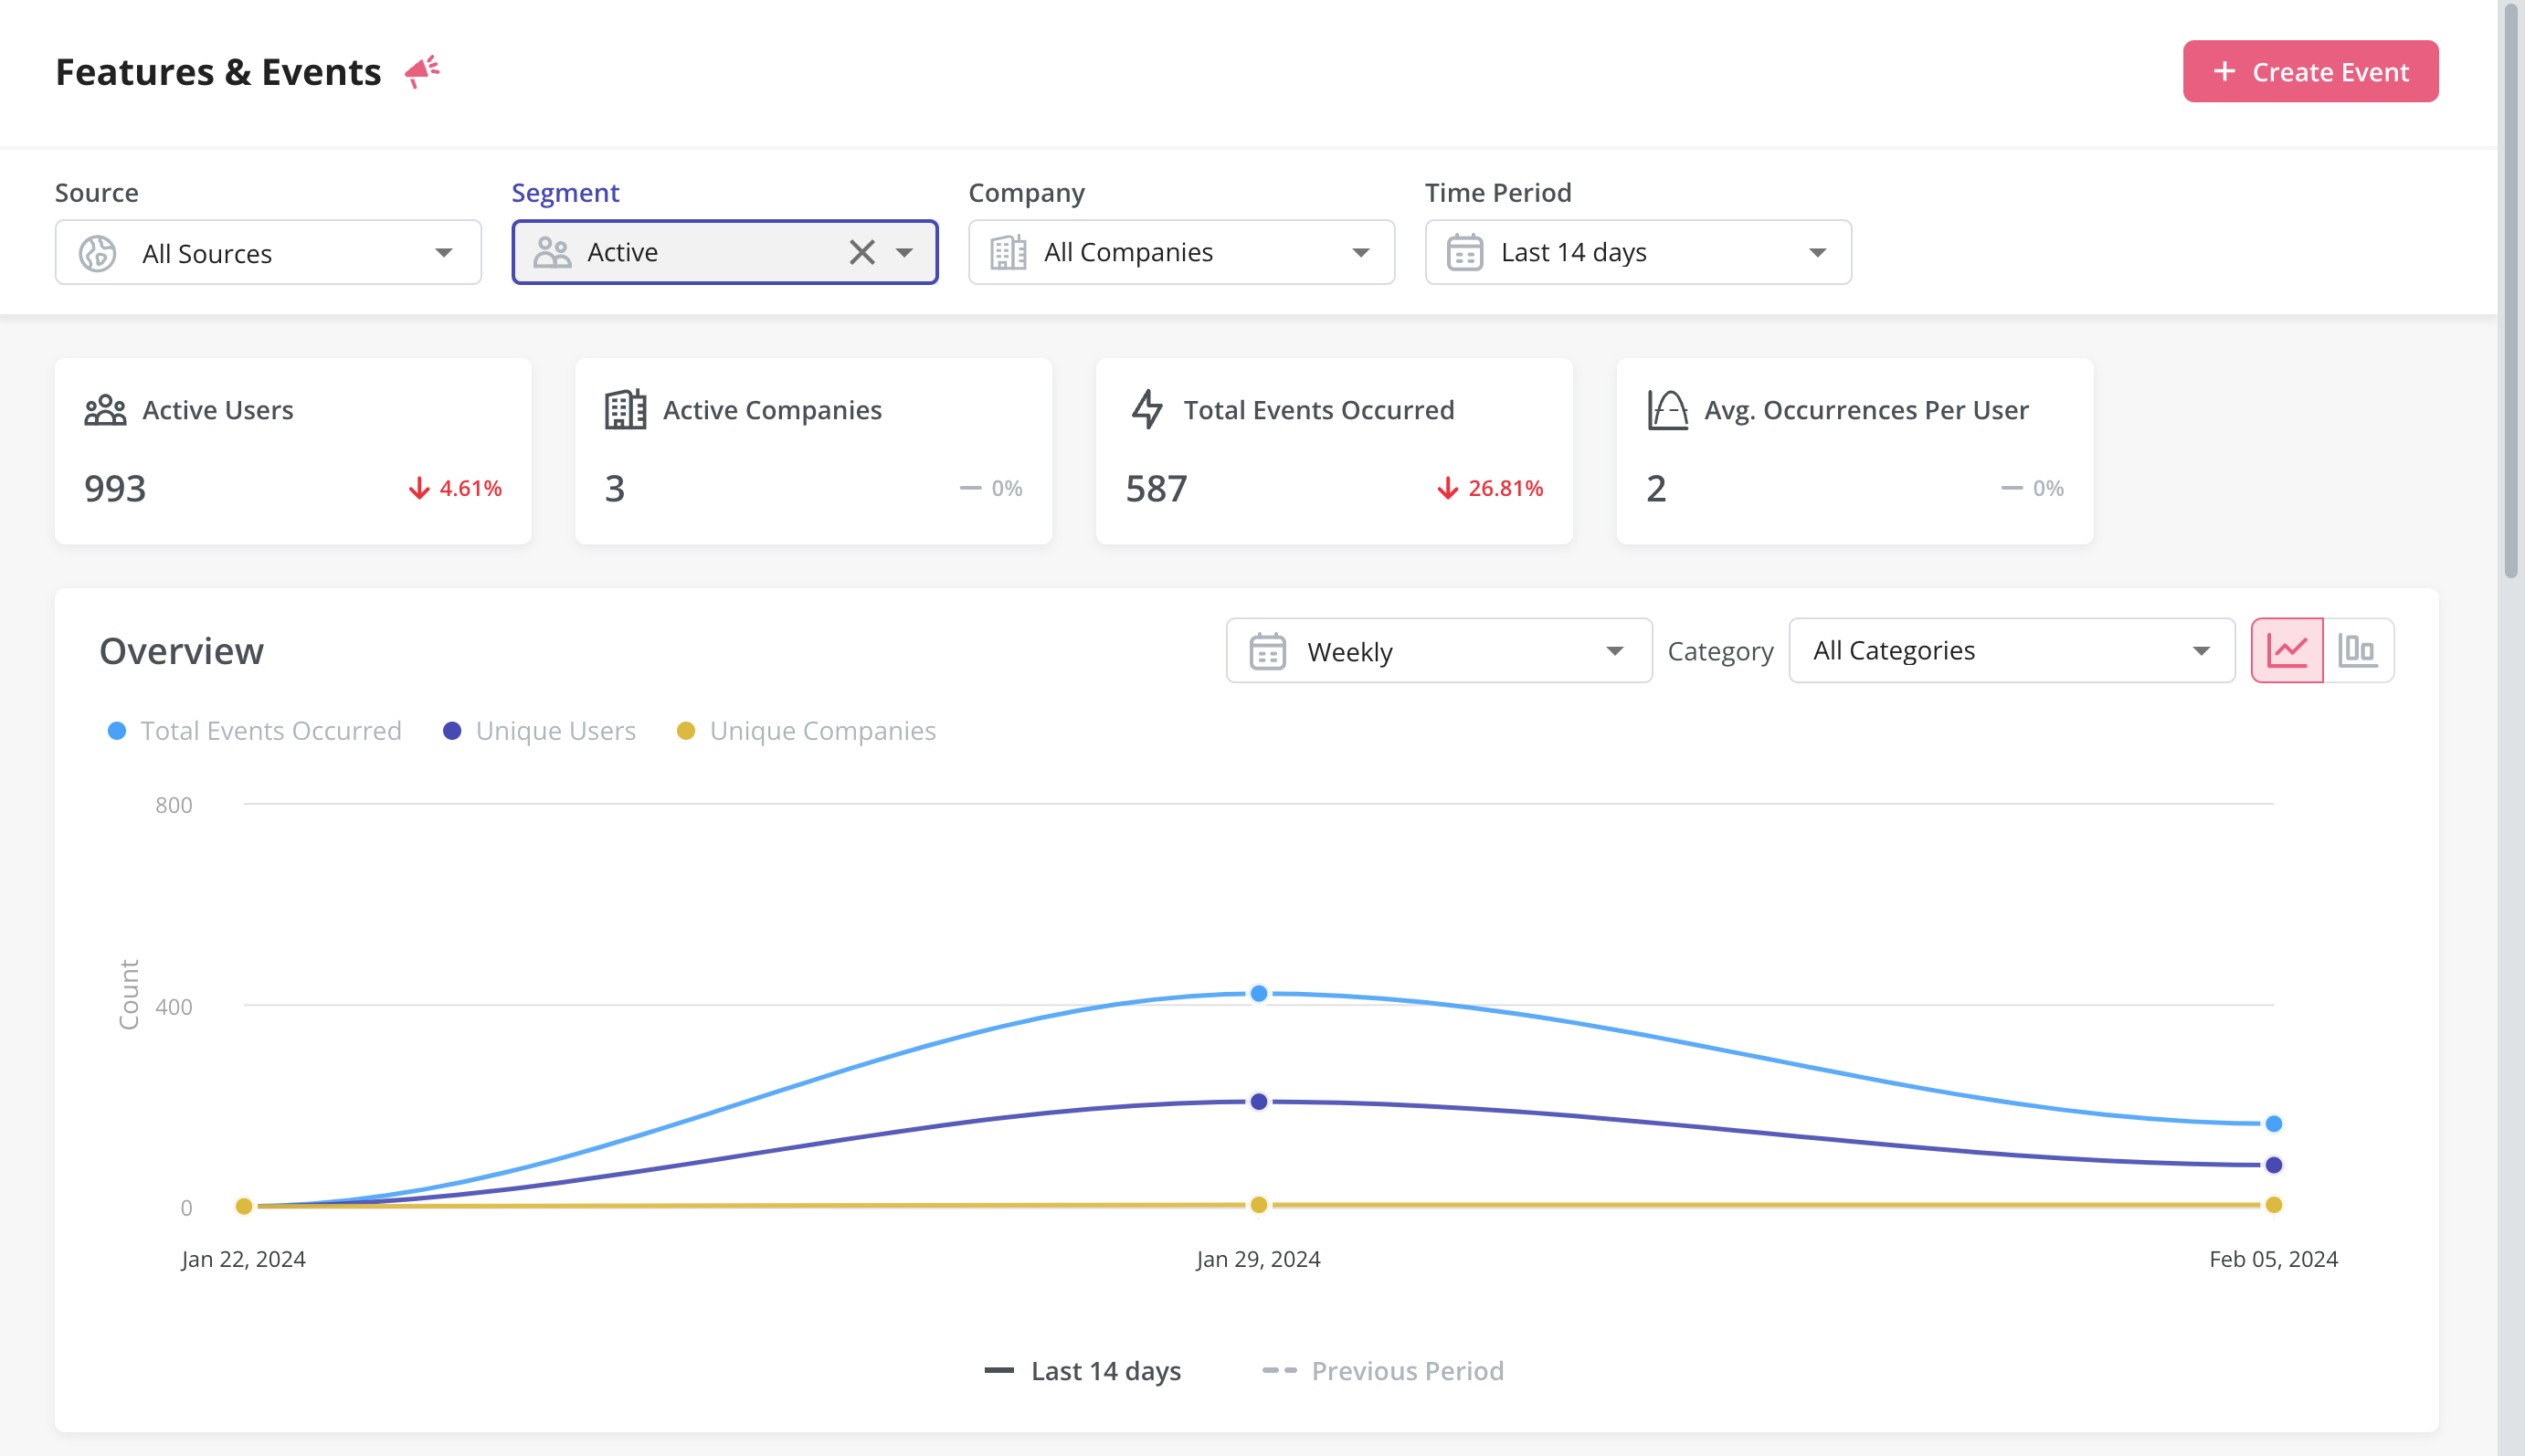
- User segmentation: Userpilot lets you segment users based on the device they’re using, where they’re located, their engagement data, or which NPS rating they selected on the latest survey. You can then filter your analytics dashboards to see which segments struggle with onboarding.
Userpilot’s user segmentation
User segmentation is essential for creating a personalized and contextual onboarding experience. Userpilot can segment users based on demographics, product usage data, NPS scores, and more. You can then trigger flows or filter analytics based on segments.
Here’s an overview of Userpilot’s customer segmentation capabilities:
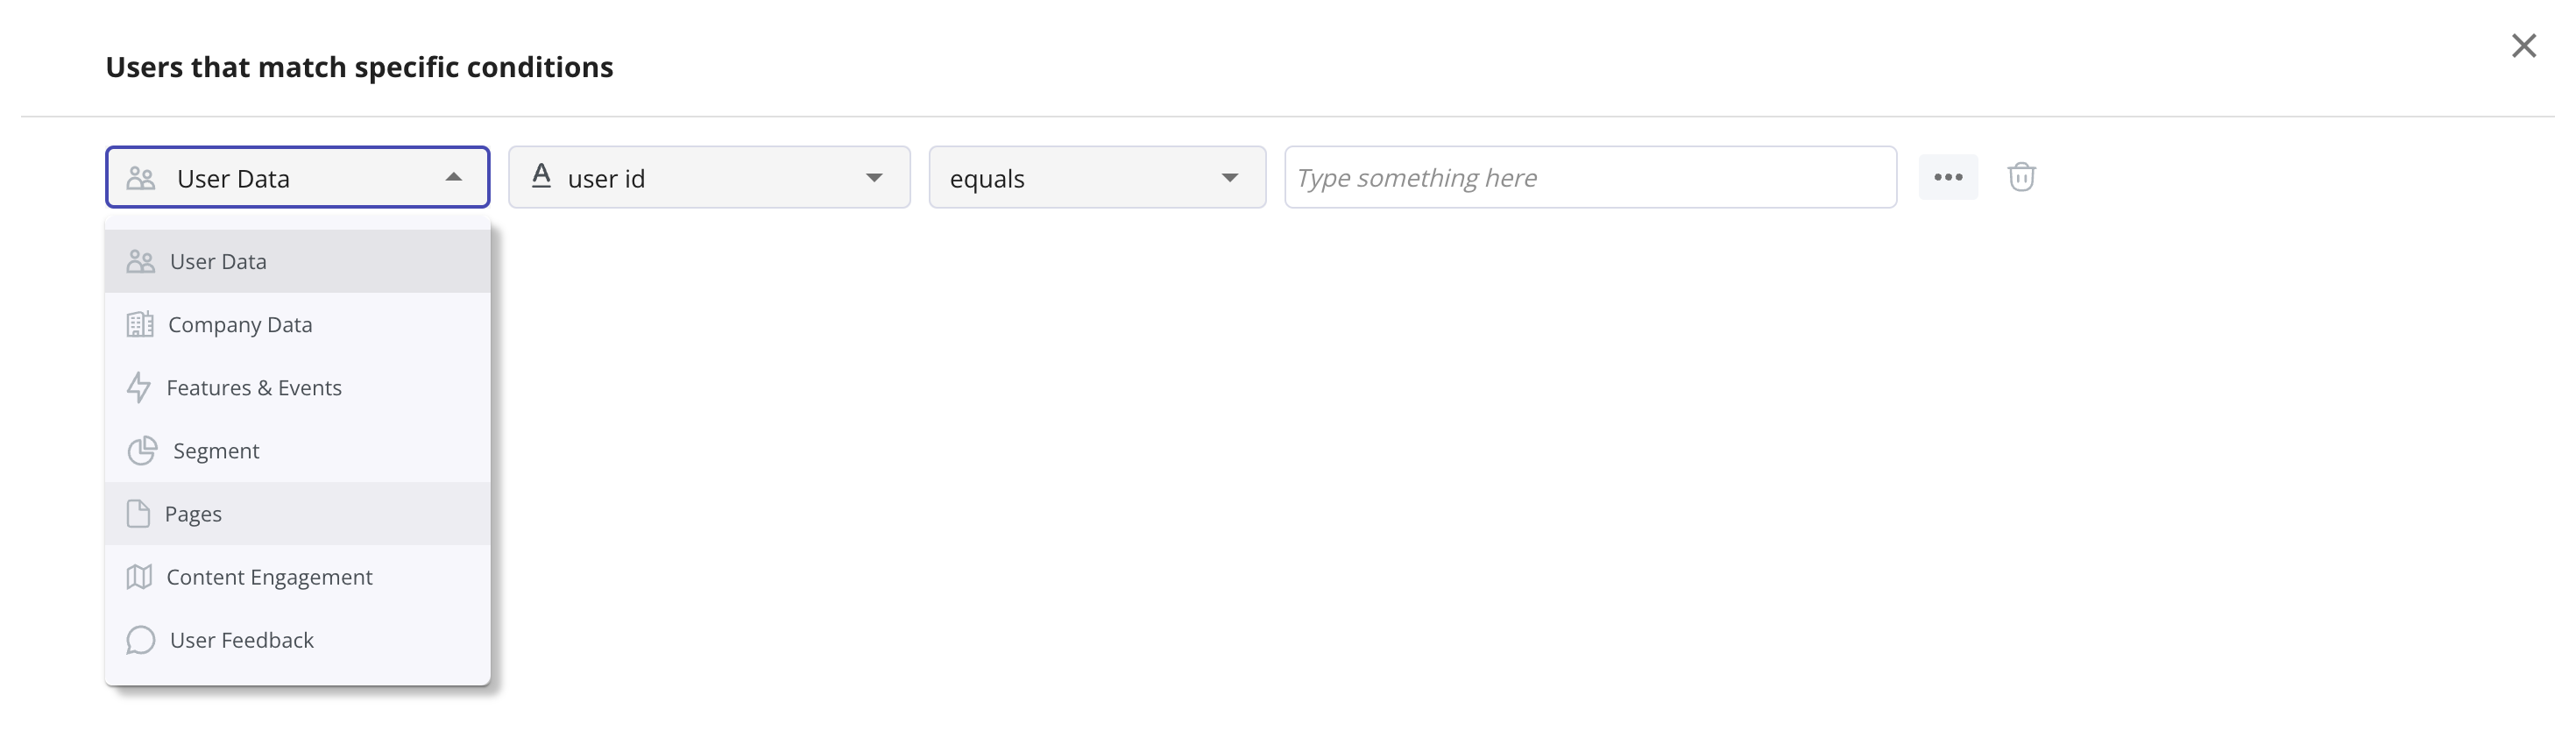
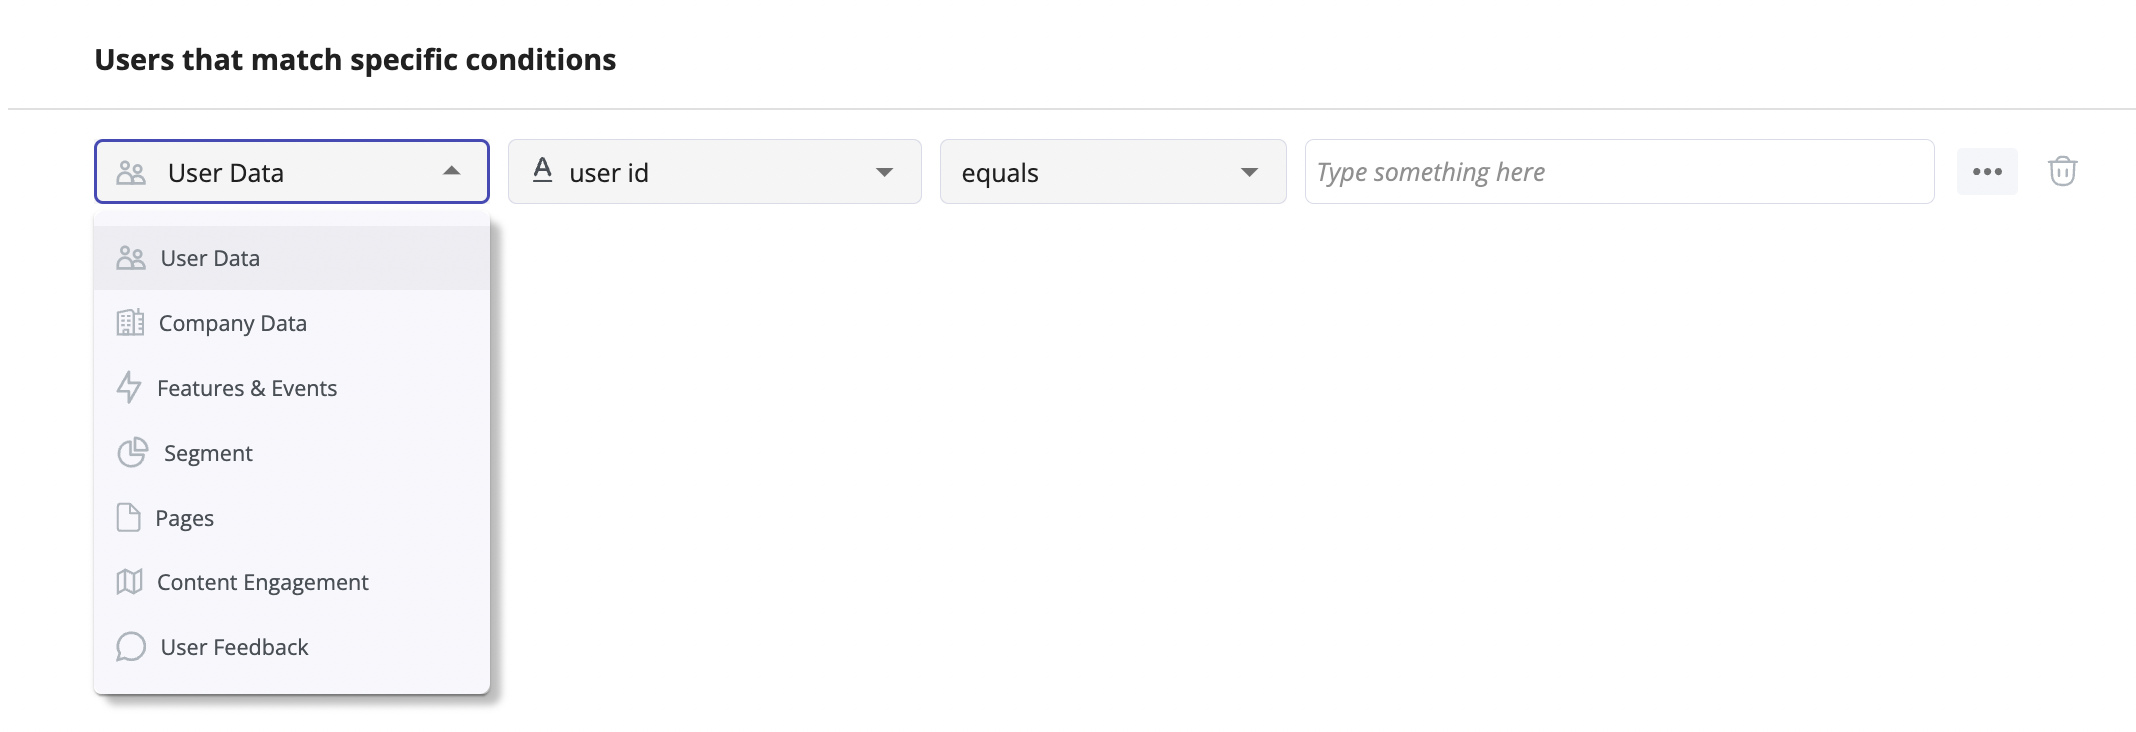
- Segment conditions: Userpilot lets you form segments by adding different conditions like user data, company data, features and events, etc. You can then use these segments as analytics filters or flow triggers later on.
- Analytics filters: Userpilot’s product analytics and user insights dashboards can be filtered to only display data from specific segments (or companies). This will help you extract insights from certain cohorts and compare how adoption or activation varies from one segment to the next.
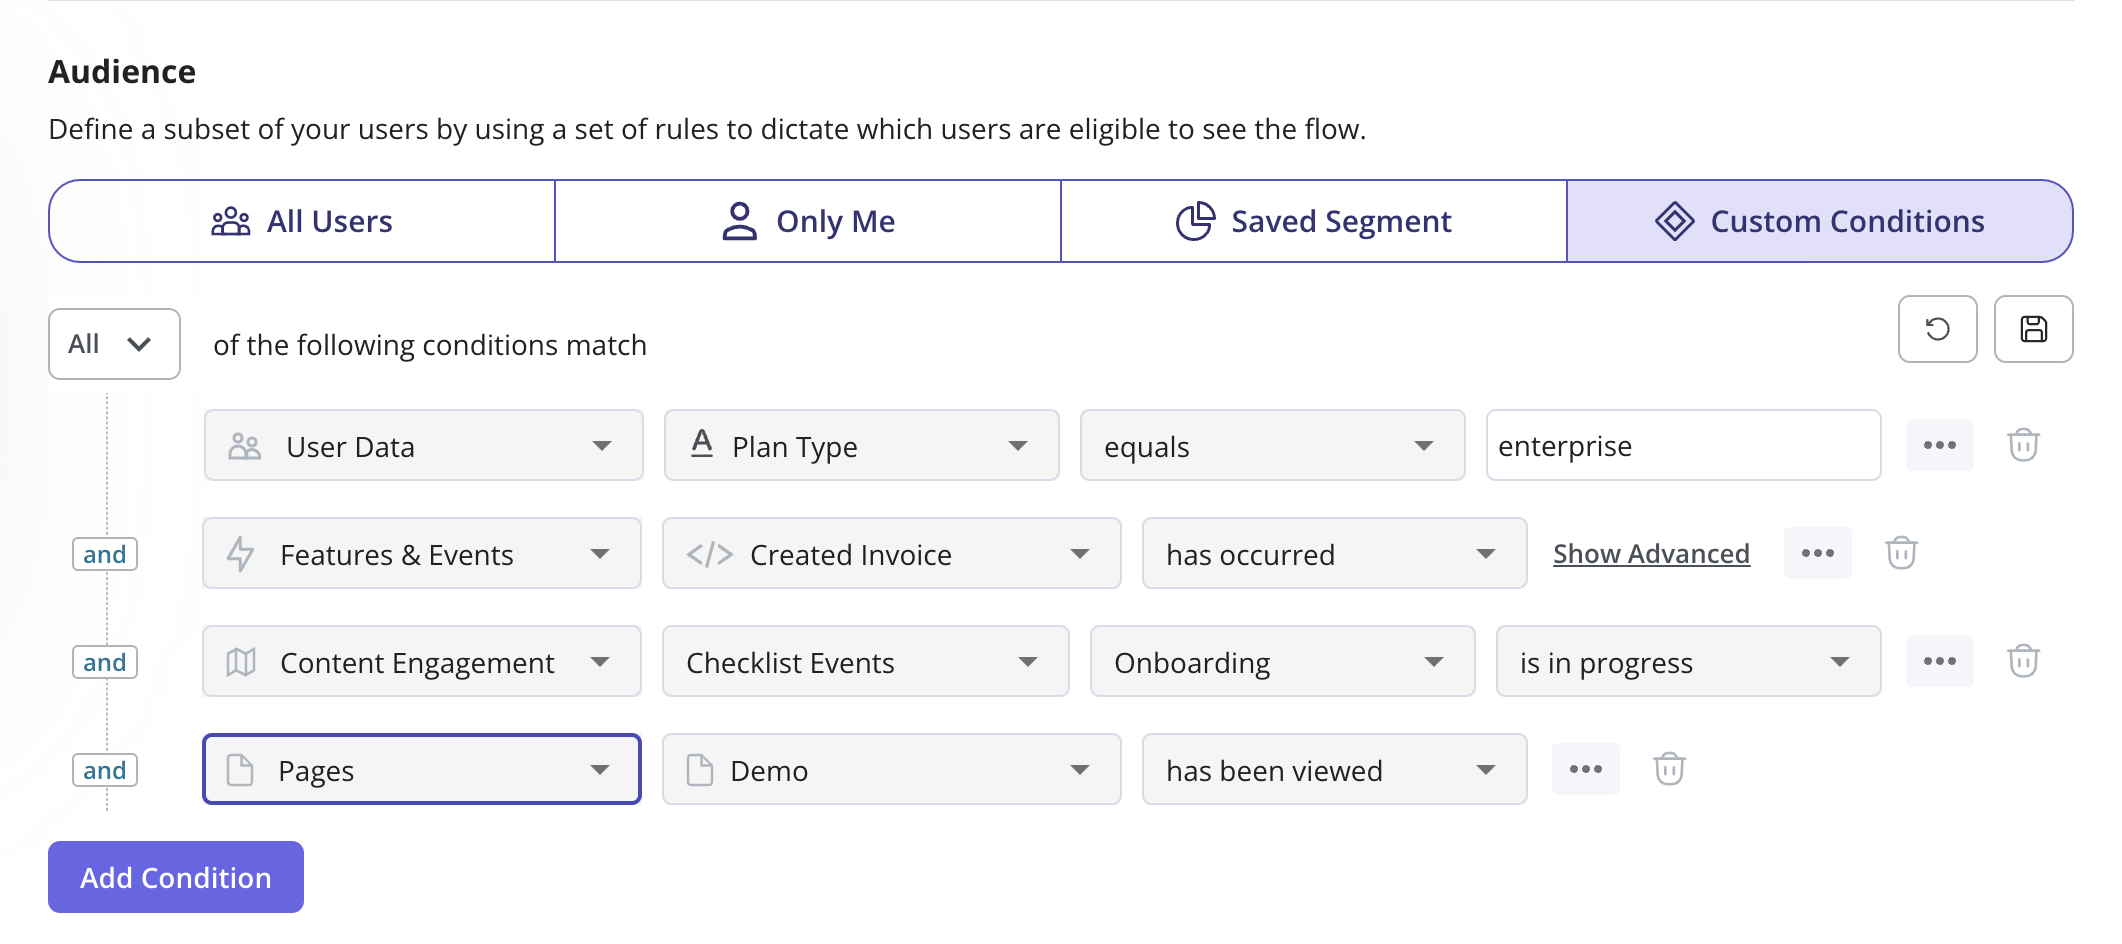
- Flow triggers: Userpilot’s audience settings let you trigger flows for specific segments or target users that meet certain conditions. You can combine this with page-specific or event-occurrence triggers to show relevant flows to the right users at the most contextual moments.
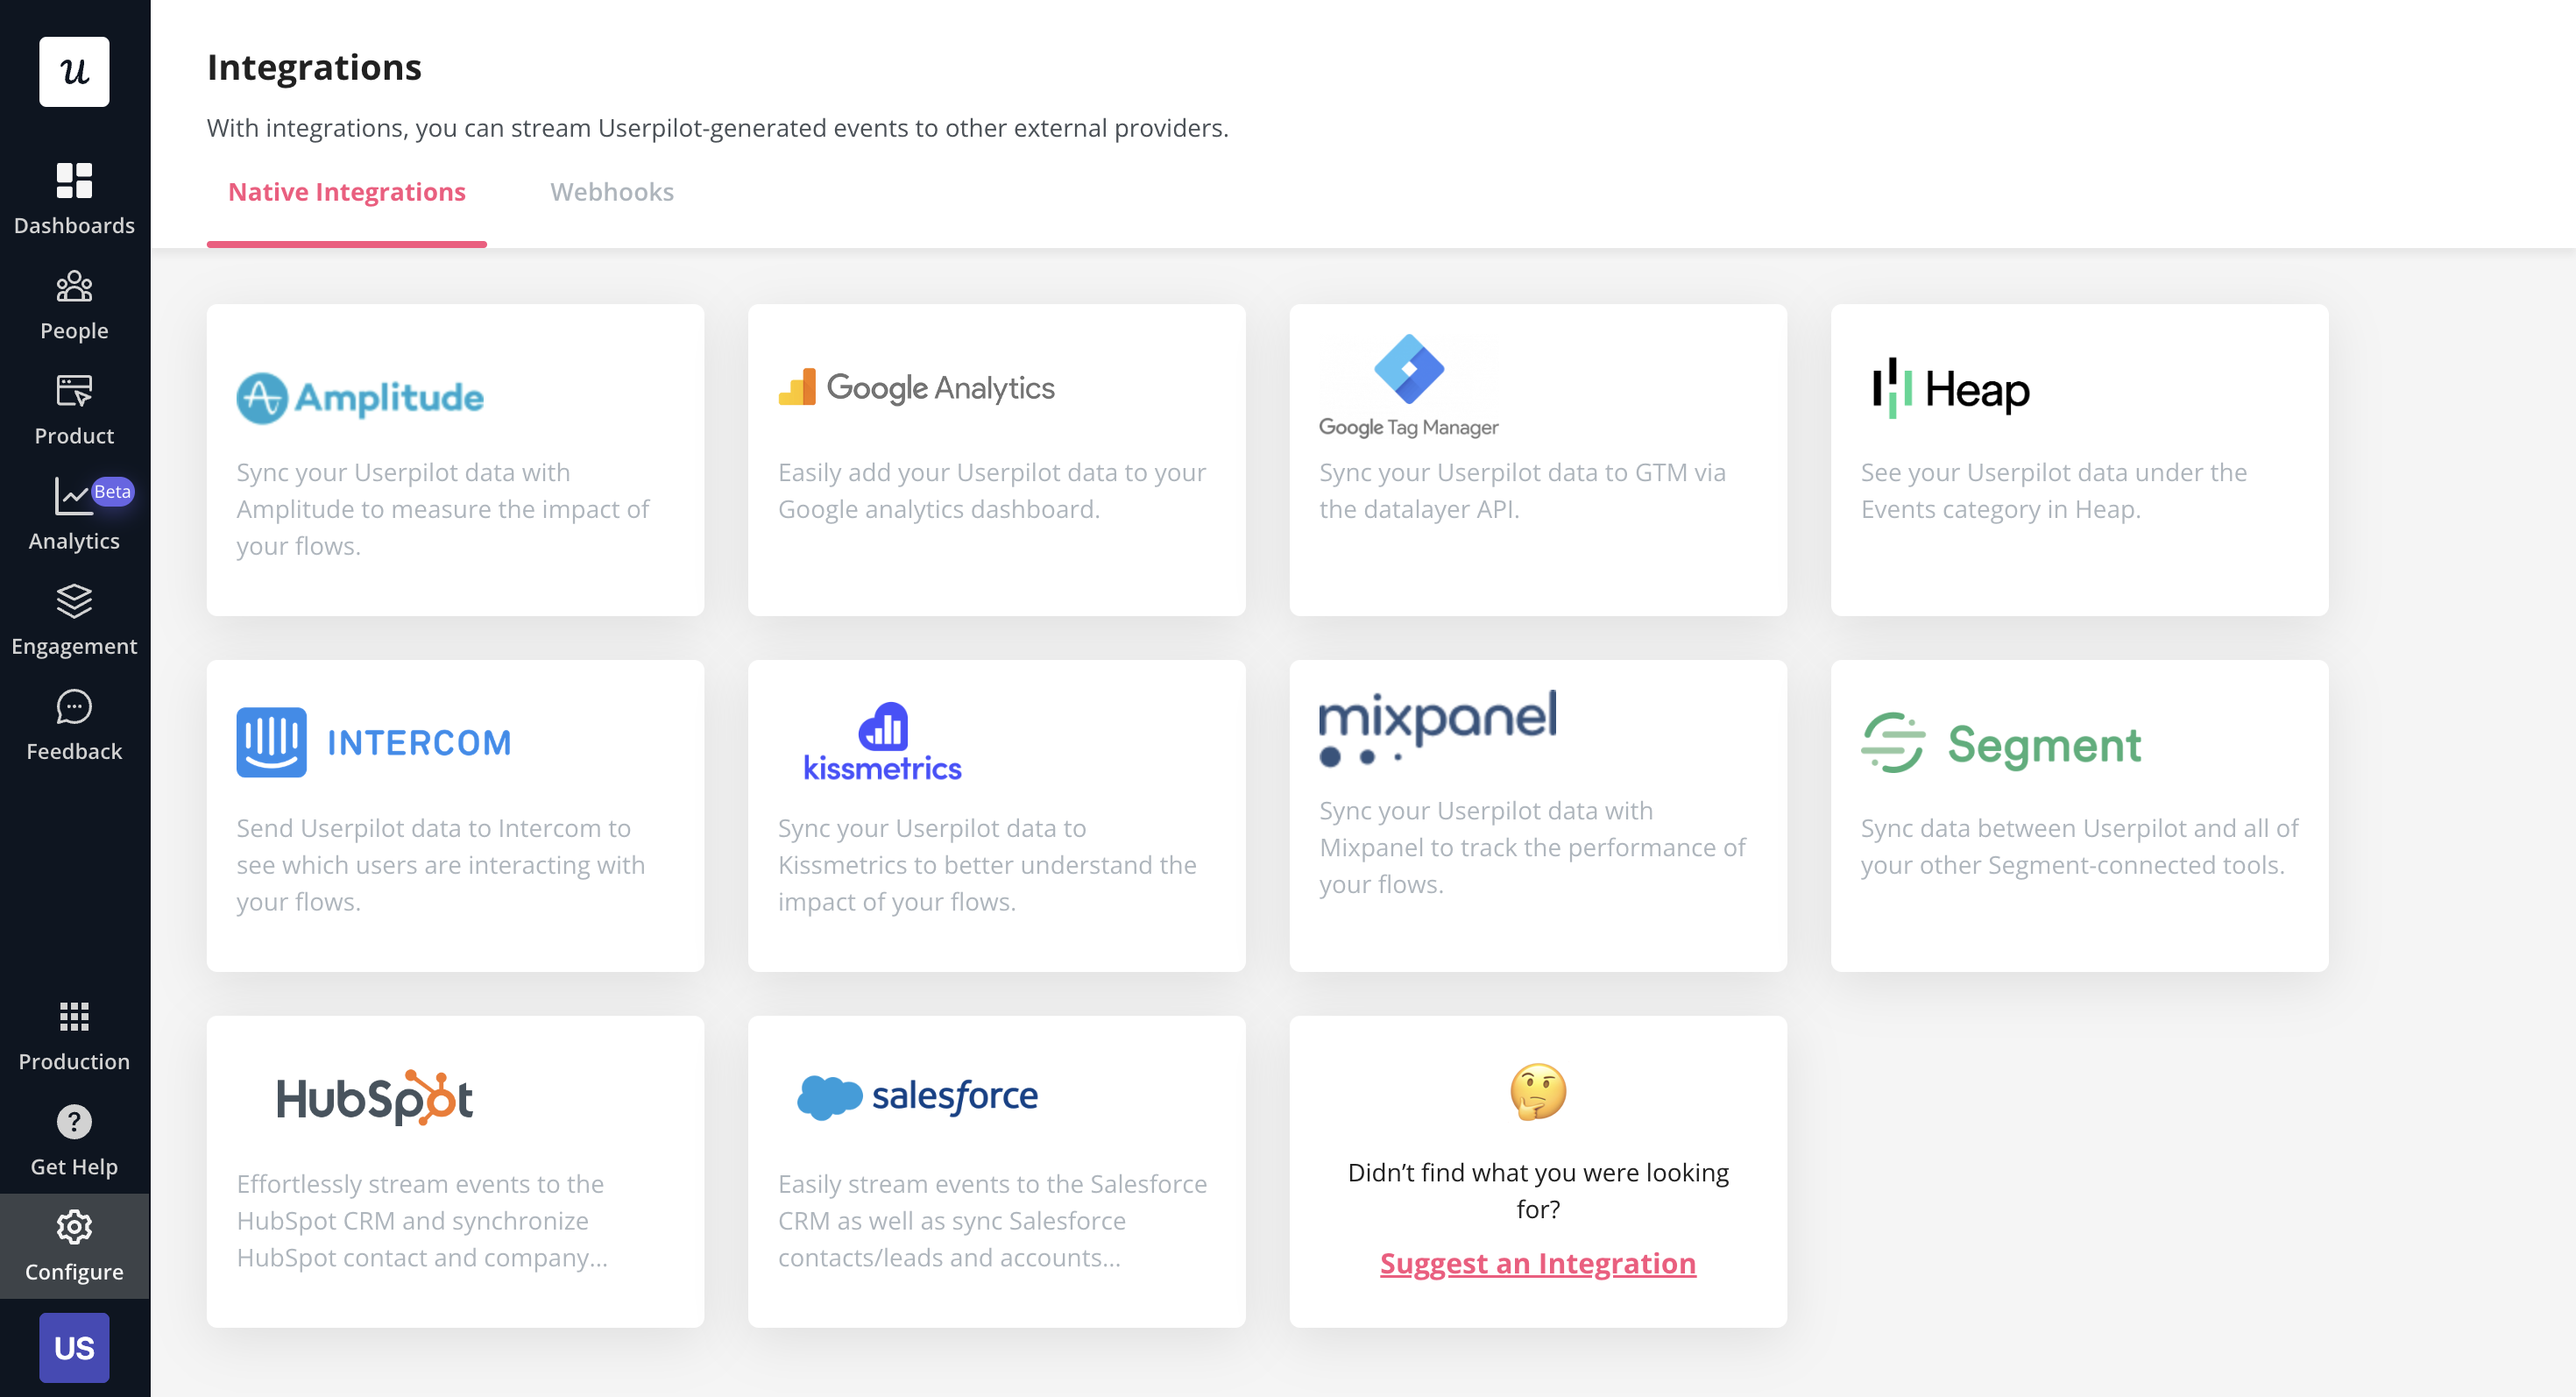
- External data: Userpilot integrates with tools like Amplitude, Google Analytics, Mixpanel, and Segment using a one-way integration. This means you can use the data inside Userpilot to build advanced segmentation and trigger contextual experiences. For more advanced use cases, the two-way integration with Hubspot lets you send and receive data, unlocking a full set of use cases.
Userpilot’s interactive walkthroughs
Interactive walkthroughs are better than linear product tours because they let new users learn by doing instead of dumping a ton of information on them all at once. Userpilot’s no-code features let you build advanced interactive walkthroughs and create personalized flows for each segment.
Here are the Userpilot features you can use to create interactive walkthroughs:
- No-code builder: Installing the Userpilot Chrome extension makes it possible to build interactive walkthroughs with zero coding needed. You’ll be able to use every UI pattern — such as modals, slideouts, tooltips, and driven actions — regardless of which plan you’re on.
- Welcome surveys: Userpilot lets you create welcome screens that survey users on what their primary use cases, roles, needs, etc., are. You can create different walkthroughs depending on their responses to ensure that there’s a personalized experience for all.
- Audience settings: The audience settings on Userpilot flows help you trigger or hide walkthroughs from specific users and segments. This makes it possible to create interactive walkthroughs that target a particular segment or trigger a flow when certain conditions are met.
Userpilot’s tooltips
Tooltips are the most straightforward way to offer contextual information to users without interrupting their workflows. Userpilot lets you create tooltips as part of your in-app flows, attach standalone tooltips to individual features, and leverage the power of AI to streamline the process.
Here are the ways you can use Userpilot to create tooltips:
- Tooltip flows: Tooltips are one of the UI elements you can utilize when creating in-app flows. You’ll be able to edit the size, placement, and behavior of your tooltip as needed. You could also toggle the option to continue or dismiss the flow if a tooltip’s element can’t be located.
- Native tooltips: Userpilot spotlights let you create native tooltips that expand when users click on an element or hover over a feature. Since these tooltips are attached to the features rather than specific pages, they’ll show up anywhere that the element is present.
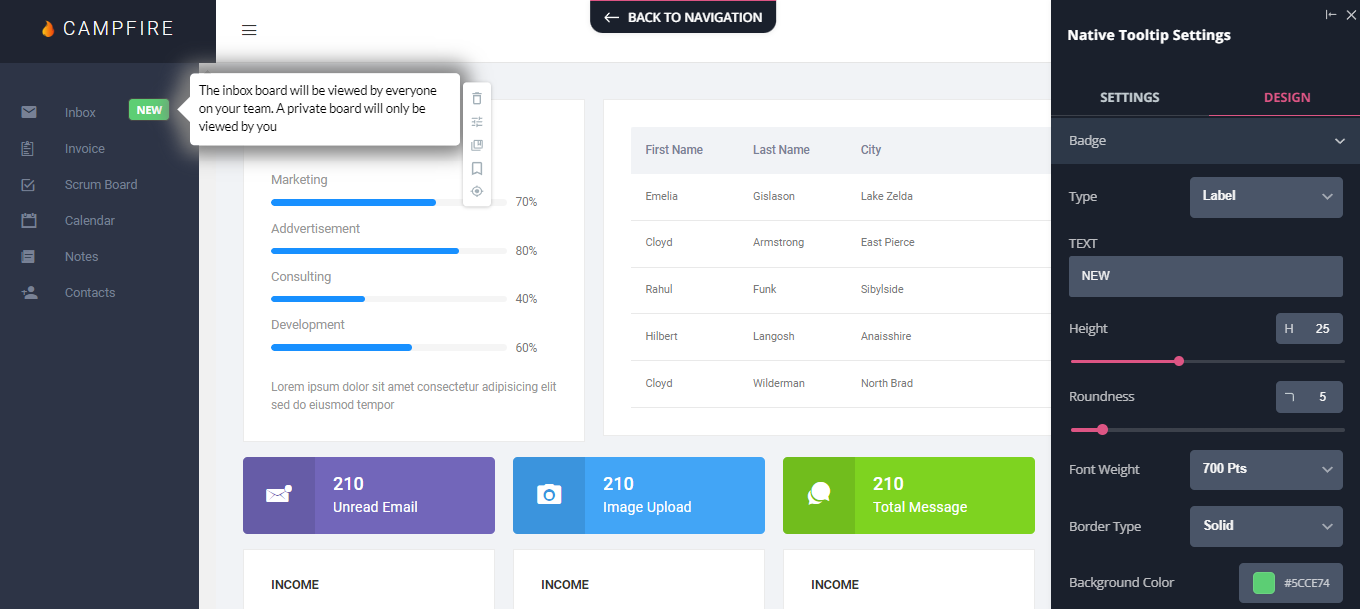
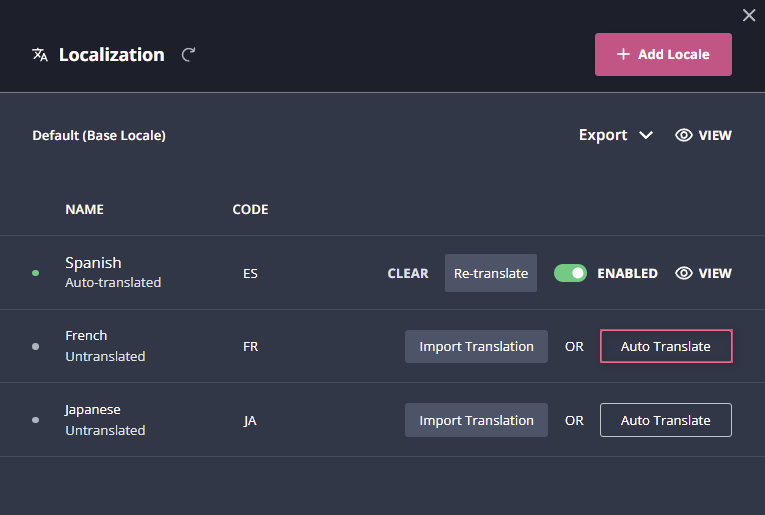
- AI assistance: Userpilot’s AI-powered capabilities help you create better tooltips in less time. You could use the writing assistant to create, shorten, or extend the content of tooltips and leverage automated localization to translate your flow’s tooltips to any of the 32 languages available.
Userpilot’s onboarding checklist
Onboarding checklists help new users learn about a product and reduce their time-to-value (TTV). Userpilot checklists can be created using the no-code builder, used to trigger specific actions, and tracked using the analytics dashboard to gauge overall engagement.
Here’s how you can use Userpilot to create an advanced onboarding checklist:
- No-code builder: Userpilot’s checklist creator lets you edit the content of checklists, add tasks, style icons, and configure the triggers for when your checklist should appear. You’ll also be able to choose from five widget icons (or upload your own) and recolor the widget to match your UI.
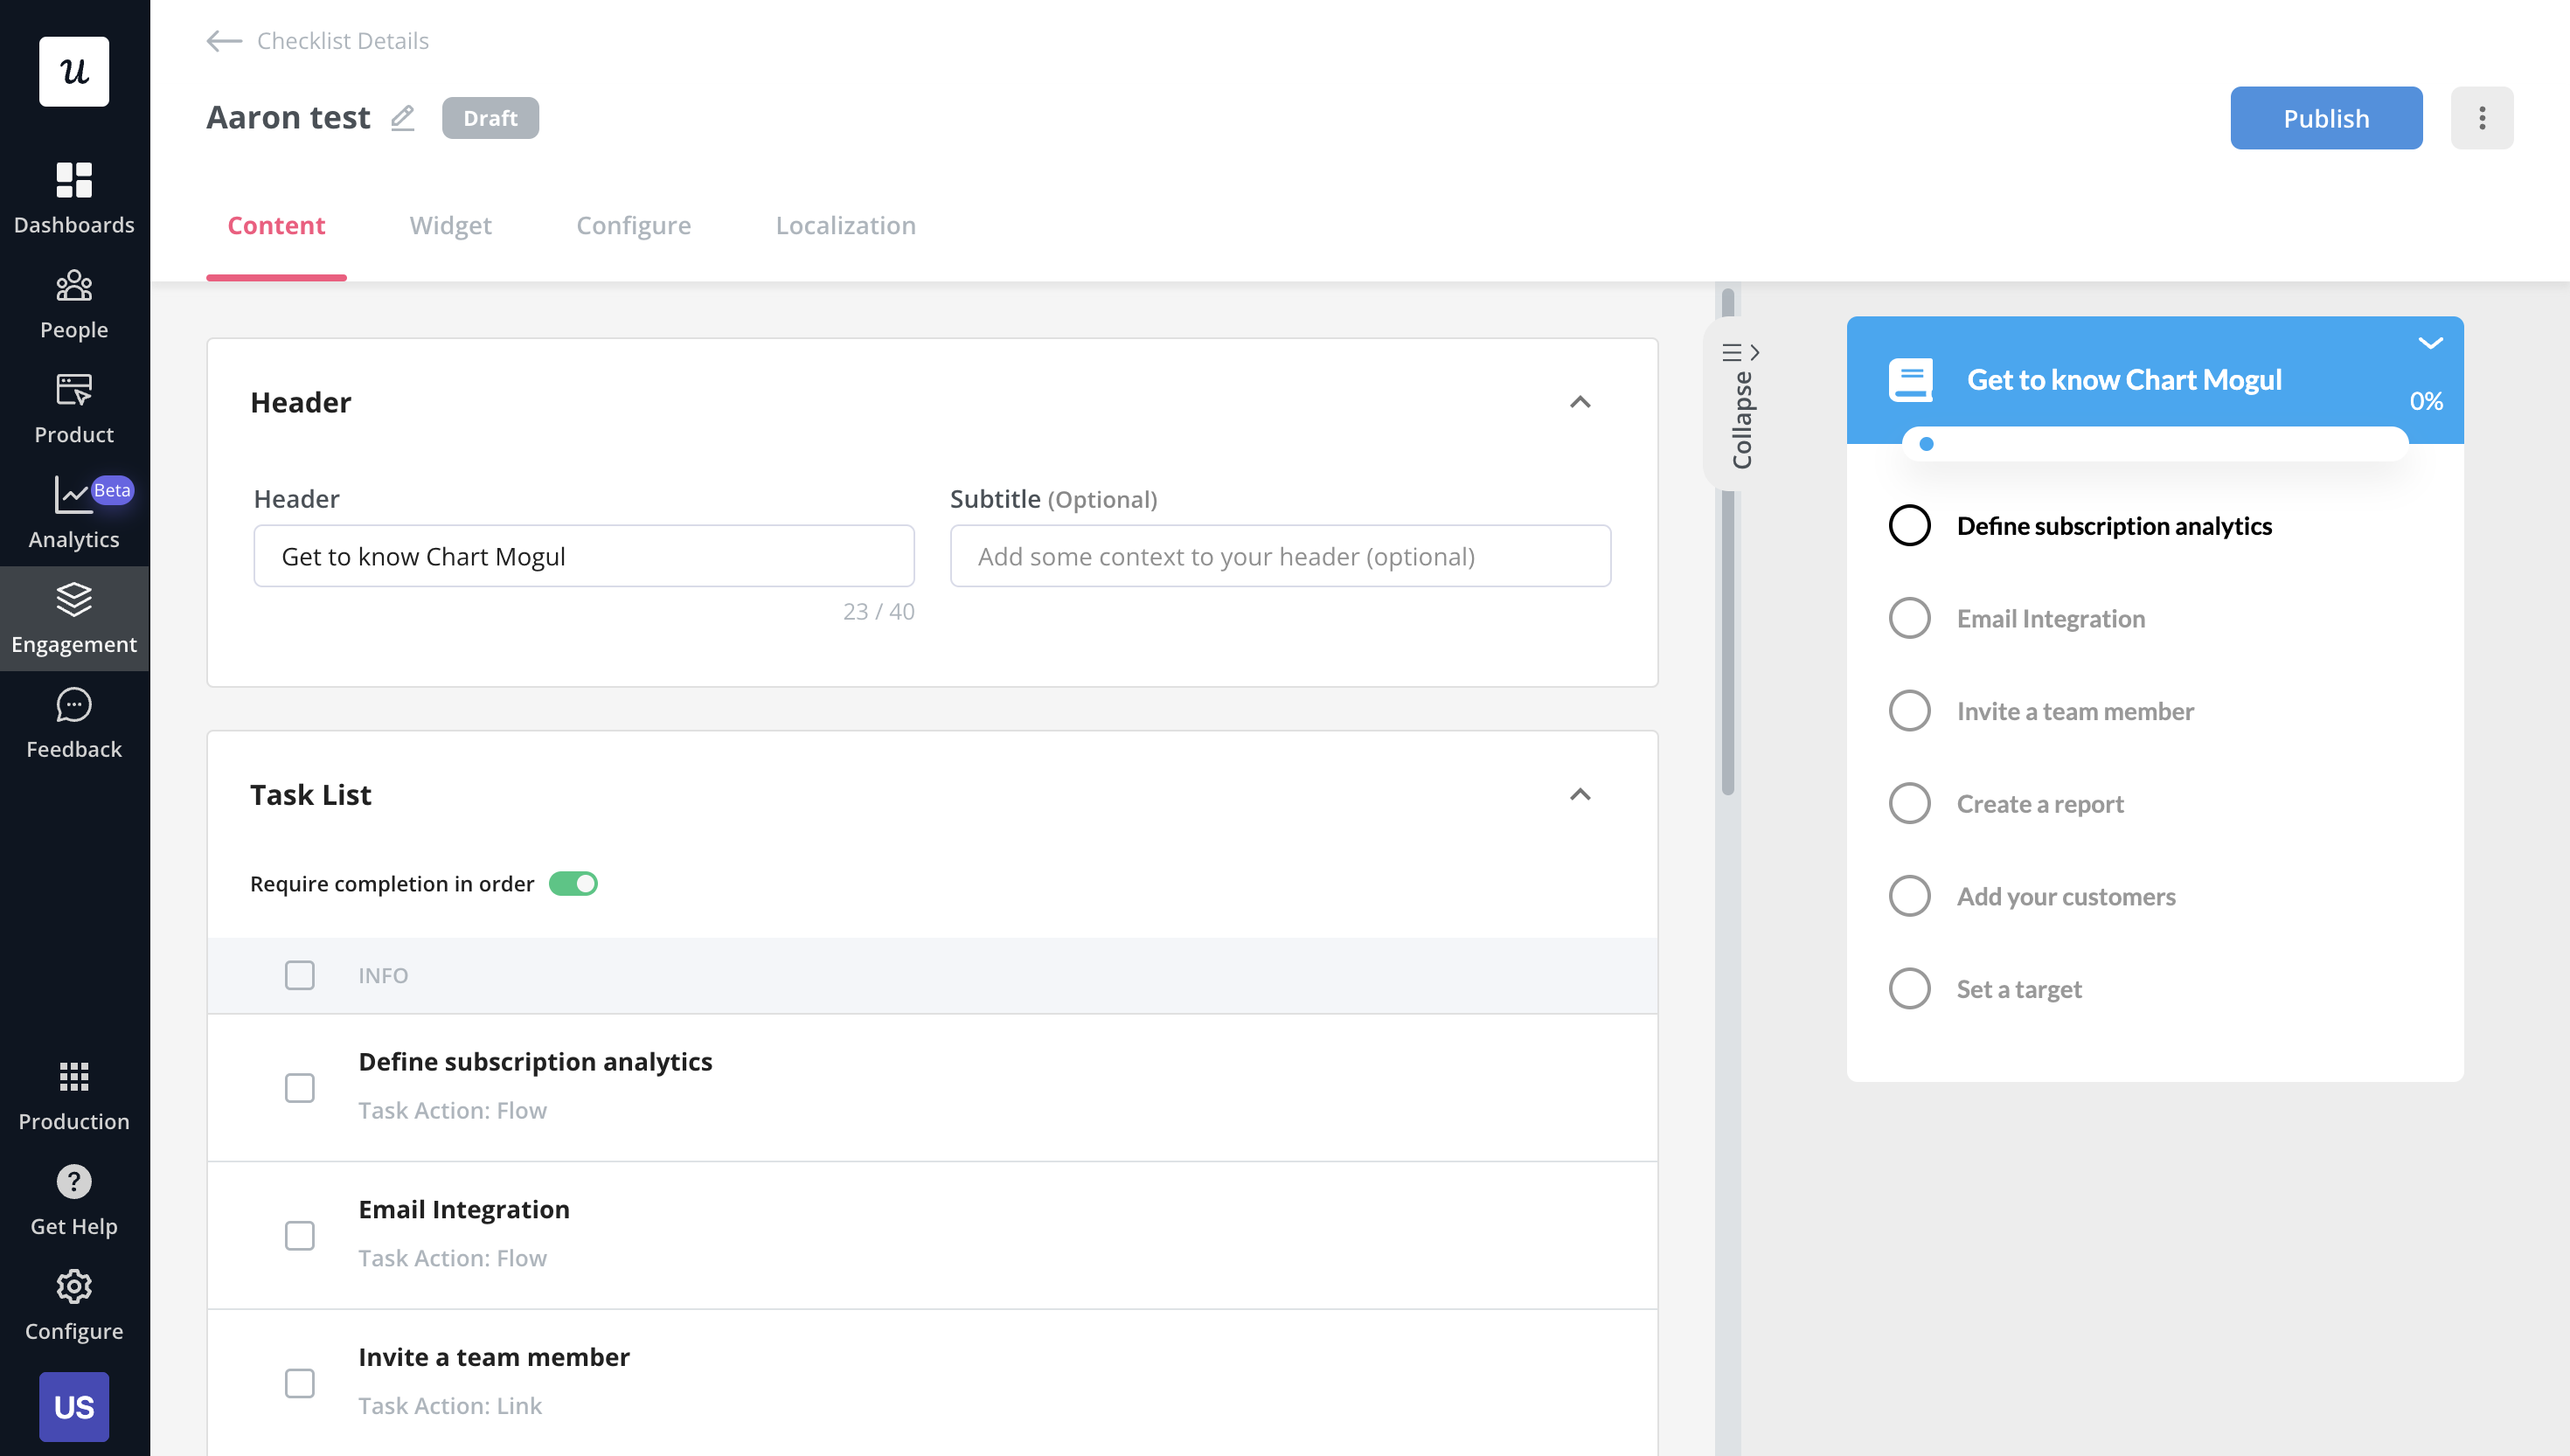
- Smart tasks: Checklist tasks can be set to trigger specific actions upon being completed, such as redirecting a user to a different page, launching an in-app flow, or running a custom JavaScript function. You can also set the conditions for when a task and action will be marked as complete.
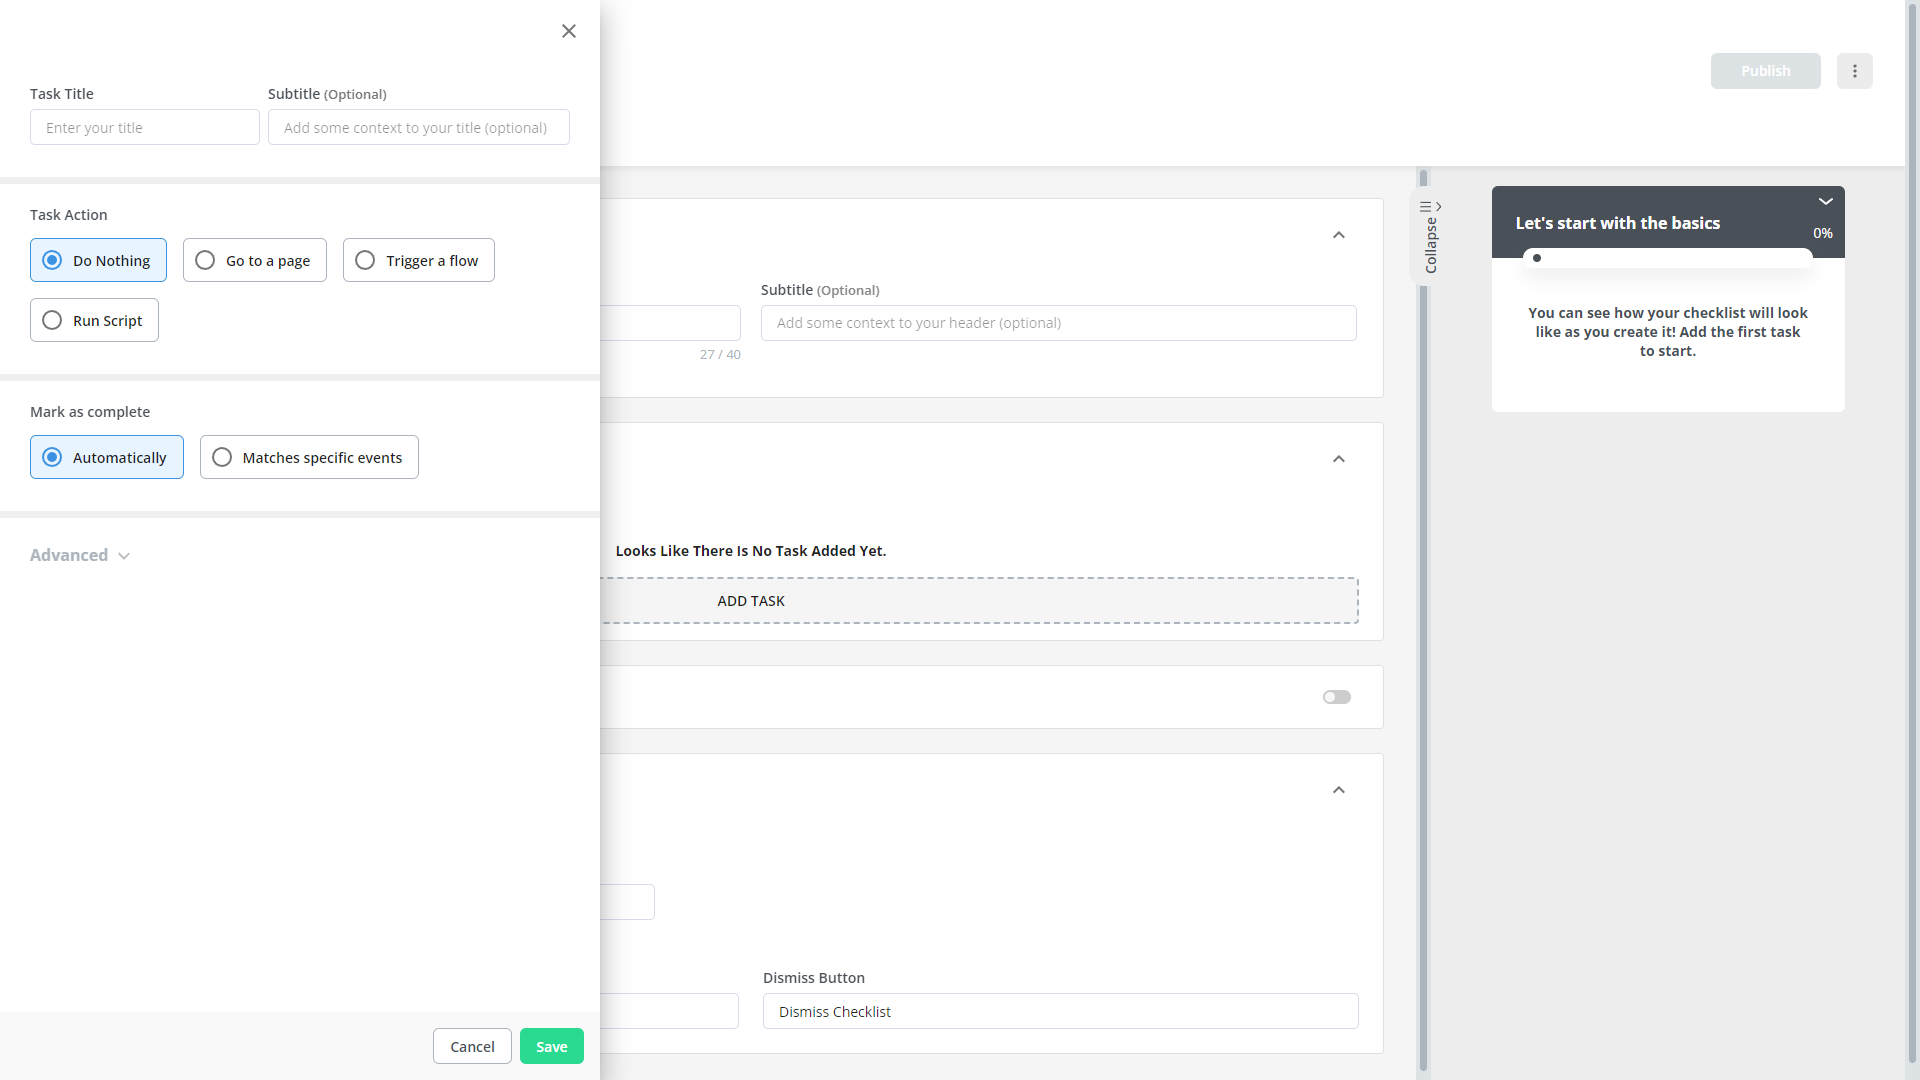
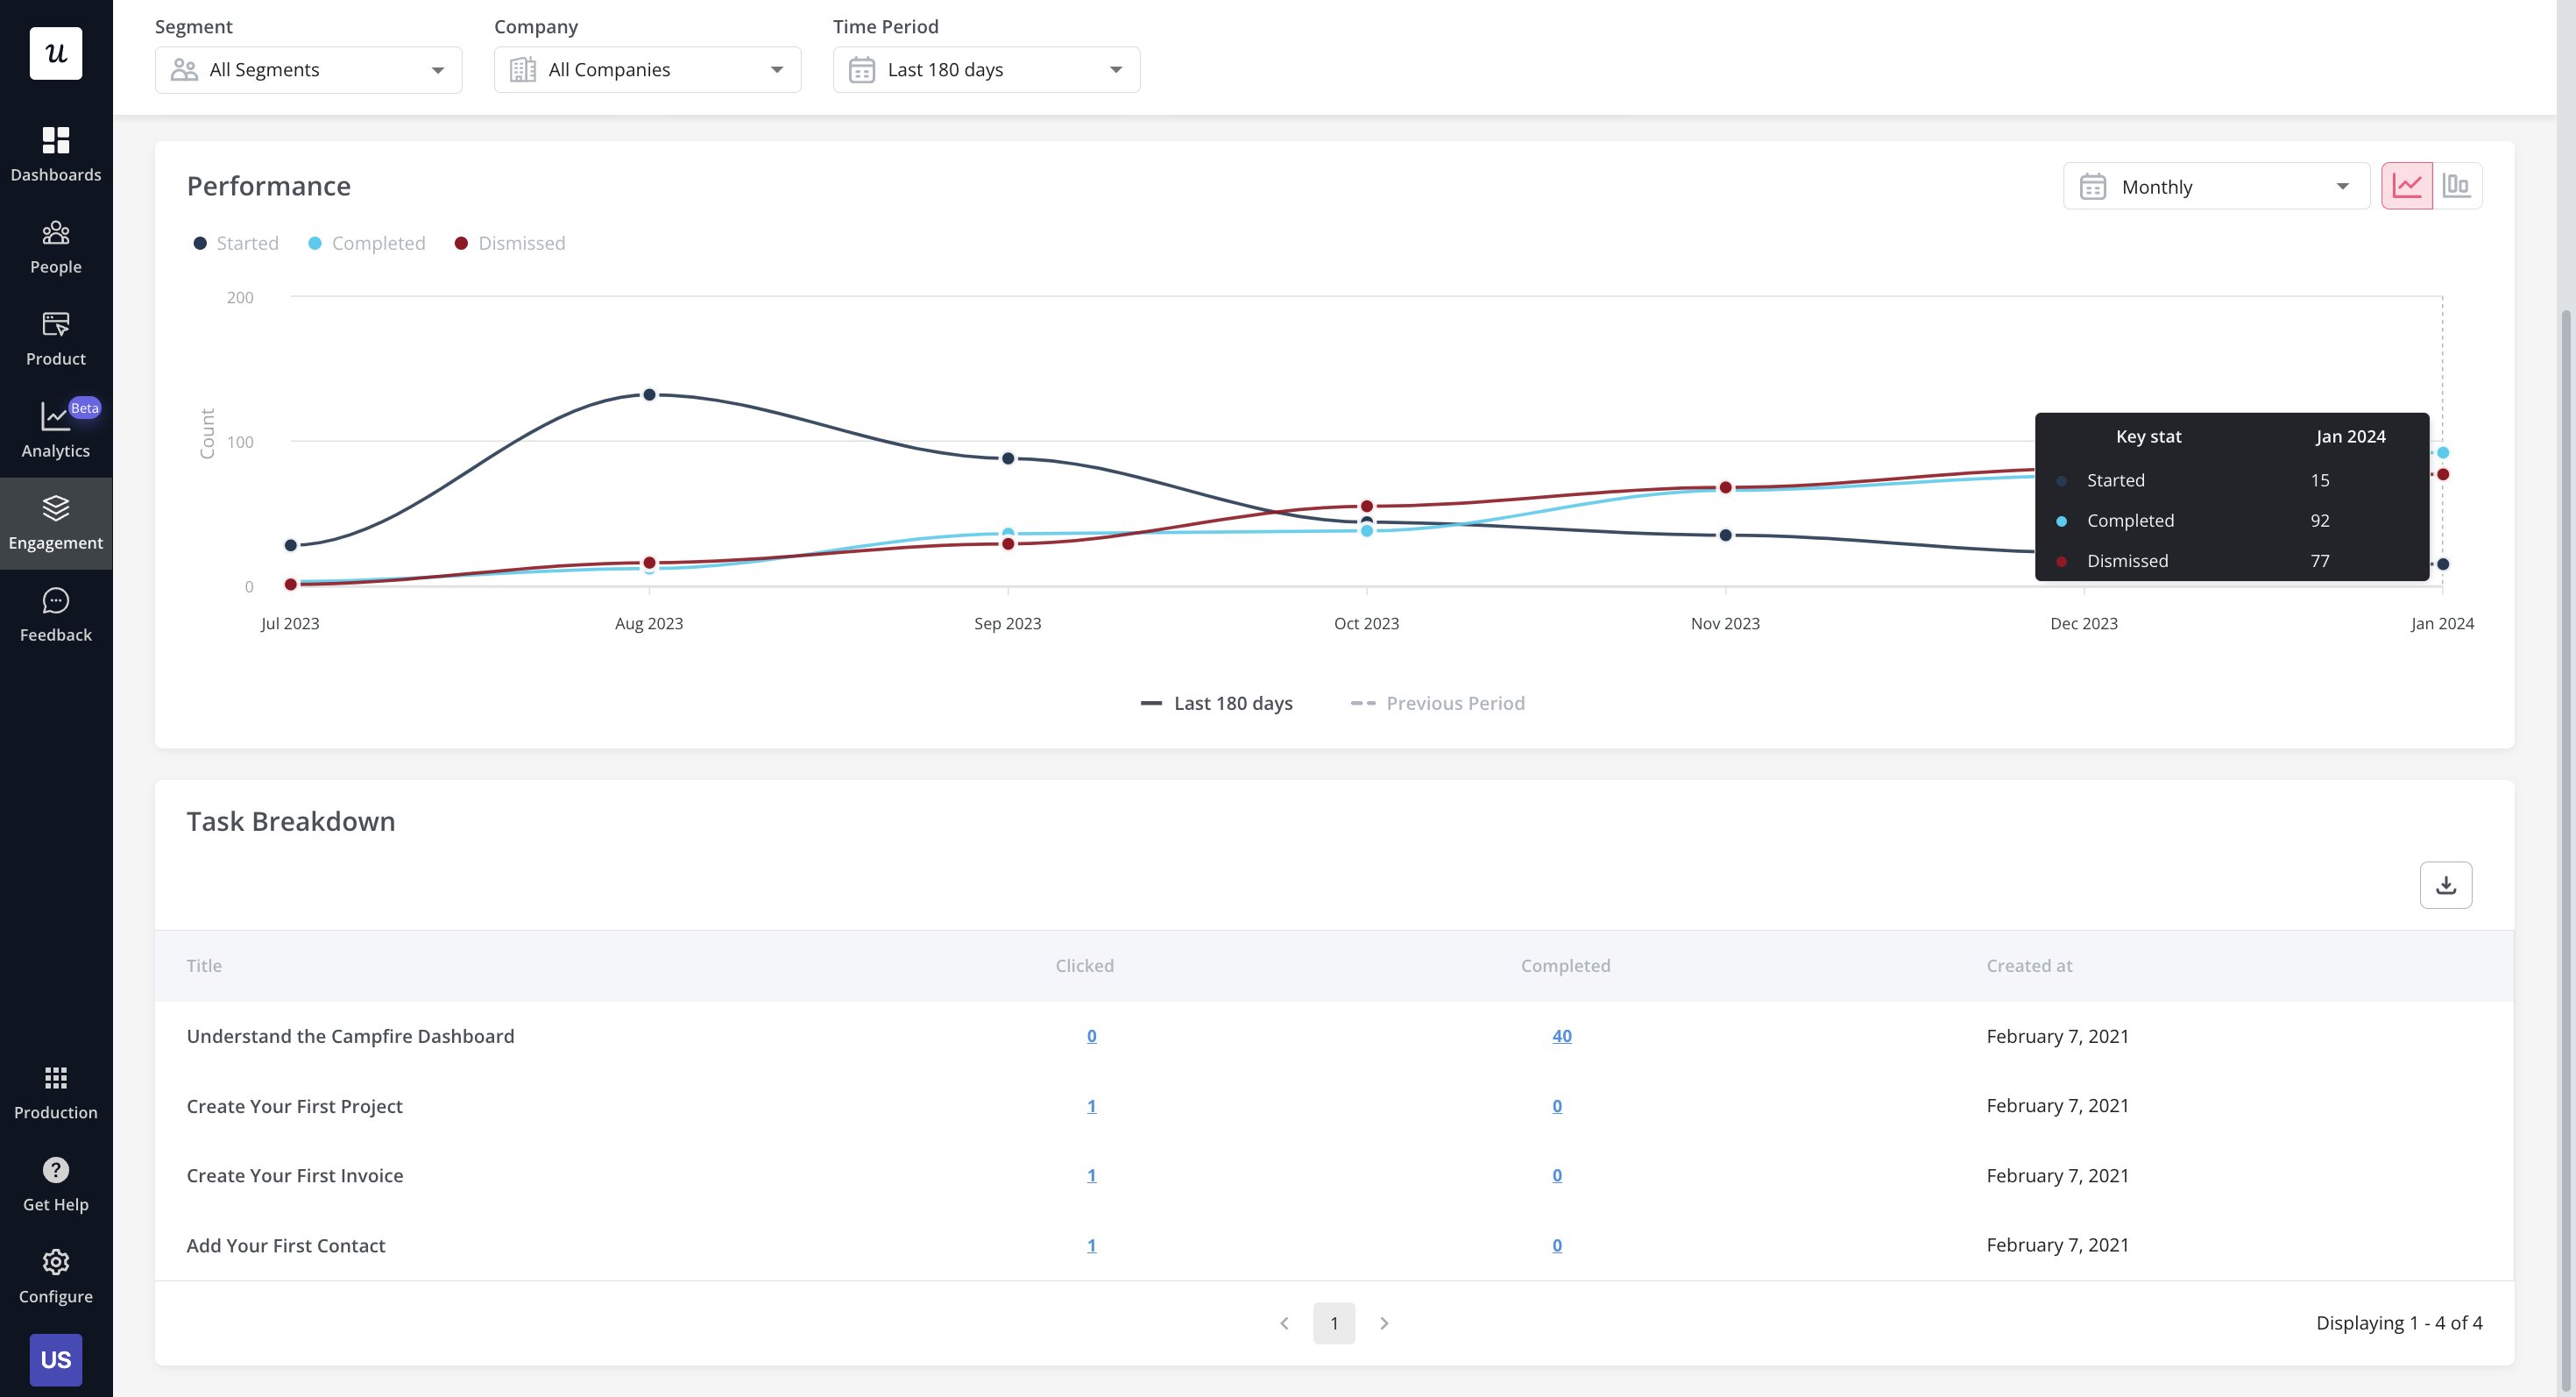
- Checklist analytics: The Checklists dashboard shows you all relevant metrics. These include the number of live checklists you have, how many views they’ve gotten, and how many have been completed. You can also sort these analytics by segment or time period to identify trends.
What are the pros and cons of Userpilot?
Userpilot’s pros
As a full-suite digital adoption platform, Userpilot has all the features you need to onboard users, track analytics, and gather feedback from customers without writing a single line of code. Here are a few pros of using Userpilot as your product growth solution:
- No-code builder: Userpilot’s Chrome extension lets you build flows, add UI elements, and tag features without writing a single line of code.
- UI patterns: There are plenty of UI patterns to choose from when using Userpilot, such as hotspots, tooltips, banners, slideouts, modals, and more!
- Startup-friendly: Userpilot’s entry-level plan gives you access to all available UI patterns so you can hit the ground running.
- Walkthroughs and flows: Build engaging interactive walkthroughs and personalized onboarding flows that target specific segments of your user base.
- Self-service support: Build an in-app resource center to help users solve problems, customize its appearance to align it with your brand, and insert various types of content (videos, flows, or chatbots) to keep your customers satisfied.
- A/B testing: Userpilot’s built-in A/B testing capabilities will help you split-test flows, iterate on the best-performing variants, and continually optimize based on user behavior.
- Feedback collection: Userpilot has built-in NPS surveys with its own unified analytics dashboard and response tagging to help you retarget users. There are other survey types to choose from and you can even create your own custom survey.
- Survey templates: There are 14 survey templates to choose from so you can gather feedback on specific features or run customer satisfaction benchmarking surveys like CSAT and CES.
- Advanced analytics: Userpilot lets you analyze product usage data, monitor engagement on all in-app flows, and use the data to create user segments that are based on behaviors instead of demographics.
- Event tracking: Userpilot’s no-code event tracking lets you tag UI interactions (hovers, clicks, or form fills) and group them into a custom event that reflects feature usage.
- Mobile: With Userpilot’s mobile SDK, you can create targeted onboarding flows using slideouts, carousels, and push notifications without writing extra code.
- Third-party integrations: Userpilot has built-in integrations with tools like Amplitude, Mixpanel, Kissmetrics, Segment, Heap, HubSpot, Intercom, Google Analytics, and Google Tag Manager so you can share data between all the solutions in your tech stack.
Userpilot’s cons
Of course, no tool is perfect and there are a few cons to consider before choosing Userpilot as your user onboarding or product growth solution:
- Employee onboarding: Currently, Userpilot only supports in-app customer onboarding.
- Freemium plan: There’s no freemium Userpilot plan so those bootstrapping their startup and need sub-$100 solutions should consider more affordable onboarding platforms like UserGuiding or Product Fruits.
What do users say about Userpilot?
Most users laud Userpilot for its versatile feature set, ease of use, and responsive support team:
I recently had the pleasure of using Userpilot, and I must say it exceeded all my expectations. As a product manager, I’m always on the lookout for tools that can enhance user onboarding and improve overall user experience. Userpilot not only delivered on these fronts but also went above and beyond with its impressive new features, unparalleled ease of use, and truly exceptional customer support.
What truly sets Userpilot apart is its outstanding customer support. Throughout my journey with Userpilot, the support team has been responsive, knowledgeable, and genuinely dedicated to helping me succeed. Whenever I had a question or encountered an issue, their support team was always there to assist promptly, going above and beyond to ensure my concerns were addressed effectively.
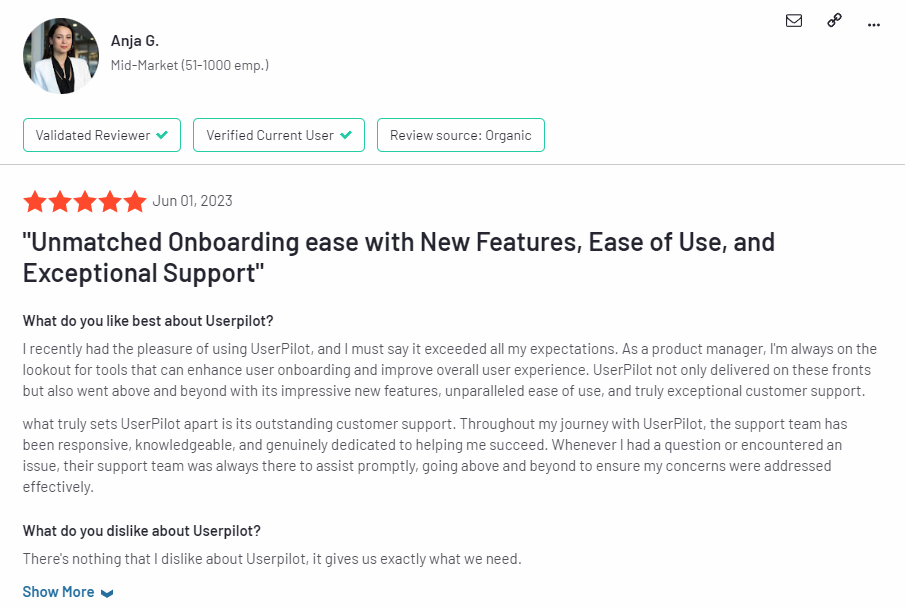
Source: G2.
Of course, other users are also kind enough to share constructive criticism regarding specific features like event tracking filters:
“The filtration while analyzing specific events is a little confusing. Understanding of custom properties and data management configuration could have been more organised.”
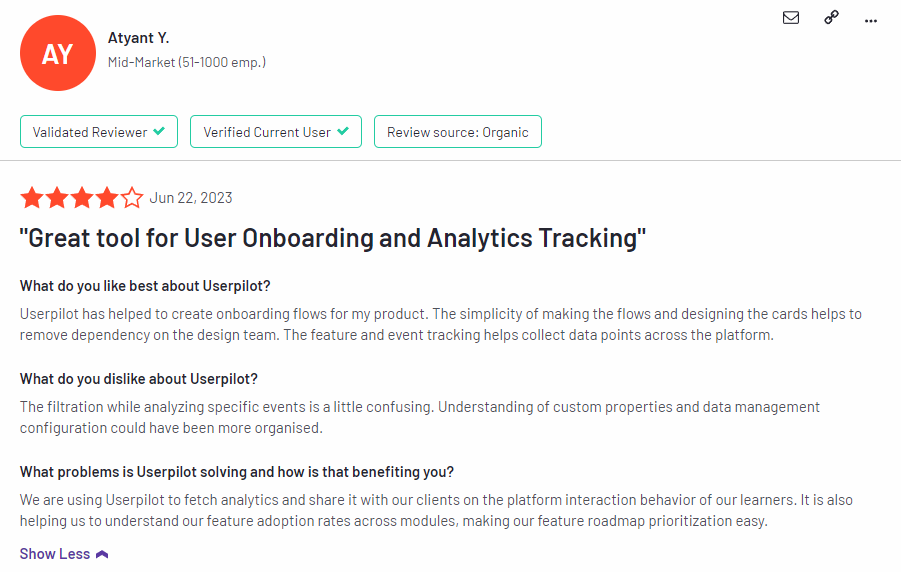
Source: G2.
Userpilot’s pricing
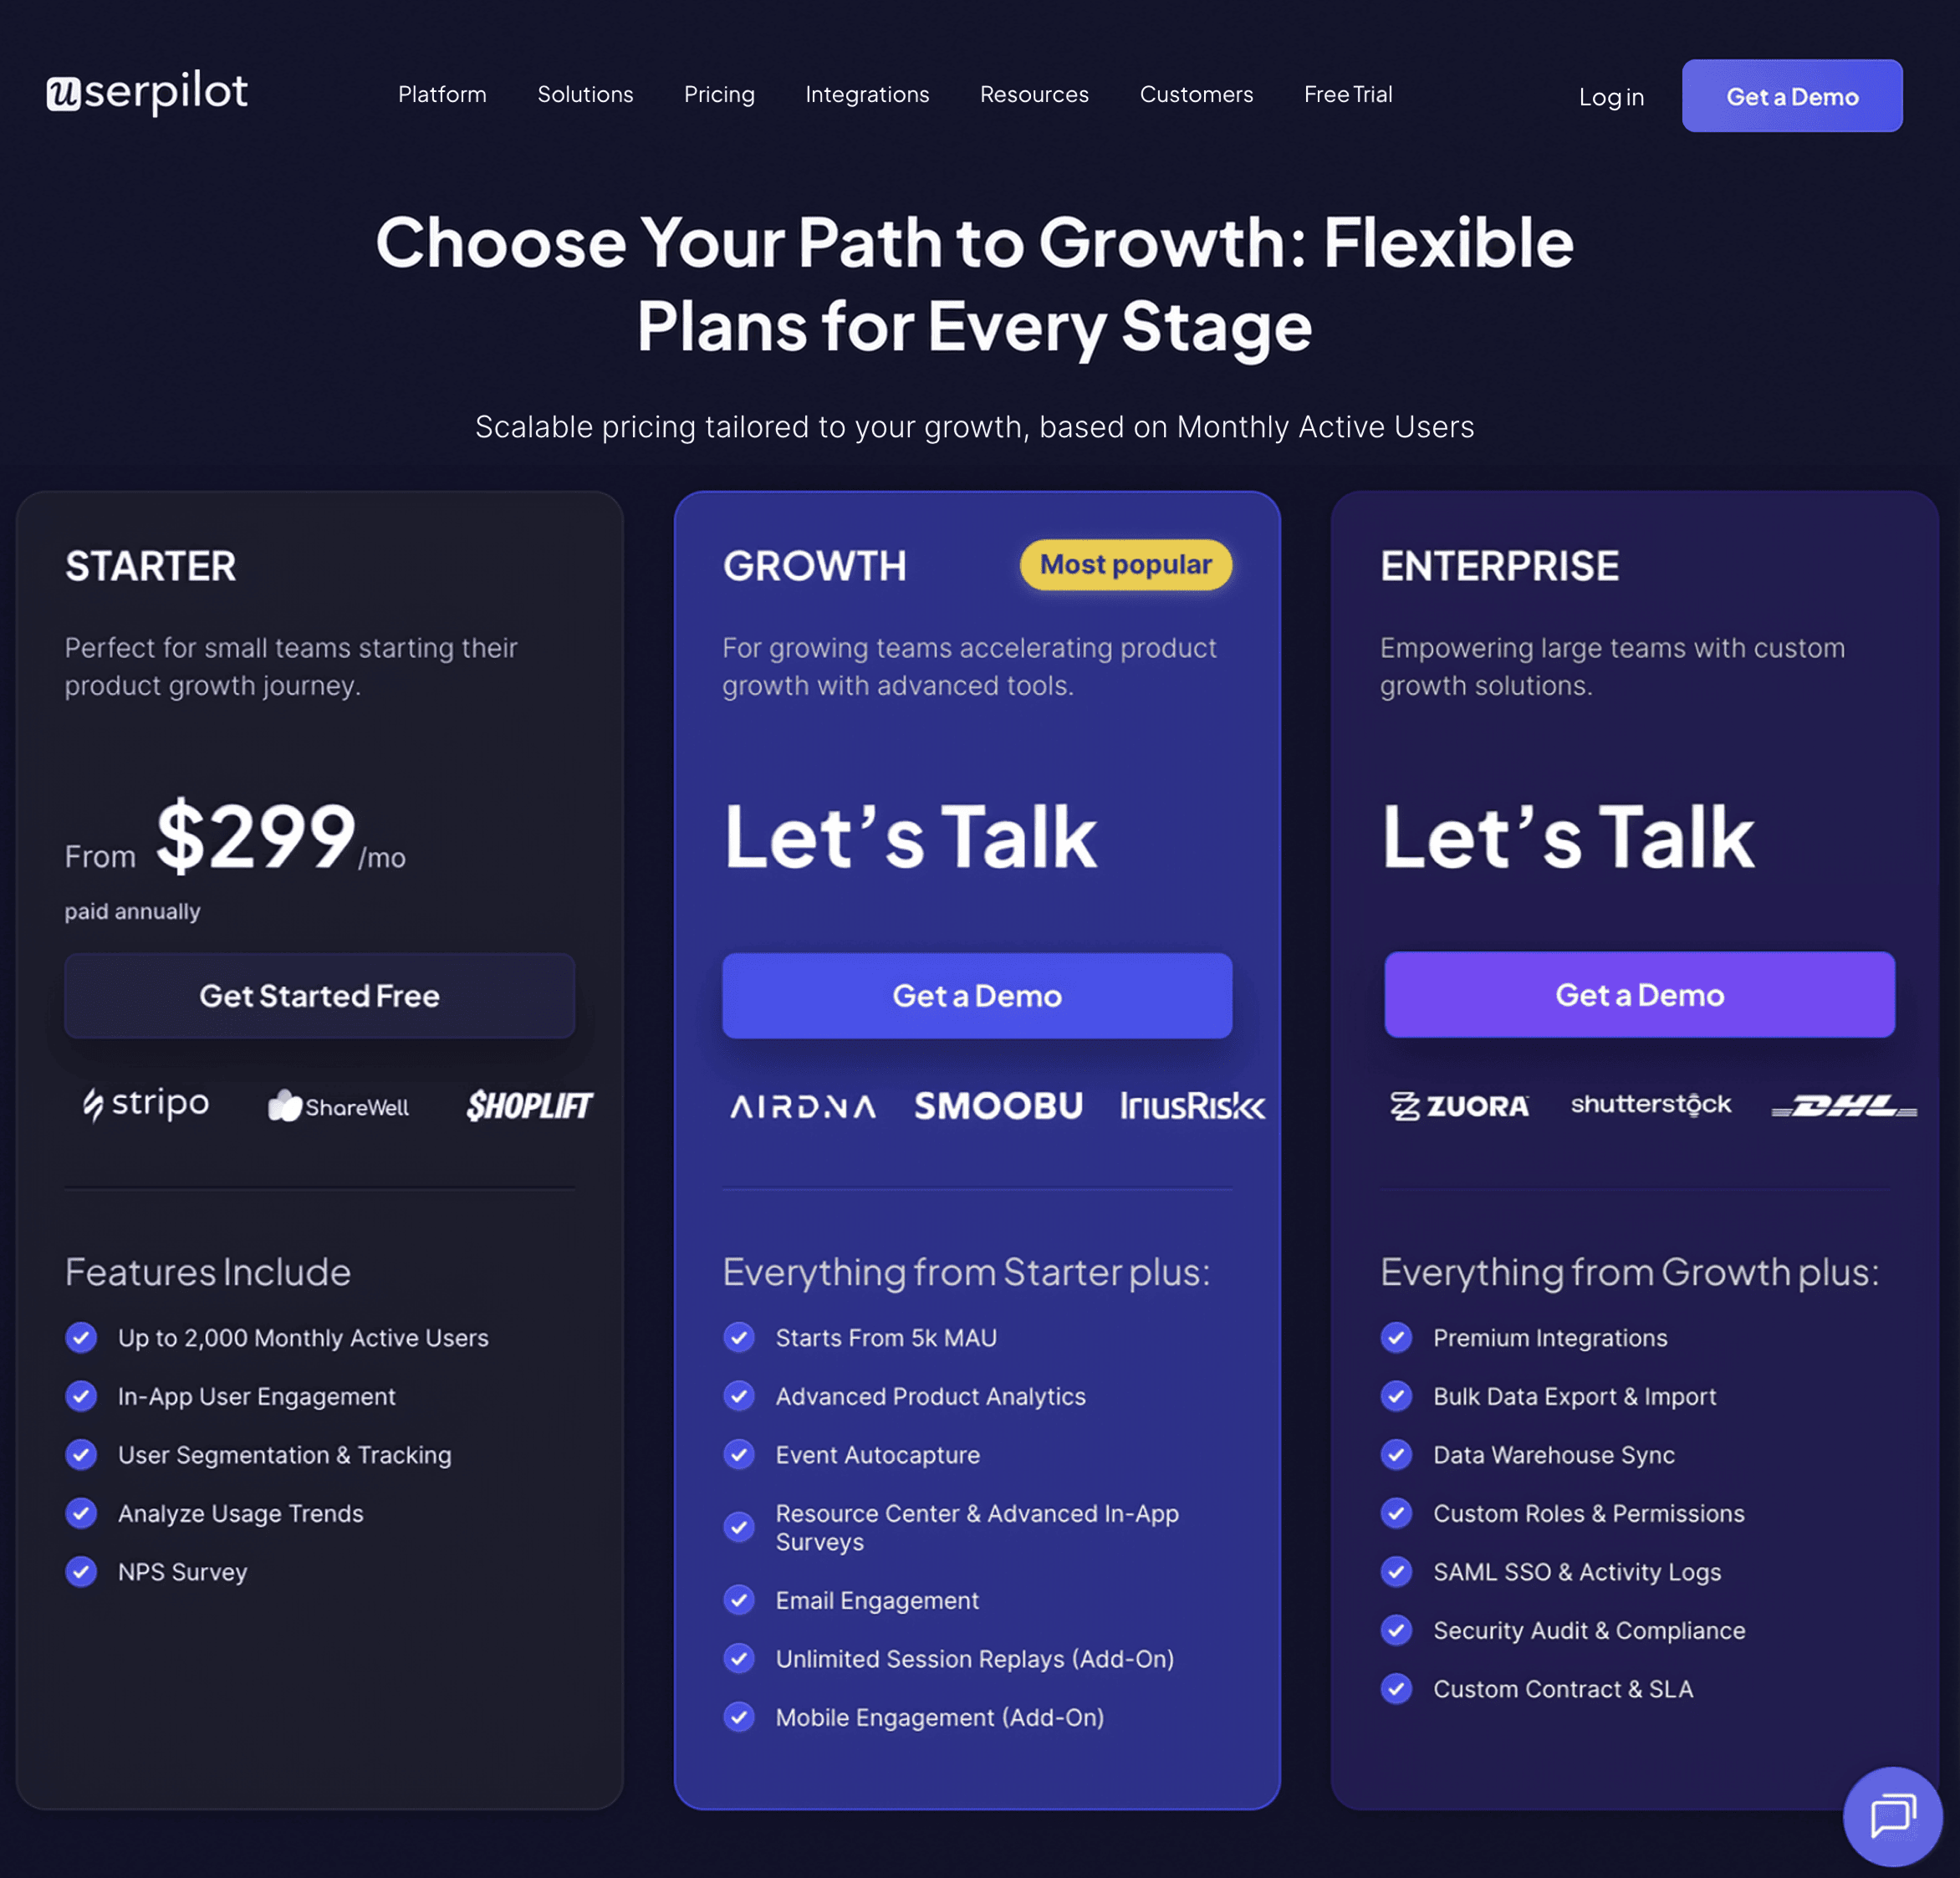
Userpilot offers flexible pricing based on your monthly active users (MAUs). Plans start at $299 per month for smaller teams and scale as your user base grows.
Below are the pricing tiers you can choose from:
- The Starter plan begins at $299/month (billed annually) for up to 2,000 monthly active users. It includes in-app user engagement, usage trend analysis, NPS surveys, and essential product analytics—ideal for mid-market SaaS teams getting started.
- The Growth plan offers custom pricing and adds advanced analytics, retroactive event auto-capture, in-app surveys, session replay, and more. It’s the most popular choice for growing teams that need deeper insights and scale.
- The Enterprise plan offers custom pricing and includes everything in Growth, plus bulk data handling, custom roles and permissions, SOC 2 Type 2 compliance, and enterprise-level support.
Conclusion
There you have it.
It should be easier now to make an informed decision whether Userpilot is your go-to option for new customer onboarding. Ultimately, the best choice will depend on your product and current needs.
Book a Userpilot demo today to experience firsthand how it can enhance your user experience and drive product growth!
About the author