AI Agent-Ready Software Usage Analytics Guide for 2026


Software usage analytics is supposed to tell you exactly how users interact with your product: which features they use, where they drop off, and what actions correlate with retention. For most of SaaS history, that was a tractable problem.
In 2026, AI agents have started breaking the assumption on which software usage analytics tools were built.
AI agents running on Claude, ChatGPT, and Cursor are now querying SaaS products through API connections and MCP integrations, and they don’t trigger the event types your analytics stack was built to catch. They don’t click, they don’t open sessions, and they don’t fill out NPS surveys. If your tracking doesn’t label agent-originated events separately from human events, your dashboards are blending two incompatible behavioral profiles into a single number that’s accurate for neither.
This guide covers what software usage analytics means in 2026, how to instrument your product for human and agent traffic, how to turn low-adoption data into an in-product fix, and how AI-powered tooling is beginning to handle both streams from a single platform.

What is software usage analytics?
Software usage analytics, sometimes called product usage analytics, tracks in-app behavioral data:
- Which features users interact with.
- Where they lose momentum.
- Which usage patterns correlate with retention.
- How behavior differs across distinct user segments.
Here are some key reasons why it makes sense to track how users navigate your software:
-
Improve Decision-Making: Software usage analytics helps you adopt a data-driven approach, providing the objective facts needed to guide your prioritization and product decisions.
-
Reduce Friction: Tracking usage data reveals exactly where users get stuck in the customer journey, allowing you to target and remove those specific roadblocks.
-
Boost User Experience: Insights into how users interact with your app give you the clear direction needed to make continuous improvements that enhance the overall experience.
How to conduct product usage analysis in your SaaS?
Next, we’ll break down exactly how to explore software usage data in your own product.
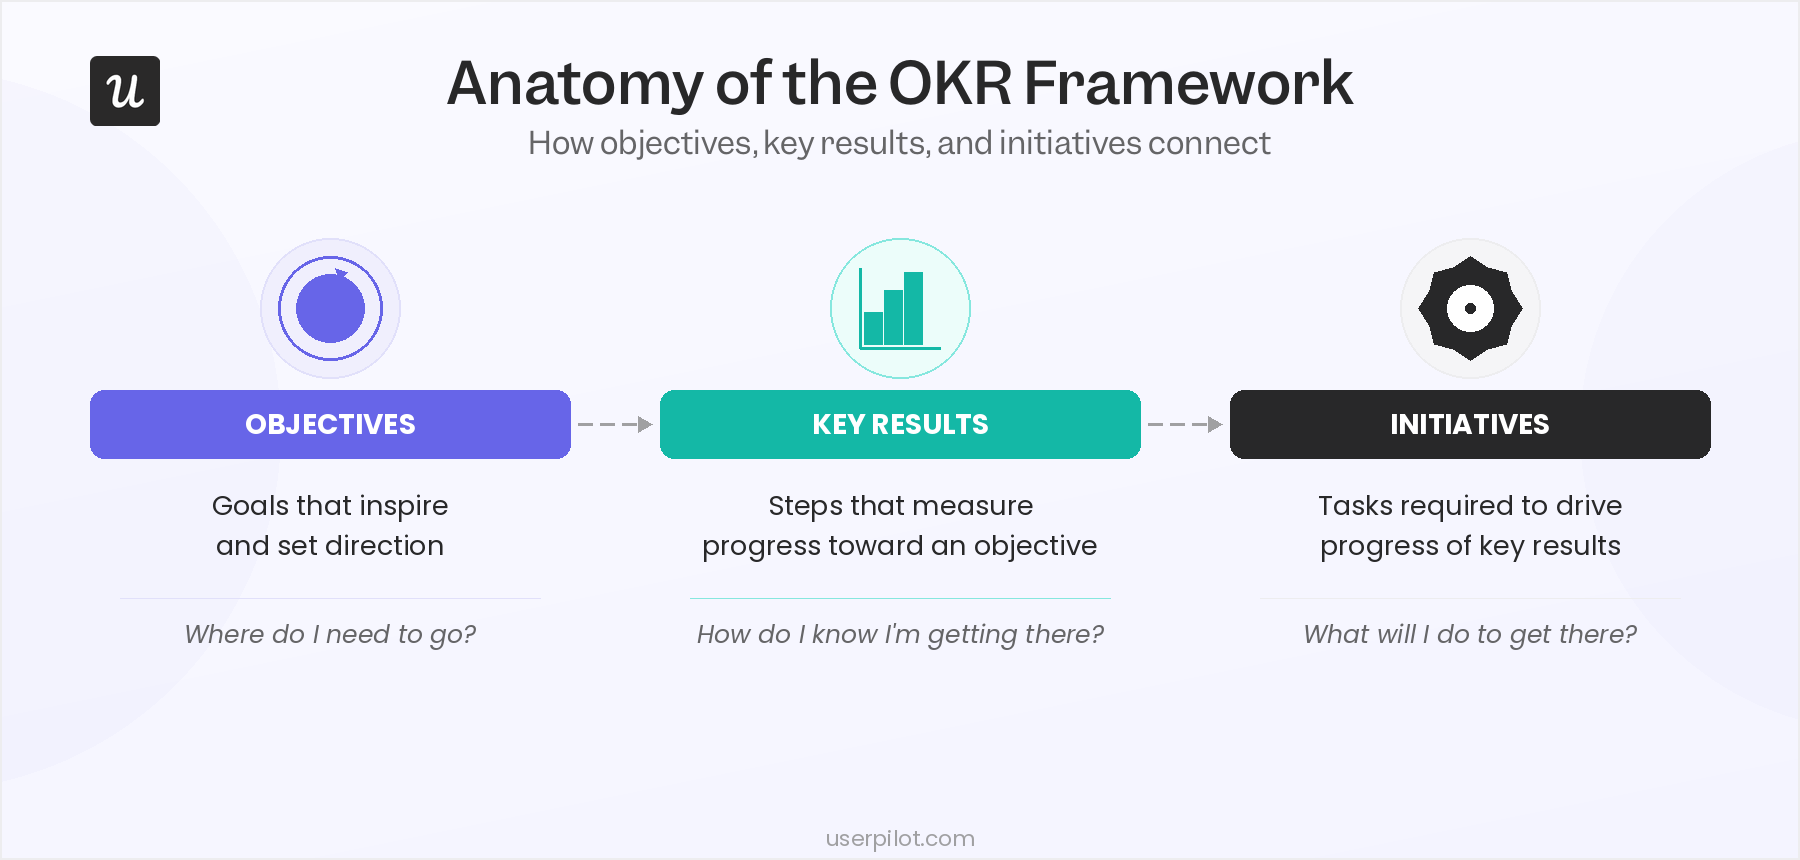
1. Define goals behind analyzing product usage data
Start with an idea of where you want to end up. Zeroing in on the reason you want to conduct software usage analysis gives you a much higher likelihood of succeeding in your goals.
Let’s say you want to increase retention. That will inform and direct all your efforts.
Different goal-setting frameworks, like OKR or the Golden Circle framework, can be used to determine your objectives.
2. Choose the right metrics to track product usage
Here are some of the key metrics to measure. Remember, metrics are different from analytics. Analytics deals with collecting and analyzing data, whereas metrics focus on evaluating a company’s success.
-
Time to Value (TTV): The gap between signup and a user’s first meaningful outcome; it is the highest-leverage PLG metric because fast, “first-touch” value strongly predicts downstream activation, retention, and expansion.
-
Activation Rate: Activation rate is the percentage of signups who reach your defined activation milestone (like completing a key workflow) rather than a mere setup task.
-
Feature Adoption Rate: The percentage of active users regularly using a specific feature. It serves as a direct measure of launch success where any feature failing to clear 10% adoption in six months becomes a candidate for deprecation.
-
Product Stickiness: Calculated as DAU / MAU, this metric measures how often users return within a given period and acts as a clean predictor of habit formation and eventual account renewal.
-
Customer Engagement Score: A single account health indicator combining usage frequency, feature usage breadth, and recency to give teams a data-driven shared language for catching churn risks before they hit the revenue numbers.
For early-stage products, I’d start with activation rate and feature adoption for the core use case. For scaling products, shift focus to retention analysis by cohort and engagement score by account. Review and prune your metric set quarterly. The signals worth tracking change as your product and user base mature, and you should keep up with these changes.
3. Select data collection sources and gather customer usage data
You’ve set the direction, and you’ve worked out which metrics to track. Fantastic! Next, you need to think about gathering data. Here’s how you do it.
-
Event and Feature Tracking: Tags key interactions such as button clicks and milestone completions, allowing you to segment usage patterns by persona, lifecycle stage, or account tier to analyze distinct user groups instead of relying on misleading averages.
-
Heatmaps: Visually map where users click, hover, and scroll, making them highly effective inputs for determining which UI elements draw attention, which get ignored, and whether navigation placements are actually working.
-
Session Recordings: Replay individual user journeys to observe exact behaviors, enabling you to catch nuanced friction points that aggregated data misses, such as a user repeatedly clicking a broken button or pausing unexpectedly during onboarding.
Finding and fixing low-adoption features after analysis
Once you’ve conducted product usage analytics, you should focus on fixing low feature adoption. You need to find what it’s a symptom of, and the fastest workflow for this involves three steps:
- Step 1 – Funnel analysis: Build a funnel from feature discovery (the first event showing a user found the feature) to completion (the first event showing they used it successfully). Find the step with the largest percentage drop-off.
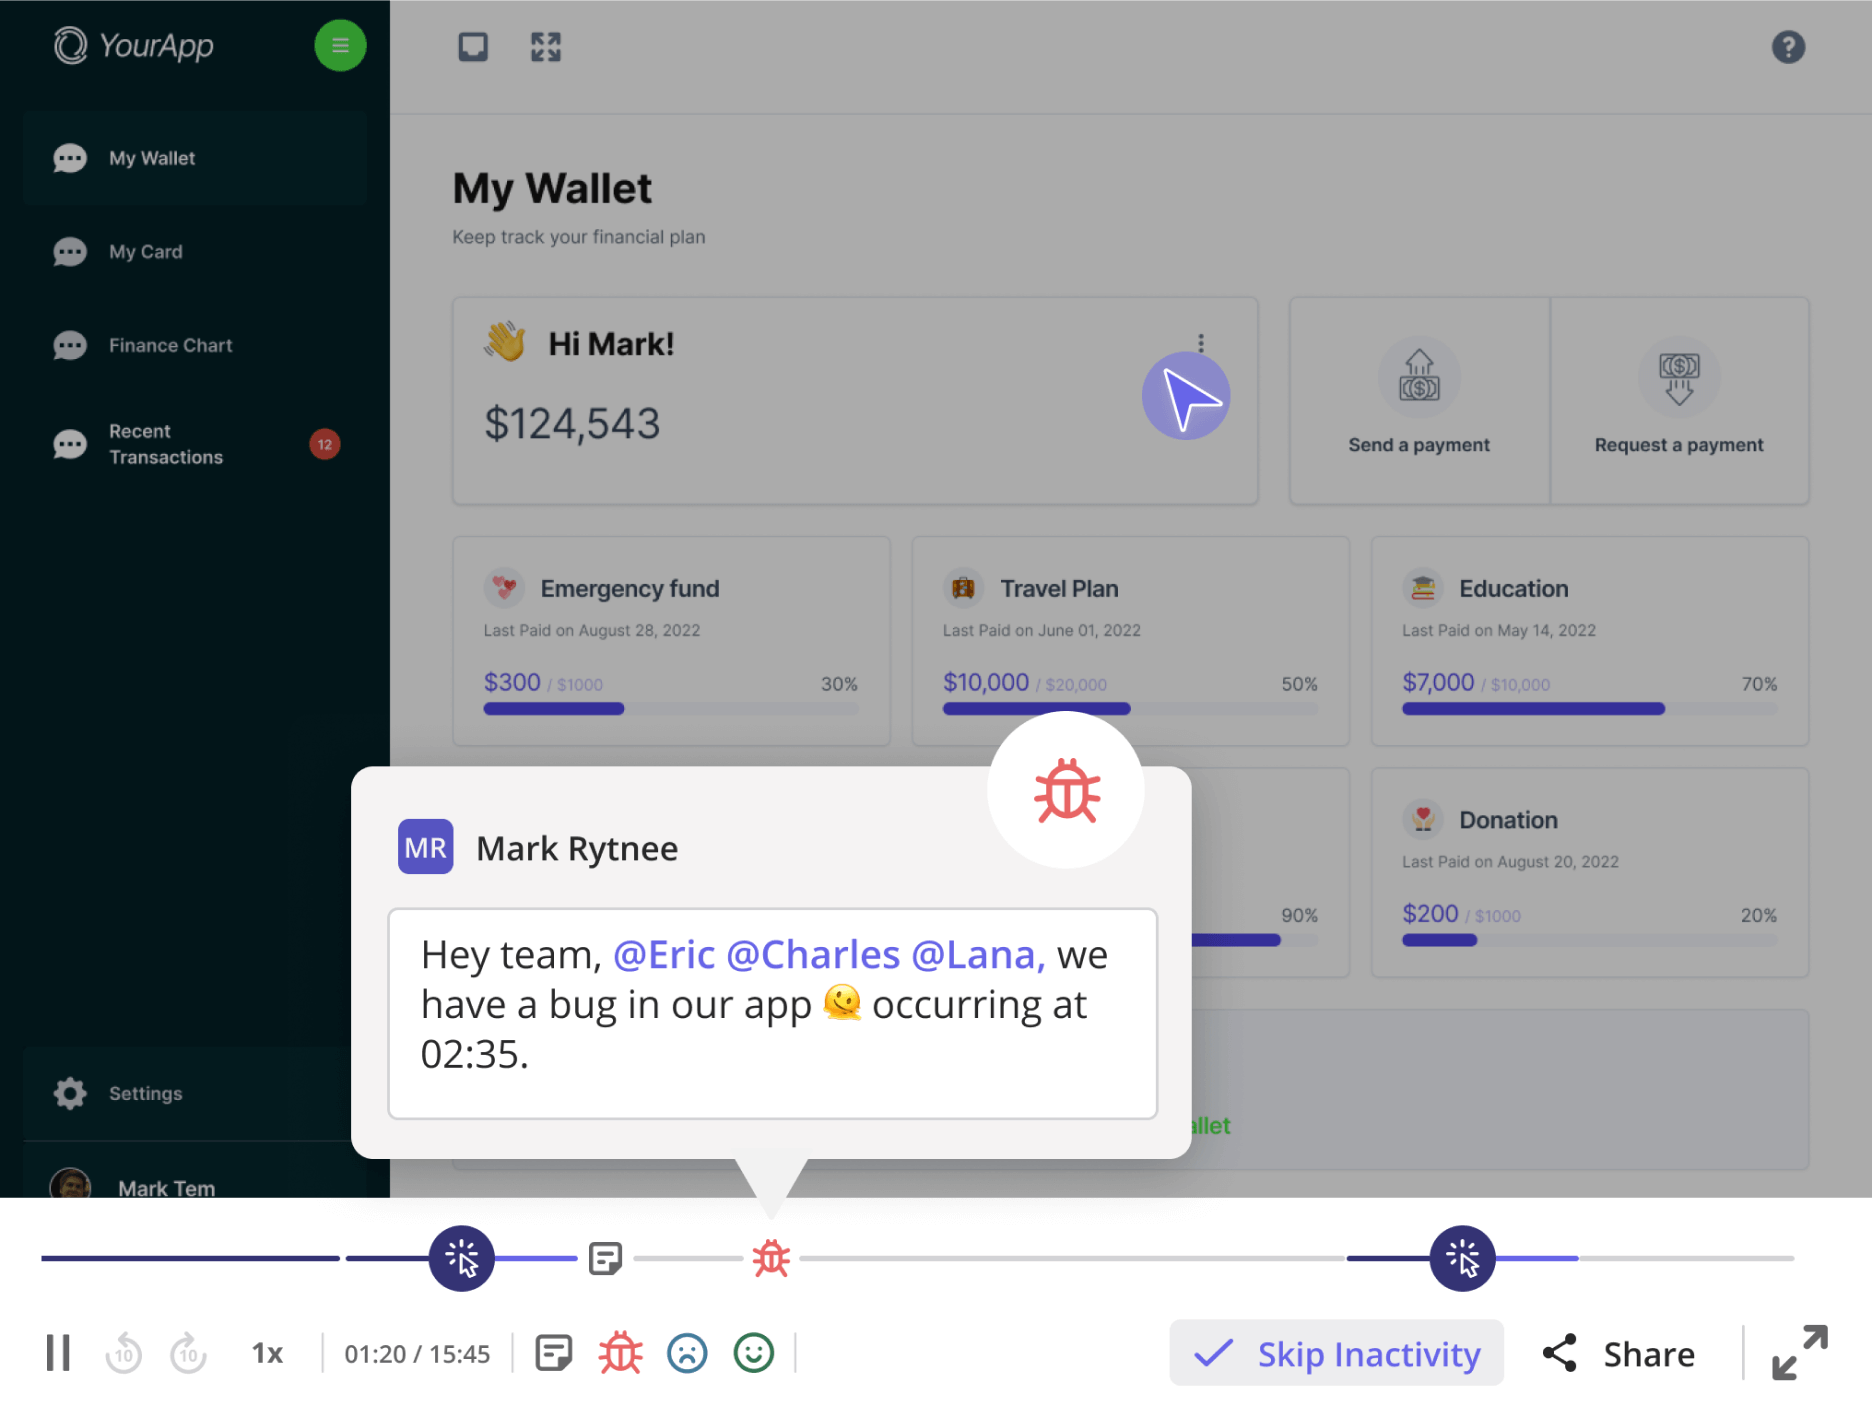
- Step 2 – Session replay: Filter replays to sessions that hit the drop-off step. Watch 10 to 15 of them and look for patterns like where users hesitate, what they click instead, and at what point they abandon?
- Step 3 – In-app survey: To find the reason behind the user actions, trigger a short survey to users who reach the drop-off step. Ask one or two questions like, “What were you trying to do?” and “What got in the way?” Understanding exactly where users encounter friction in their own words gives you the actionable insight needed to pick the right fix.
Whatever hypothesis the triage produces, treat it as an experiment. Ship the fix, track the drop-off rate, and confirm the impact before declaring the problem closed.
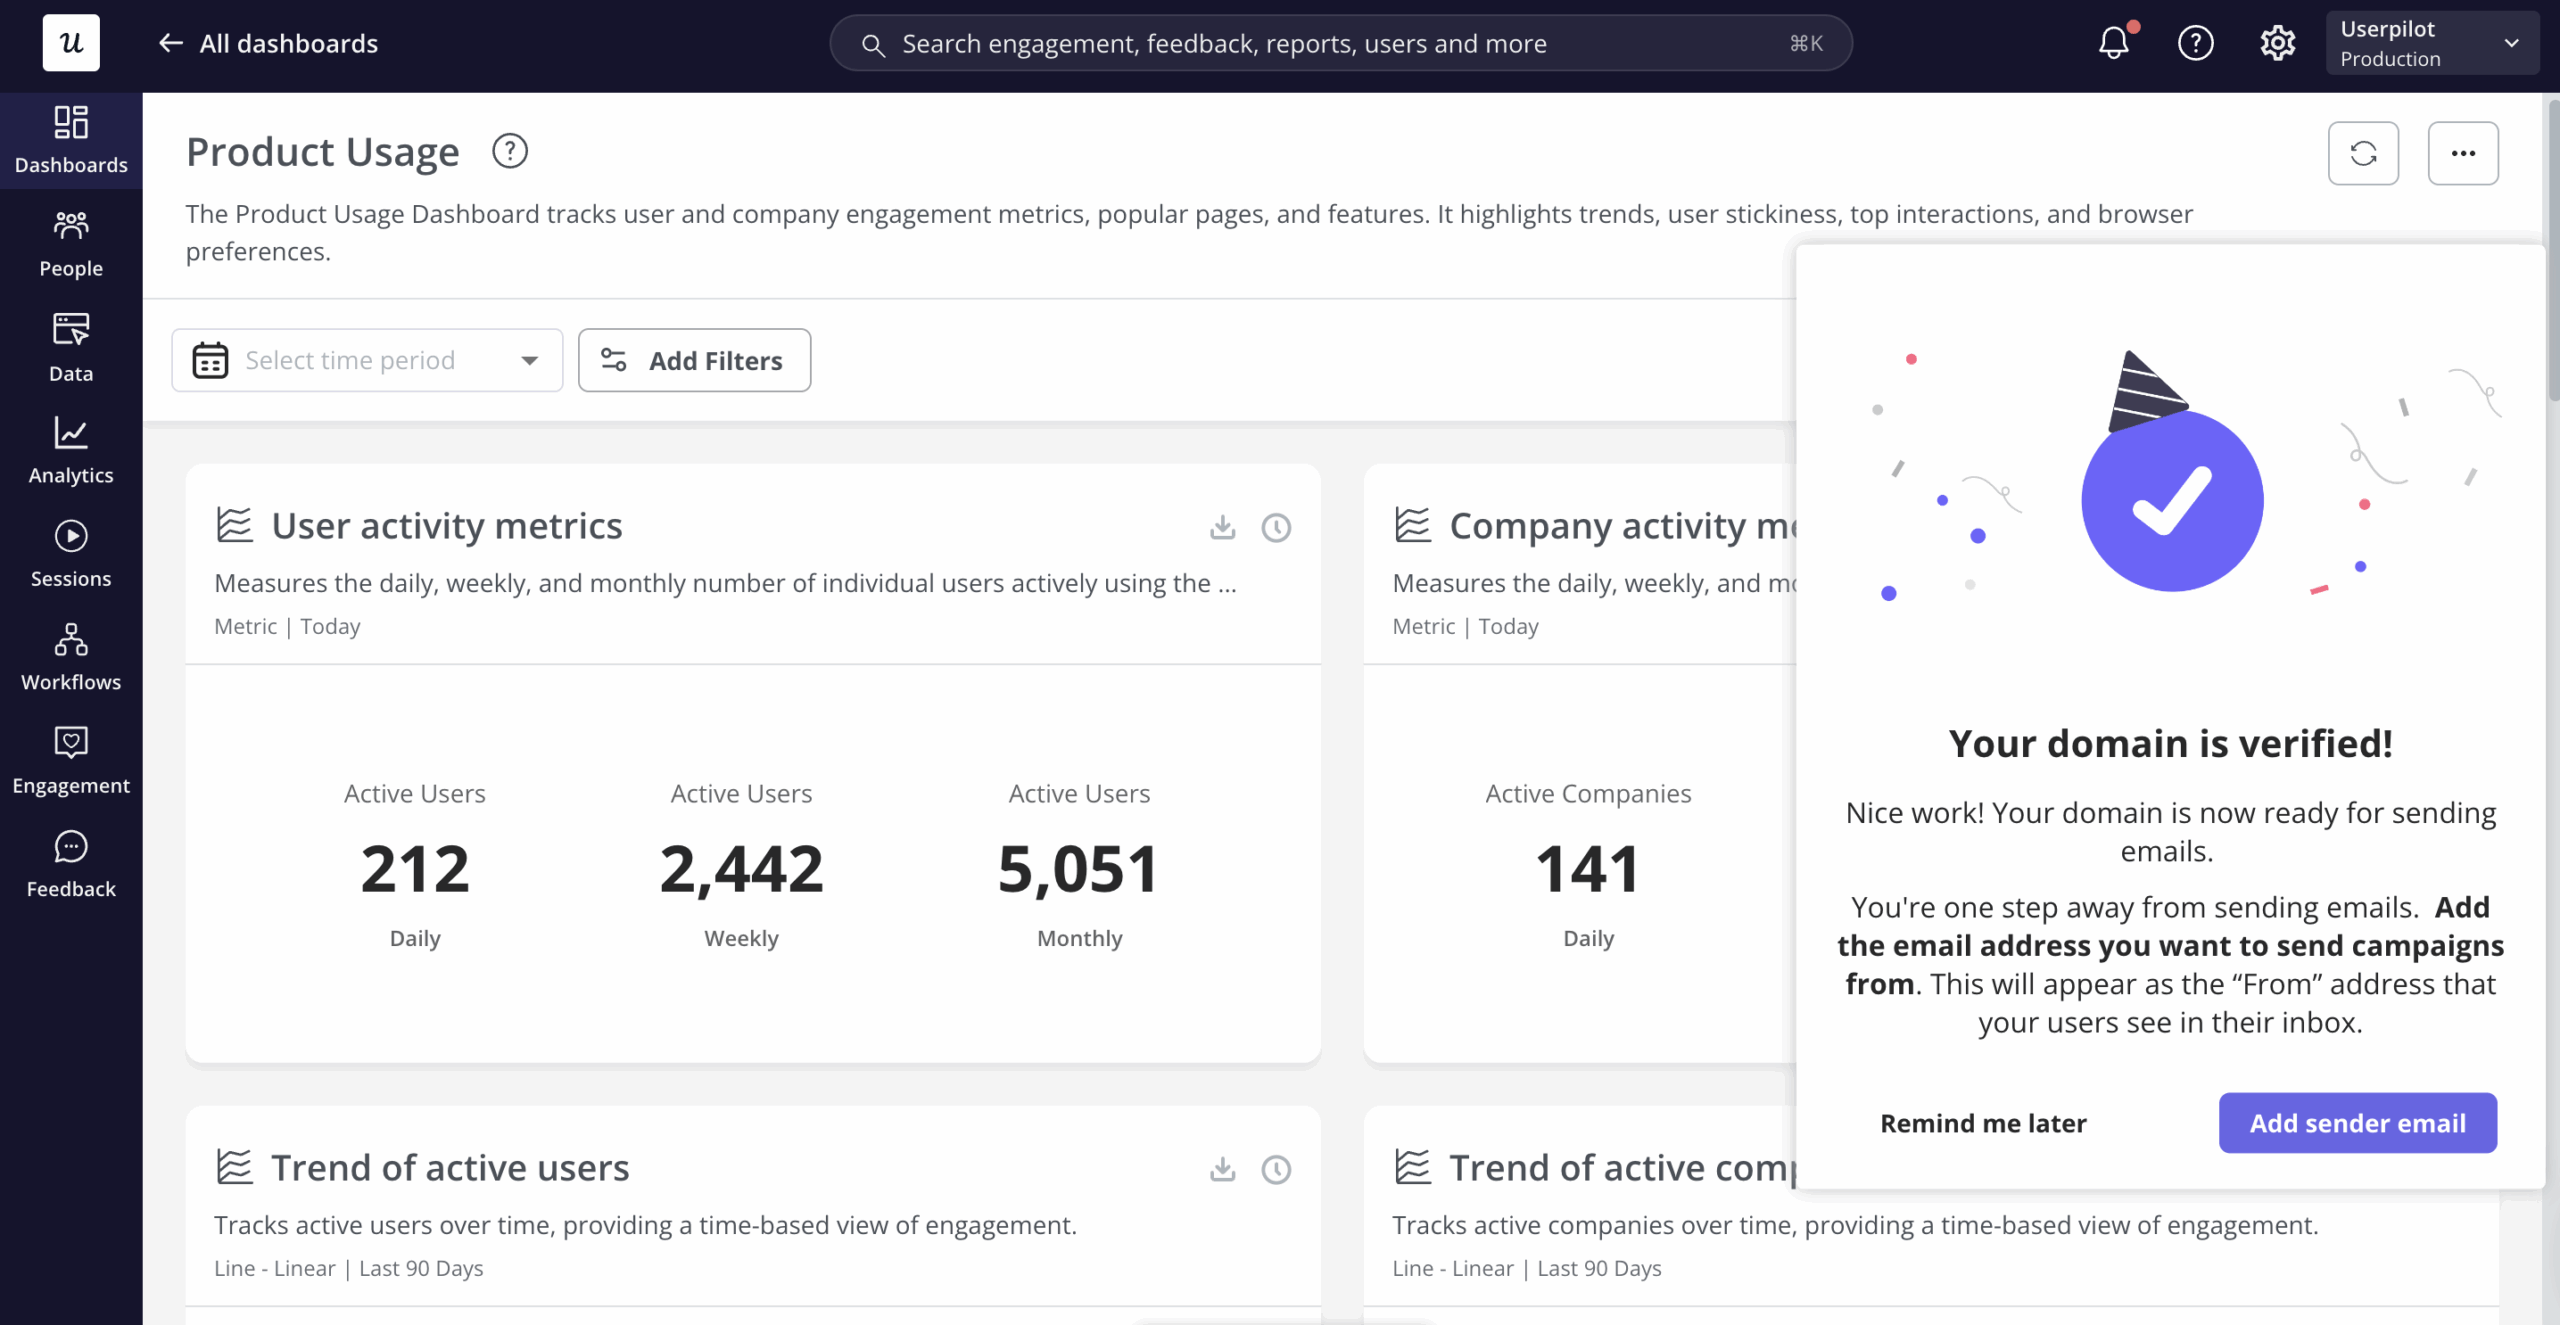
I ran this exact sequence when our email feature launched at Userpilot. The funnel showed a sharp drop-off at domain verification, but no obvious reason why. Session replay showed users landing on the verification step, pausing, and then leaving without completing it.
“Within a few hours, I just created a targeting tooltip and showed it to users and highlighted the correct steps for them to make it clear what to do next. That helped a lot to reduce friction and support users in real time without involving our dev team.”
How the traditional approach breaks with AI agents
Every standard software usage analytics method, including the one mentioned above, was designed for a human moving through a UI. Understanding where that assumption holds and where it breaks is the most important conceptual shift for product analytics in 2026.
Where the traditional toolkit breaks down
Heatmaps, session recordings, and event tracking all assume a human is generating the events. But AI agents interacting with your product through API endpoints or MCP tool calls don’t click buttons, generate heatmap data, or produce session recordings.
They generate backend API calls, task-completion signals, and conversation logs. None of these can be captured by your standard analytics stack.
This creates a specific and growing blind spot.
And the problems multiply further with the increasing velocity of features. Not only are features shipping faster than they can be measured, but the new user type interacting with those features isn’t being measured at all.
Yazan Sehwail, Userpilot’s CEO, described the velocity dimension of this problem directly when we discussed the state of product analytics this year:
“As AI is also writing code, it’s helping engineers and product teams build features a lot faster. Instead of every quarter you’re releasing one or two features, now you’re releasing seven, eight, nine. It becomes even harder for product teams to manually track each one and understand usage for each one.”
The problem compounds with certain metrics as well.
DAU/MAU ratio: A B2B user who logs in once a week to run a high-value report is worth more to your business than one who logs in daily and ignores the product. The stickiness benchmark tends to sit around 15-25% for most B2B SaaS, and chasing it pulls product decisions toward maximizing login frequency rather than outcomes.
Session length: A long session can mean deep engagement or deep confusion. Without context, the number is noise. The metric you actually want is “time to outcome.” Essentially, how long it takes a user to complete a high-value action. Total time in product is a poor proxy for that, and it breaks entirely as a metric once agent interactions (which complete tasks in seconds) start appearing alongside human sessions (which take longer).
How AI agents help speed up analytics
While AI agents complicate software usage analytics, they also simplify it.
Two new interaction patterns are replacing manual dashboard work: natural language queries that let you ask questions of your usage data without building a report, and always-on monitoring agents that surface insights without you having to look for them.
The natural language shift matters because most product usage data sits behind dashboards that require time and expertise to query. A CS manager who wants to know which accounts used a specific feature in the last 30 days and have an NPS below 7 currently needs a data analyst to build that query, or a non-technical workaround that produces something imprecise.
With an MCP-connected analytics platform, they can ask the question directly in Claude, ChatGPT, or Cowork and get an answer grounded in real product usage data, without leaving the tool.
Yazan explained the reason Userpilot built MCP connectivity into the platform when we talked about the release:
“If you as a marketer wanted to see, using session replay, NPS data, survey data, and product usage data, you’re able to get your answer without having to go to Userpilot, without having to pull data and upload it to someone. This is why MCP is going to be a game changer.”
The always-on monitoring piece goes further. Instead of checking dashboards when you have time to look for problems, an AI agent monitors your key metrics continuously and surfaces what’s shifting and why.
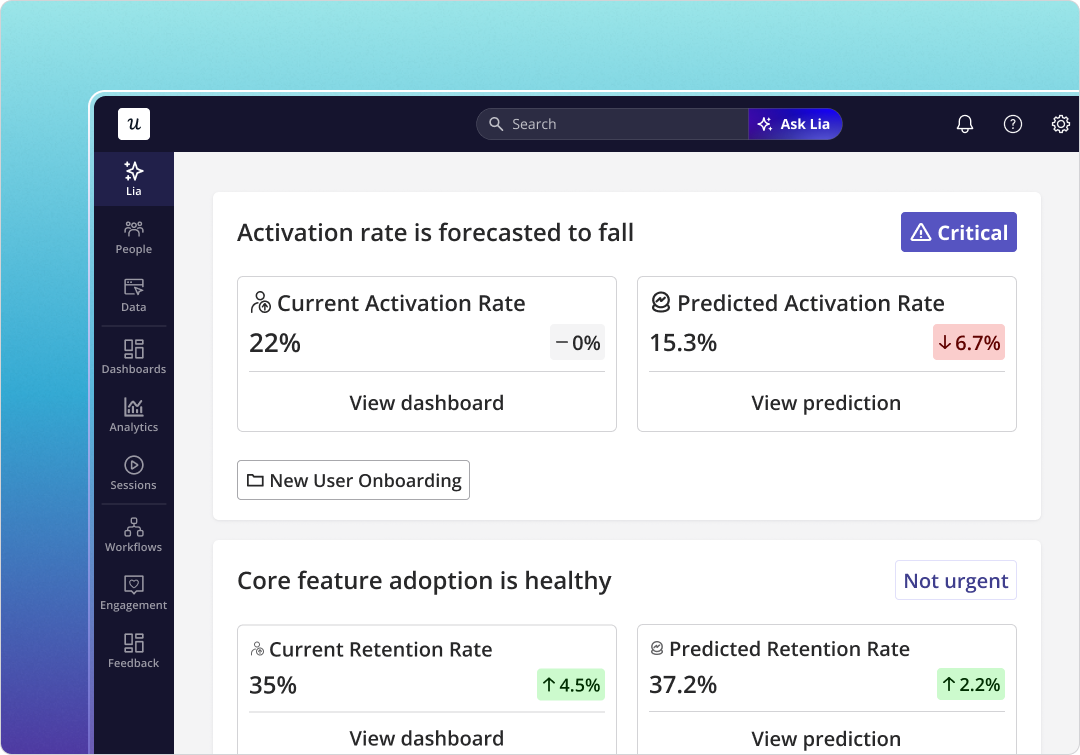
Userpilot’s AI agent Lia does this. It monitors the relevant metrics continuously, and when something shifts, such as a drop in feature adoption or a spike in agent failure rates, it surfaces the signal with its likely cause and recommended next steps. The design intent, as Yazan put it:
“You change from an operator to monitoring. You’re no longer operating. The AI is operating. You’re just basically evaluating and monitoring the agent workflow.”
Accounting for the agentic traffic
If your product has a public API, an MCP integration, or any backend access path, agents might already be interacting with it. The instrumentation for tracking their software usage is straightforward:
- Tag API endpoints and MCP tool calls as tracked events with the calling agent identified.
- Add a task completion event class distinct from feature interactions.
- Capture conversation entry points for any in-product agent.
The teams doing this in 2026 will have historical agent-stream data to work from. Teams that wait until agent volume is already large will have a gap in their behavioral data that they can’t recover.
Compliance: GDPR, CCPA, and data governance
Software usage analytics collects behavioral data on real users, which means privacy compliance isn’t optional. GDPR and CCPA both carry requirements on what you can track, how long you can retain it, and what disclosures you need to make to users. Track in-app behavior through platforms with built-in compliance infrastructure (SOC 2, GDPR alignment, CCPA coverage) rather than custom tracking that bypasses consent mechanisms.
Regulated industries carry additional requirements beyond this baseline, so check with your legal team before instrumenting anything new.
Data governance at the team level matters as much as legal compliance. Clear ownership of your event taxonomy, documented definitions of each metric, and shared understanding across product, CS, and marketing of what “activation” and “active user” mean in your context. This is what separates analytics that actually improves business decisions from analytics that generates conflicting custom reports nobody trusts.
Start tracking your software usage
Software usage analytics helps you design products that resonate with your user base and enable them to gain value from them quickly. Ultimately, you retain more users and drive your revenues up.
If you’re ready to see how this works in practice, book a Userpilot demo. We’ll walk through how product analytics, session replay, in-app engagement, and Lia work together from a single platform, so you’re not maintaining separate tools for tracking and driving engagement.
About the author