Revenue Growth Rate Isn’t a Synonym of Growth: Here’s What to Track in 2026


For years, teams would read a high revenue growth rate as a projection of a company’s future, a cue for executives to feel that everything is going well, and a trigger for VCs to do another round of investment.
But that assumption couldn’t be further from the truth. As a metric, revenue growth rate tells you how fast your company grew over a given period, but it doesn’t tell you how fast it will grow next year. The benchmarks show that companies that scale are actually better at other metrics (e.g., revenue retention and expansion). Plus, shifts to usage and outcome-based pricing models are making revenue growth more inconsistent from quarter to quarter.
So, for this guide, I’ll go over what revenue growth actually means, how you should treat it, and the factors that foster product growth.

Is revenue growth rate really a growth predictor?
Revenue growth rate measures the percentage change in your revenue between two periods. The formula is: ((current period revenue – previous period revenue)/ previous period revenue)*100
So if your total revenue was $100,000 in 2024 and $120,000 in 2025, your company’s revenue growth rate is ($120,000 – $100,000) / $100,000 x 100, which results in 20%. You can run the same revenue growth rate formula monthly, quarterly, or year-over-year.
A good revenue growth rate depends on the stage and size. Startups tend to have higher percentages in their early stages, while mature companies settle into steadier, lower numbers as they capture their market.
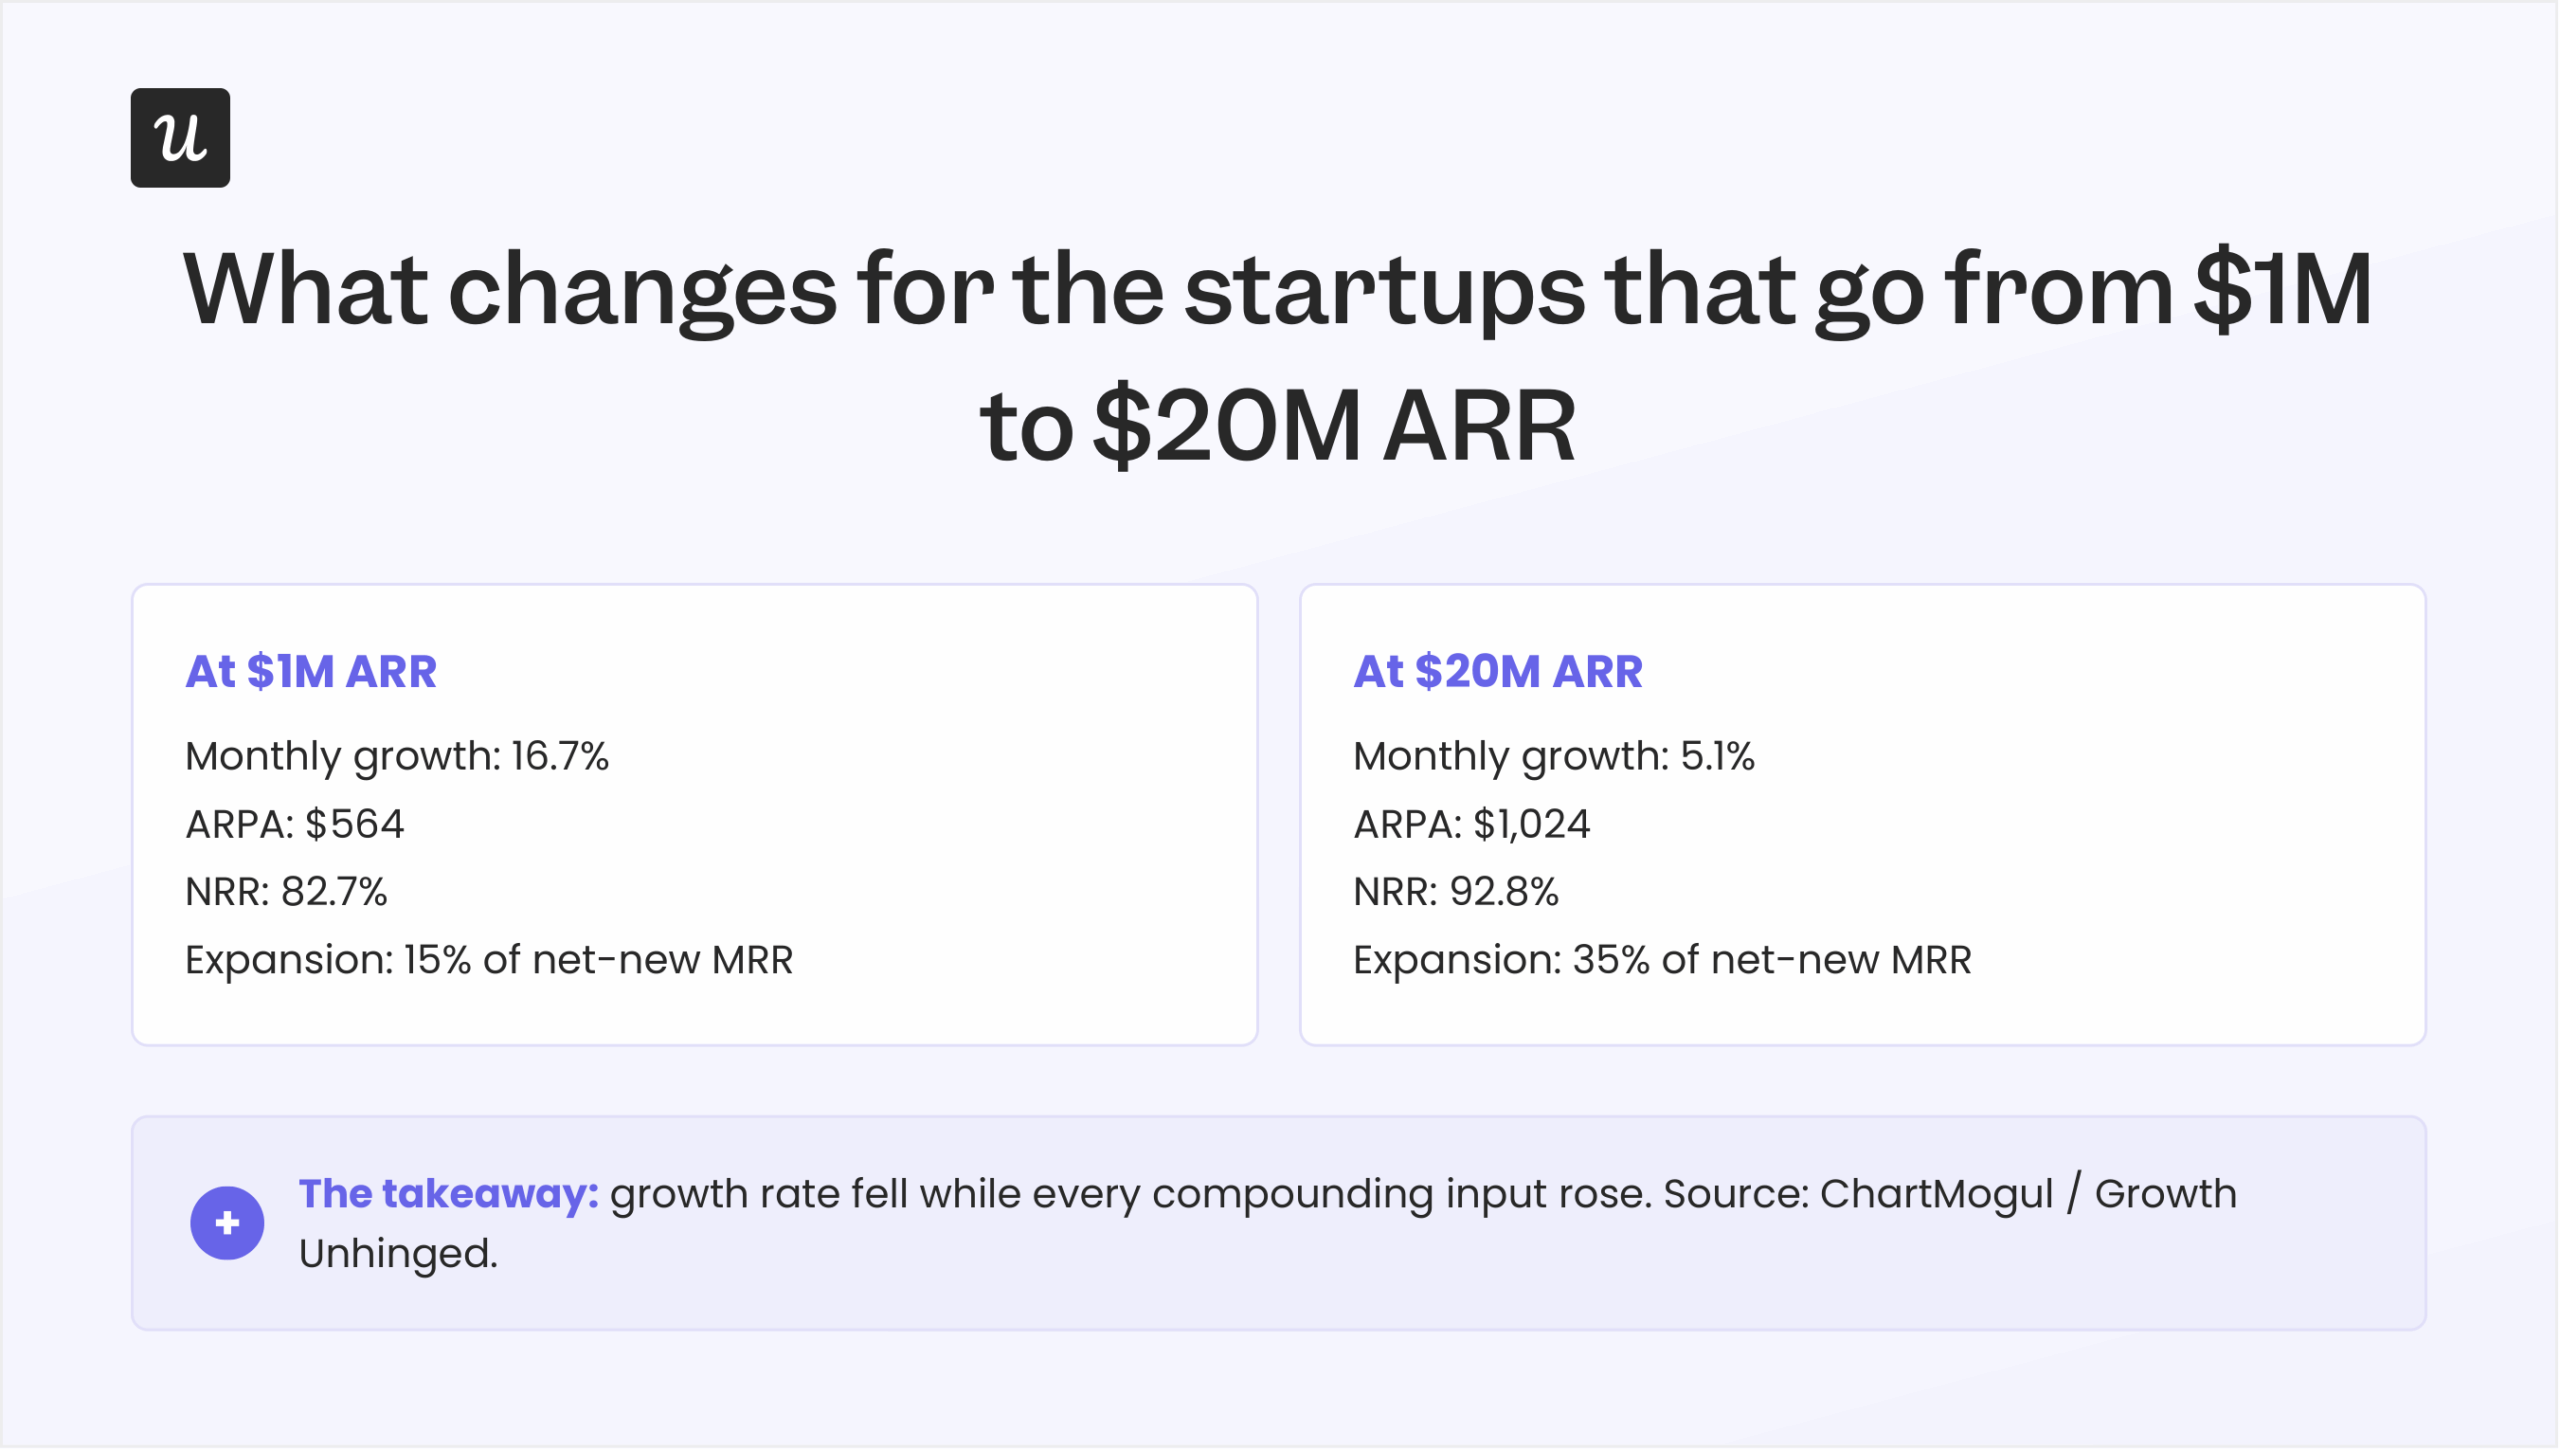
According to the benchmarks, companies that reach real scale tend to decelerate on their way there. Kyle Poyar, founder of Growth Unhinged, found that only about 3.5% of startups reach $20 million in ARR within 10 years, and those that made it saw MRR growth fall from 16.7% to 5.1%. So, although higher revenue growth was key during their early stages, it’s not an indicator that separates these companies from the rest.
This is why I treat revenue growth rate as a reference, not a projection. A high percentage confirms that growth is happening, but it doesn’t correlate with compounding growth. In fact, metrics like NRR, CAC payback, and expansion revenue are better predictors of growth.
Poyar compared the “outlier” startups vs the “normie” ones, and the difference was not a better growth rate. In his words:
“The winners didn’t necessarily start better. They became better. They changed their stripes, improving their revenue mix, monetization power, and retention. And they watched as the improvements kept compounding.”
The role of revenue growth rate today
Now, none of this means you should stop tracking revenue growth. It’s still an essential indicator of healthy growth, and a sharp decline is still a sign that something might be going wrong.
The difference is how you act on it. A revenue growth rate is a lagging metric of decisions you made one or two quarters ago, not a score to optimize. In practice, that means using it like:
- A pacing check: Compare your rate to your stage and ARR band, rather than trying to push it higher every quarter regardless of cost.
- A trigger to investigate: An unusual decline in growth rate could be a signal to look at retention, expansion, and CAC payback before touching spend.
- Part of a broader view: Track it next to profitability and NRR, so you can see if growth is coming from a sustained system rather than overspending on acquisition.
Additionally, revenue growth rate is also useful for the Rule of 40, which says that a business is growing healthy when the sum of the growth rate and EBITDA margins is close to 40 (in percentage). And although it’s very rare to pass the test (only about a third of software companies do), it can serve as an indicator of efficient growth.
The metrics that lead to compounding revenue growth
If revenue growth rate is the thermometer, these are the factors that change the temperature. Each of these metrics is a better predictor of growth and serves as a great complement to the revenue growth rate.
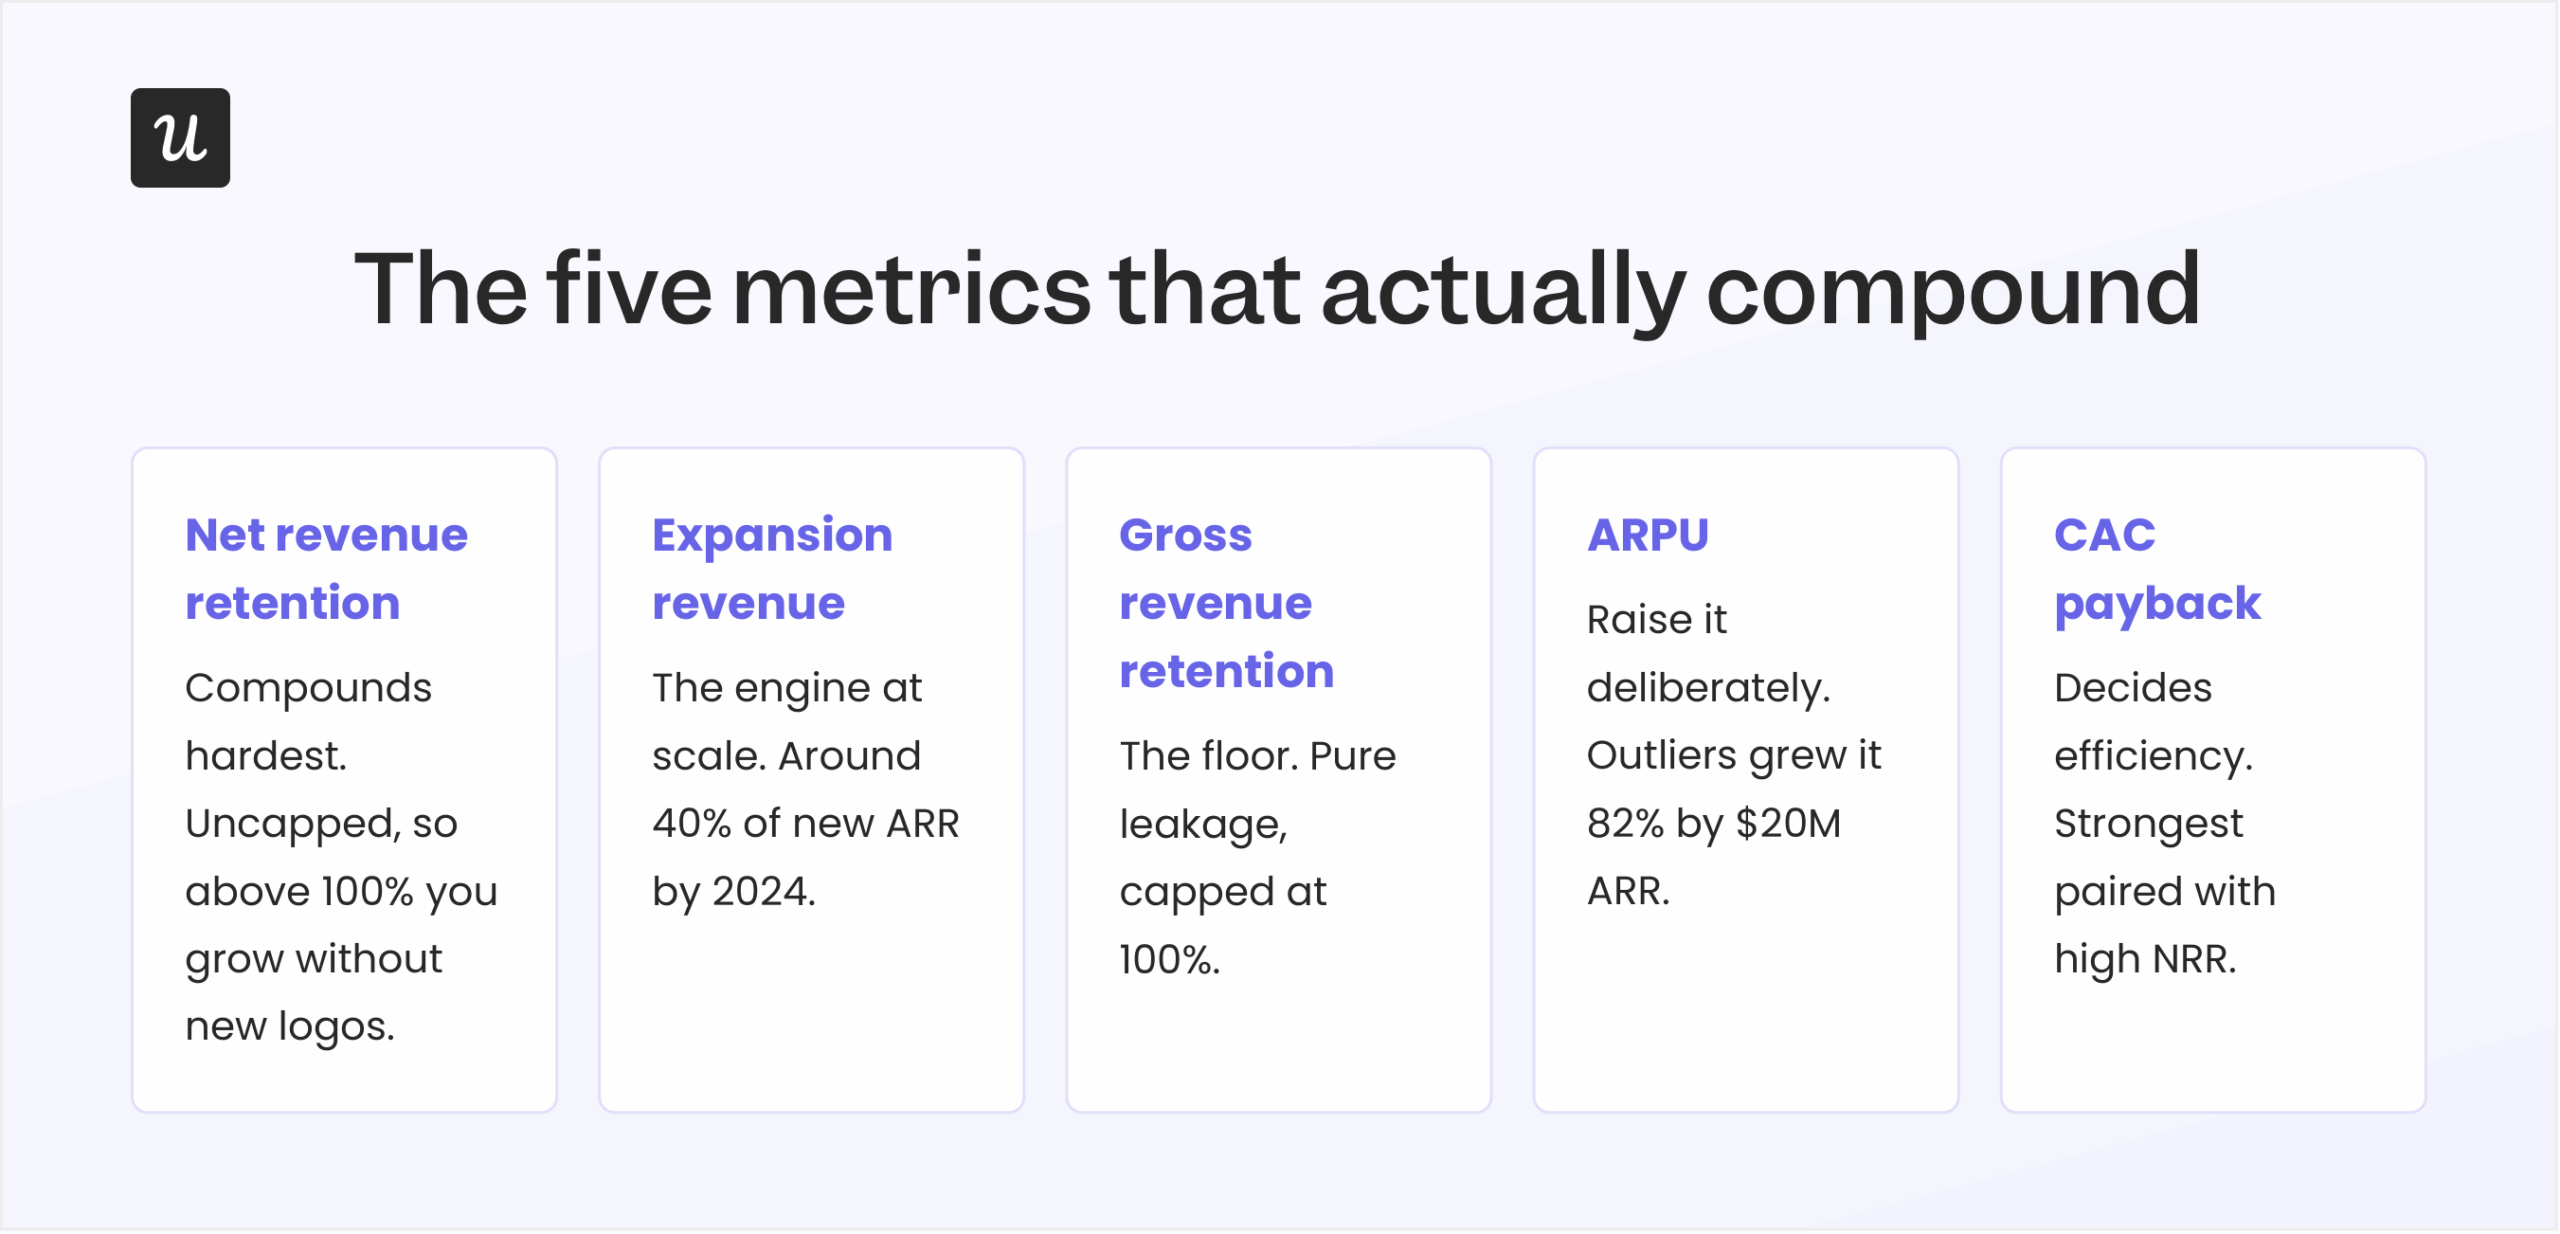
Net revenue retention
Net revenue retention measures how much recurring revenue you keep and grow from existing customers. The formula is: (beginning ARR – revenue churn – revenue contraction + expansion) / beginning ARR.
Unlike revenue growth, NRR is uncapped and leads to bigger compounds. A company with an NRR above 100% grows its revenue base without acquiring a single new customer. ChartMogul’s retention research shows that companies with net retention above 100% grow at least 1.5 to 3 times faster than their peers.
As a reference, data from Benchmarkit show the median NRR slipping from 105% in 2021 to 101% in 2024, which means that simply holding above 100% is an above-median result.
How to improve net revenue retention
The key to a healthy NRR is to minimize churn and maximize expansion.
For this, I recommend continuously monitoring account health and acting in two directions. First, catch contraction and churn risks before they happen, then reach out to those at-risk accounts to help them and prevent churn. Second, spot accounts that are ready for expansion (e.g., users who are pushing their plans to the limit, or accounts that are growing their team), then send them upsell prompts to encourage them to upgrade their plan.
Expansion revenue
Expansion revenue is the additional recurring revenue you earn from existing customers through upsells, cross-sells, and upgrades.
Benchmark data from Maxio showed expansion climbing from about 25% of new ARR in 2022 to 40% in 2024, becoming the central component of growth rather than a supplement. This data means that, past a certain size, most of your growth should come from existing customers, which makes expansion as important as acquisition.
How to improve expansion revenue
In my experience, upgrade prompts work best when they appear the moment a user needs them most.
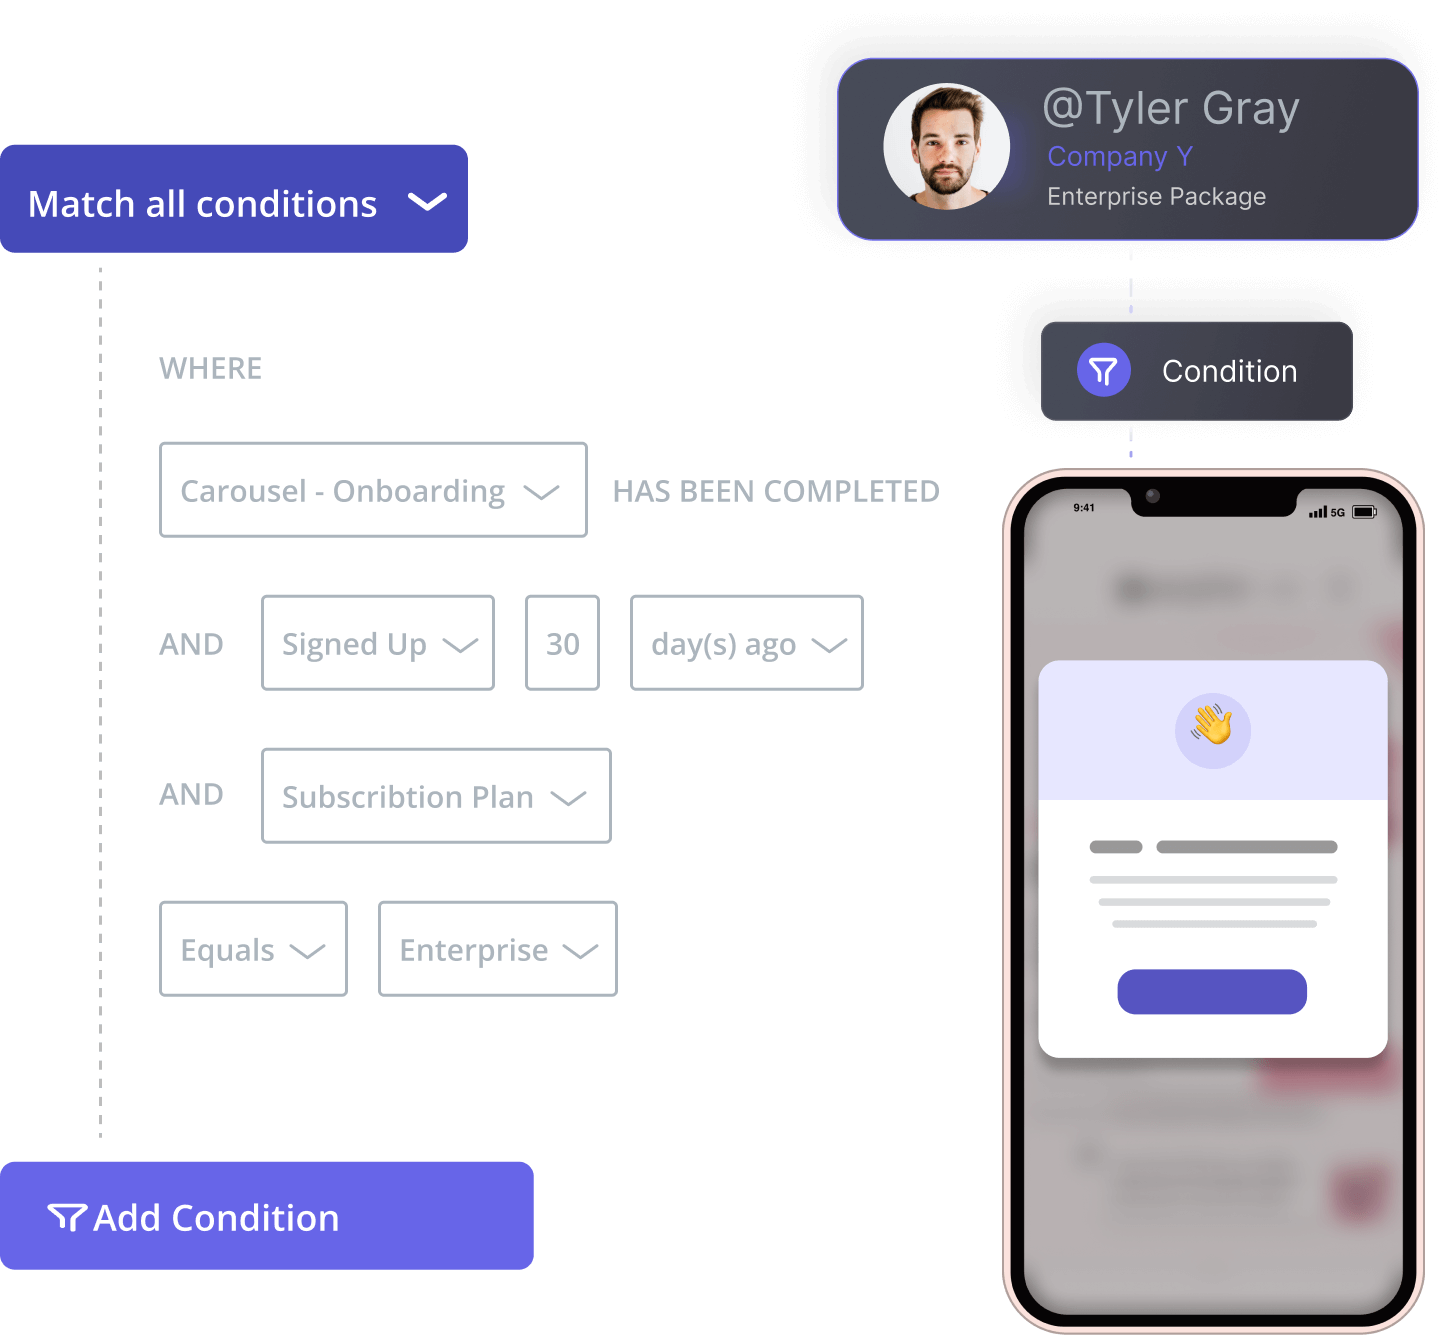
My recommendation is to trigger expansion off behavior, so the prompt appears when a user hits a plan limit or adopts a feature that signals they are ready for more. With Userpilot, for example, you can trigger a contextual in-app upgrade prompt at that exact moment, then treat each prompt as a test rather than a fixed campaign to maximize conversions.
Gross revenue retention
Gross revenue retention uses the same calculation as NRR but excludes expansion, so it caps at 100% and measures the percentage of revenue you lose to churn.
It’s a necessary metric for growth. A reassuring 105%+ NRR can sit on top of a churn rate that is quietly dragging gross retention down to 90%, and that kind of growth falls apart the moment one large account leaves. Watching GRR alongside NRR is how you differentiate good expansion from expansion that is papering over a hole.
How to improve gross revenue retention
Improving GRR is almost the same as improving NRR, just focused on churned revenue.
Thus, my approach is the same: to find at-risk accounts and ask CS to reach out. A more scalable method is to follow product usage to the exact step where accounts stall, then fix friction in the product directly. For example, when our email feature launched, the funnel showed a sharp drop at the domain verification step. So, rather than queuing an engineering ticket, I built a checklist and a targeting tooltip inside Userpilot in a few hours, highlighted the correct steps, and the drop-off closed within days.
Average revenue per user (ARPU)
Average revenue per user is your recurring revenue divided by the number of active accounts.
It’s one of the most impactful levers for growth. The ChartMogul growth-levers data shows the best companies grew ARPA by 82% and NRR by 10 points on the path to $20 million ARR, while the companies that stalled improved far less.
How to improve ARPU
You can’t improve ARPU with a single annual price hike. Instead, I recommend focusing on expanding your product’s value (e.g., through new features, expanded limits, more generous plans), and once your users have perceived that value, you can increase the prices through new pricing models, packaging, and well-timed upsells.
CAC payback decides whether any of this is efficient
Customer acquisition cost is the average cost to acquire a paying customer across sales and marketing, and CAC payback is the number of months of revenue it takes to recoup that cost.
The economics of CAC are tough. In the 2025 benchmarks, the median company now spends about two dollars in sales and marketing for every dollar of new ARR, with CAC increasing roughly 10% since 2022. These costs make payback the metric that determines whether growth is affordable.
These costs are also why CAC payback and NRR work as a pair rather than as separate metrics. High Alpha’s 2025 data show that companies pairing high NRR with low CAC nearly double their growth rates and Rule of 40 scores versus peers with weaker retention or longer payback periods. The logic is simple: strong retention adds more revenue after the acquisition cost is recovered, while weak retention means you are refilling a leaking bucket no matter how cheap each new customer was.
How to improve CAC payback
The worst way to reduce CAC payback is by cutting acquisition spend. Cheaper acquisition that brings in poorly fit accounts makes payback worse, not better.
What I’d recommend is to reduce time to value, because reducing the time it takes to realize value won’t only increase retention, but also shorten the payback period without increasing spend. To reduce it, I use Userpilot to implement onboarding that gets a user to first value in days instead of weeks, using tools like Userpilot to add in-app walkthroughs, checklists, hotspots, etc.
How to keep a revenue growth rate healthy enough to compound
As I mentioned, the metrics above are better predictors of growth and serve as great complements to revenue growth rate. But what other factors are directly affecting compounding growth?
Here are some of those factors based on the research:
Reducing churn
We all know churn is bad. But churn runs beneath everything we have already covered; it determines how much of your retention, expansion, and acquisition actually survives.
It’s also the lever with the most upside. In the same compounding-startup analysis, Poyar found that reducing churn had the single biggest impact on revenue growth, ahead of raising prices or acquiring more customers.
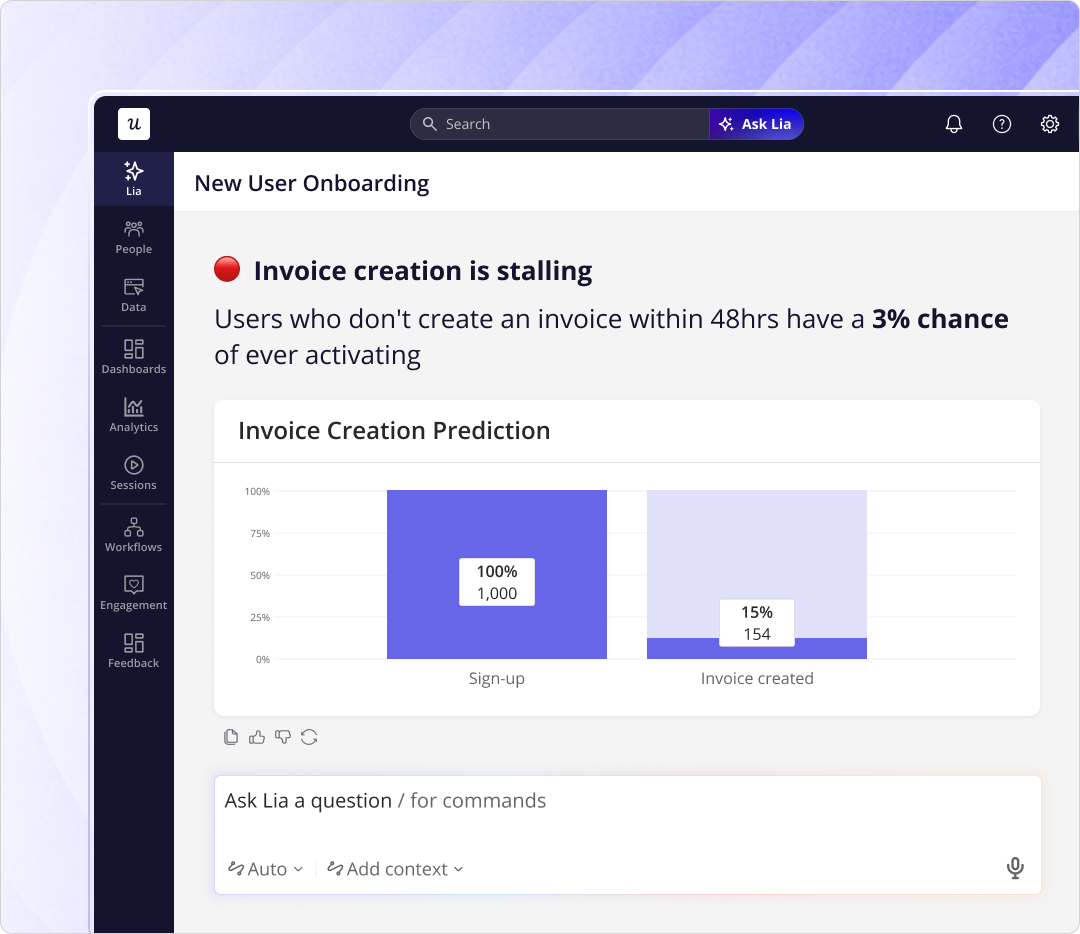
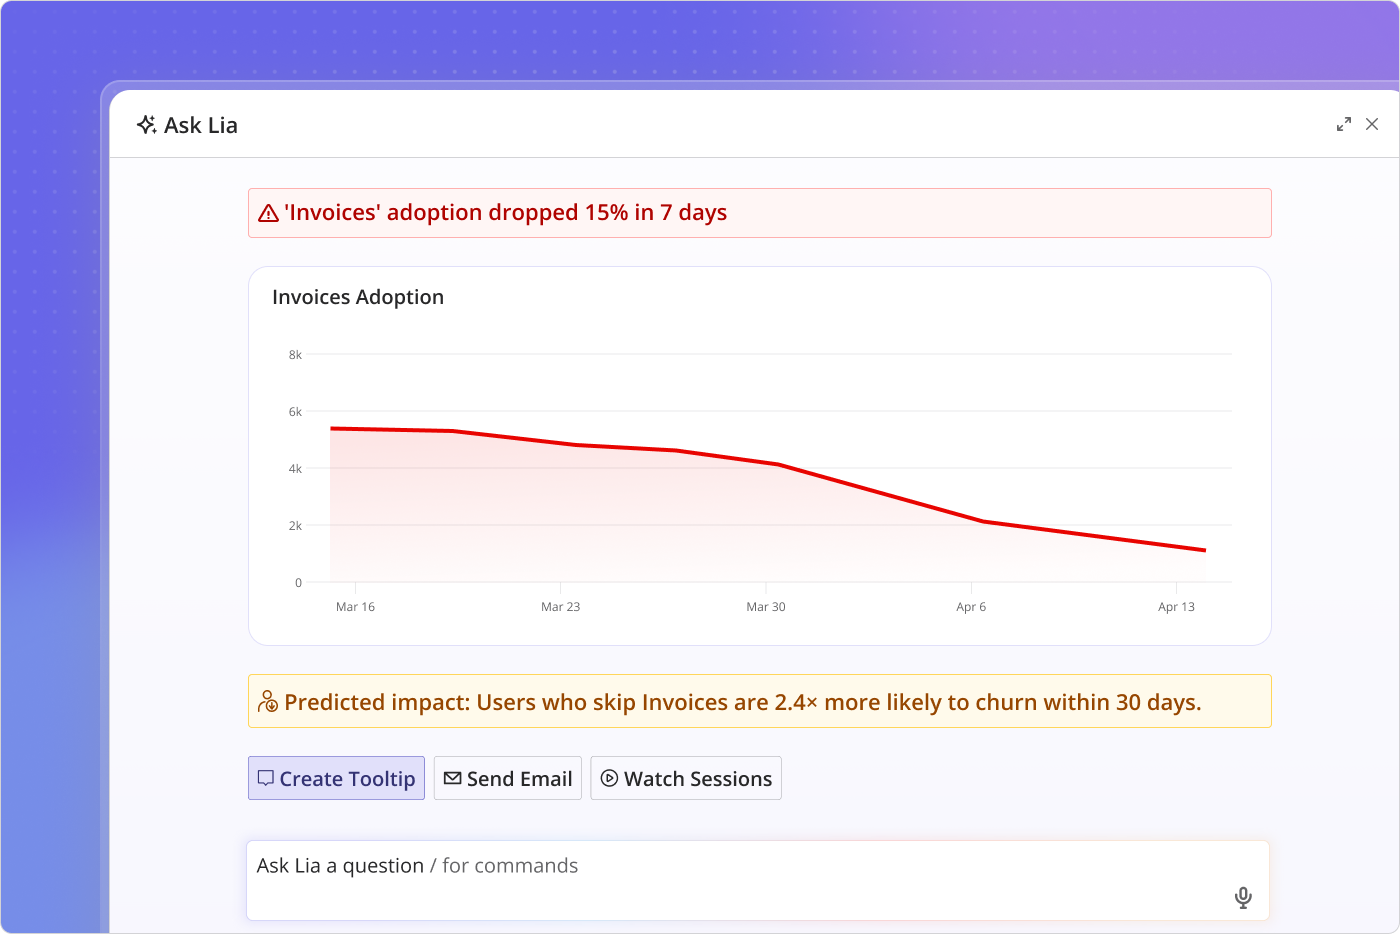
For this reason, predicting churn early is the difference between saving an account and adding another churned customer. In Userpilot, for instance, we can set up Lia to read the usage trendline for each account, flag usage drops in advance, and trigger an in-app intervention or alert while there is still time to act. This way, our team can work from a forecast rather than a post-mortem.
Increasing prices while increasing value
Pricing, although clearly impactful, is not easy to get right. Teams tend to worry that a higher price will spike churn or stall new deals.
But that caution is expensive, because in Poyar’s compounding-startup modeling, raising prices for new customers alone roughly doubled the annual growth rate from 11% to 24%. And as of now, more companies are making pricing changes than ever, with the PricingSaaS Q2 2026 report finding that one in five SaaS companies made an AI pricing change in the first quarter of 2026.
As I said when discussing ARPU, the best way to raise prices without a backlash is to increase the perceived value of your product. In the PricingSaaS report, vendors are cutting free AI credits and packaging AI agents as their own paid SKUs. They’re pricing the new AI products as a distinct line to give the customer a visible reason to more, which is what separates a value-led increase from a straight hike.
Adopting a hybrid pricing model
The traditional seat model is under real pressure as AI agents start doing more work per license, and the companies’ responses have been aggressive. Here’s how Elena Verna, head of growth at Lovable, talked about the model most AI products defaulted to:
“With new technology comes new pricing models, but oof, do I hate the one we’re all using right now: AI Credits.”
But instead of going fully usage- or outcome-based, most SaaS companies are converging on a hybrid model: a base subscription paired with usage- or outcome-based components. The evidence behind it is strong, with OpenView finding that hybrid models are now the most common approach. Plus, usage-based public SaaS companies grew 54% more in revenue than the broader index, which the post attributes to superior CAC payback and net dollar retention.
A hybrid structure maintains the predictability of recurring revenue while increasing revenue through usage-billed features.
Increasing the acquisition of users you can retain
Although it’s compelling to bash at aggressive acquisition, most teams focus on acquisition for a valid reason: it works!
In Poyar’s model, increasing acquisition by 50% added about $5.4 million in ARR over three years. However, 50% more in acquisition doesn’t sound as achievable as raising prices. If you look at Poyar’s model, the impact on ARR is significantly behind that of reducing churn and raising prices.
So even though customer acquisition is definitely essential for growth, it must target the right customers. Acquisition costs are sky-high; you must focus on targeting good-fit customers who are more likely to retain and expand, so the CAC payback period is optimal and your budget doesn’t fall into a hole.
Grow revenue, but build the engine that keeps it growing
Revenue growth rate is not a number you should try to push up forever in isolation, and as I proved, it’s not a predictor of growth.
It’s still the main sign that healthy growth is happening, however, which is why it earns its place at the top of the board deck.
On the other hand, focusing on retaining and expanding customers produces steadier revenue growth and a far better shot at $20 million ARR. So if you want to build a retention engine to optimize growth, book a Userpilot demo so our team can walk you through these metrics and growth strategies.
About the author