Time to Value (TTV): Definition, Formula, and 6 Ways to Reduce It in 2026


The foundational question that makes TTV measurable is defining what counts as “first value” for your specific product. Most teams have never answered that precisely enough to track it, which makes TTV a concept to talk about rather than a metric to act on. The failure mode looks the same across nearly every customer conversation I have. A team iterates on their user onboarding experience for an entire quarter: better checklists, rewritten welcome emails, new A/B tests on the first session. Three months later, activation hasn’t moved, and when I ask what event they’re using to define it, I hear “completing setup” or “logging in twice.”
Neither of these counts as “first value” since they’re merely prerequisites to using the product rather than a moment where users derive genuine value from it.
Userpilot’s Benchmark Report 2025, analyzing data from 547 SaaS companies, found the median time to value sits at 1 day, 12 hours, and 23 minutes. Every hour a user spends after signup without reaching that first value moment is an hour they’re building uncertainty about whether your product is worth their continued attention. That benchmark only becomes actionable once you know exactly what you’re measuring. This guide will teach you how to define and validate your first value event precisely enough to track it. From there, we’ll cover the formula, industry benchmarks, diagnostic metrics, and six strategies to reduce time-to-value for new users.

What counts as “first value”? Defining your TTV activation event
The most common mistake in TTV conversations is treating the first value event as a label rather than a measurement specification. Teams pick an event from their onboarding checklist, name it their activation milestone, and move on without checking whether users who reach that event actually retain at higher rates than those who don’t. That one check is the difference between an arbitrary checkpoint and a meaningful signal.
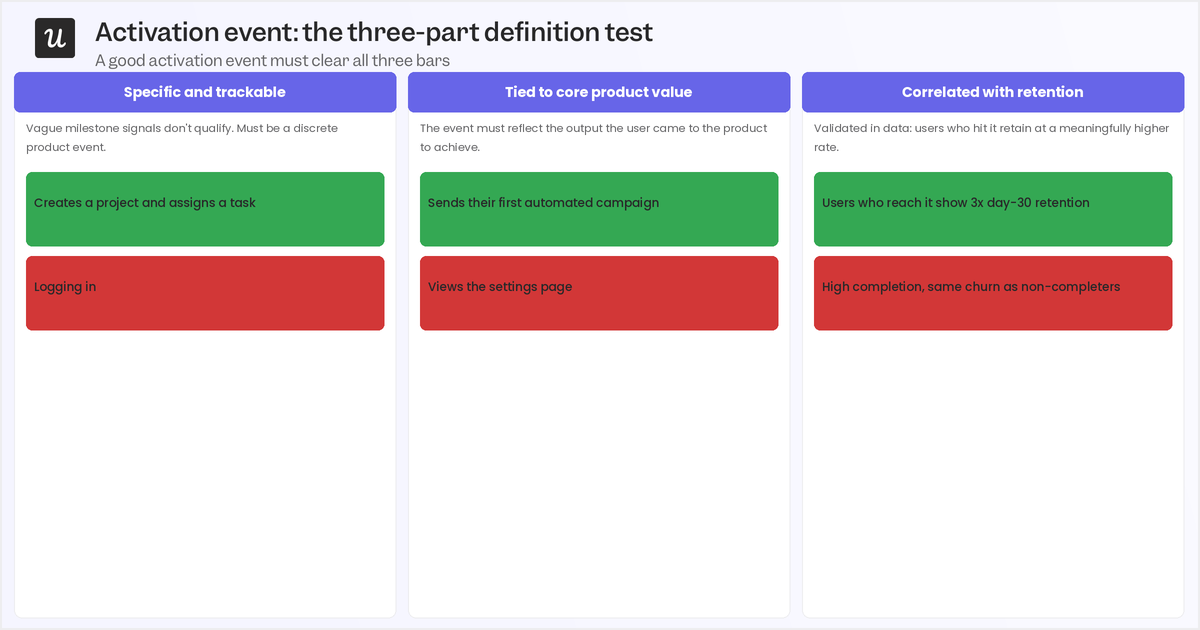
A genuine first value event must be specific and trackable, generating a behavioral signal your analytics can capture rather than a vague outcome like “understood the product.” It must also be tied to core product value, meaning it reflects the user solving the specific problem they signed up to solve, not a setup step that just happens to be mandatory. Lastly, it must be correlated with retention, meaning users who reach this event should retain at meaningfully higher rates than those who don’t.
Examples make the criteria concrete. A project management tool’s first value event is creating a project and assigning at least one task, not just opening the app. An analytics platform is generating a report with a usable insight, not connecting data sources. A CRM’s first value event is adding a contact and logging an interaction. Each example is specific, measurable, and tied to the job-to-be-done that brought the user to the product, rather than to the administrative steps that happen to surround it.
Two related metrics are worth briefly distinguishing. Activation is binary: a user either completes the defined first value event or they don’t. TTV answers the time dimension of that same event, telling you how long it took the user to get there. In contrast, the ‘Aha!’ moment is the subjective emotional recognition that the product is worth using, which often happens before the measurable first value event (such as during a demo or trial). TTV is functional because it measures how long it takes for the product to deliver on the promise that the aha moment made.
Finding your activation event candidate means looking at the behavioral difference between users who retained and those who churned. Which action did users who became long-term customers consistently complete in their first session, while churned users usually skipped it? That behavioral asymmetry is where your candidate event lives. Validation runs through cohort analysis: split users into those who completed a candidate event within 48 hours and those who didn’t, then compare 30-day retention rates between the two cohorts.
A 10 to 15 percentage point retention gap is a strong signal that you’ve found a genuine first value event. Anything smaller suggests the event is too upstream of actual value, and you need to look further down the path.
How to calculate TTV (and how it benchmarks by industry)
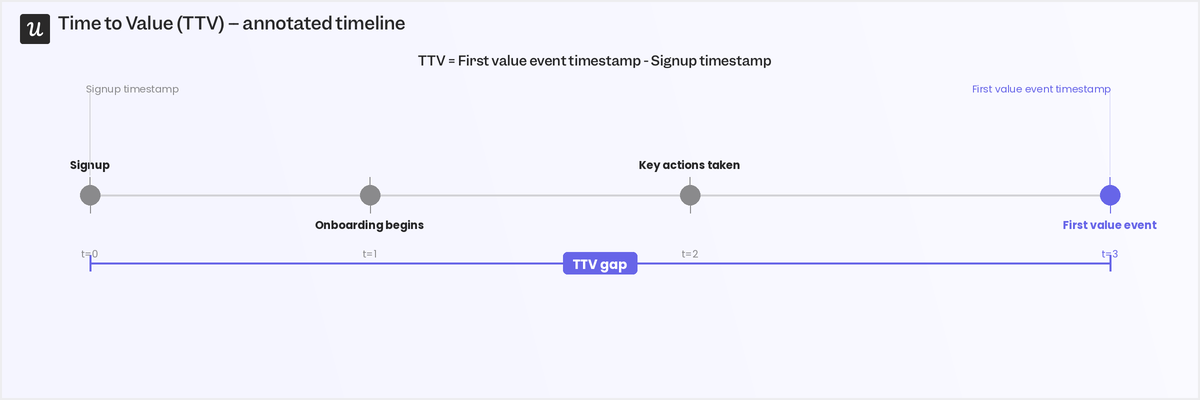
Once you have a precise first value event, the TTV formula is straightforward. Subtract the signup timestamp from the first value event timestamp, and you have elapsed time from account creation to the first meaningful product value. The inputs sound simple, but the calculation falls apart if you’re measuring a vague or proxy event, which is why the definition work comes first.
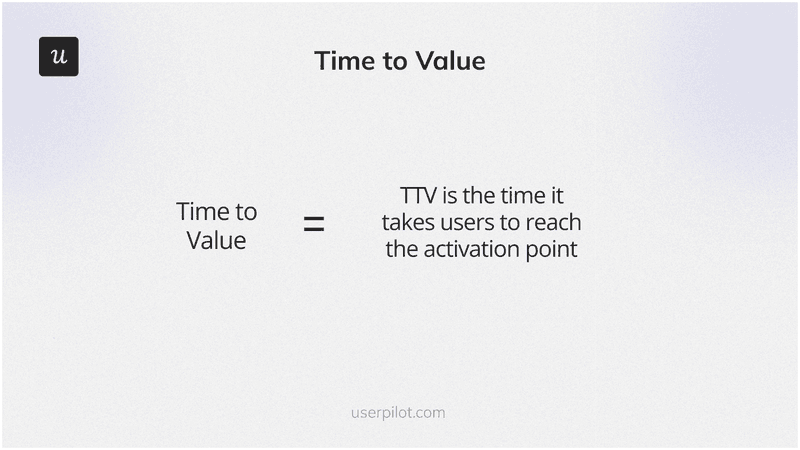
The signup time is self-explanatory since it’s just the account creation timestamp or trial start date. First value event is a specific, trackable action that proves a user has experienced meaningful product value.
Benchmarked against your industry, TTV tells you whether you’re delivering value at a competitive pace or losing users to friction points you haven’t diagnosed.
The table below comes from the 547 SaaS companies analyzed in the 2025 edition of our Benchmark Report:
| Industry | Average TTV | Median TTV | Safe range |
|---|---|---|---|
| CRM & Sales | 1 day, 4h 43m | 2 days, 8h 16m | Under 2 days |
| Healthcare | 1 day, 7h 11m | 1 day, 7h 11m | Around 1-2 days |
| FinTech & Insurance | 1 day, 17h 11m | 1 day, 17h 11m | Under 2 days |
| AI & Machine Learning | 1 day, 17h 19m | 16h 52m | 1-2 days |
| MarTech | 1 day, 20h 47m | 2 days, 19h 22m | Under 3 days |
| HR | 3 days, 18h 59m | N/A | Under 4 days |
Users of CRM and Healthcare products reach first value fastest, partly because their activation events are discrete and unambiguous, such as adding a contact or completing a patient intake. HR tools take longer, but that’s more a reflection of setup complexity rather than product quality. If your TTV falls outside the safe range for your vertical, the diagnostic metrics below are where to start the investigation.
Three supporting metrics make the core TTV number interpretable rather than opaque:
- Time to first action: Measures the delay between signup and a user’s first meaningful interaction, and extended delays here typically signal onboarding confusion before users ever find the path to first value.
- Percentage of users activated within X period: Tracks what share of signups reach your first value event inside a given window (24, 48, or 72 hours), giving you a cohort-level view of TTV efficiency across segments.
- Drop-off before activation: Shows you the share of signups who abandon before ever reaching the first value event. High drop-off at a specific onboarding step usually means friction at that point is turning users away before they have a chance to experience value, rather than a problem with the activation event definition itself.
These three metrics are most useful when integrated into each of the reduction strategies below, rather than tracked in isolation.
How to track TTV with Userpilot
Tracking time to value in Userpilot is a five-step connected workflow rather than a set of isolated reports. Each step builds on the one before it, and the precision of your event definition in step one directly affects the accuracy of every downstream measurement.
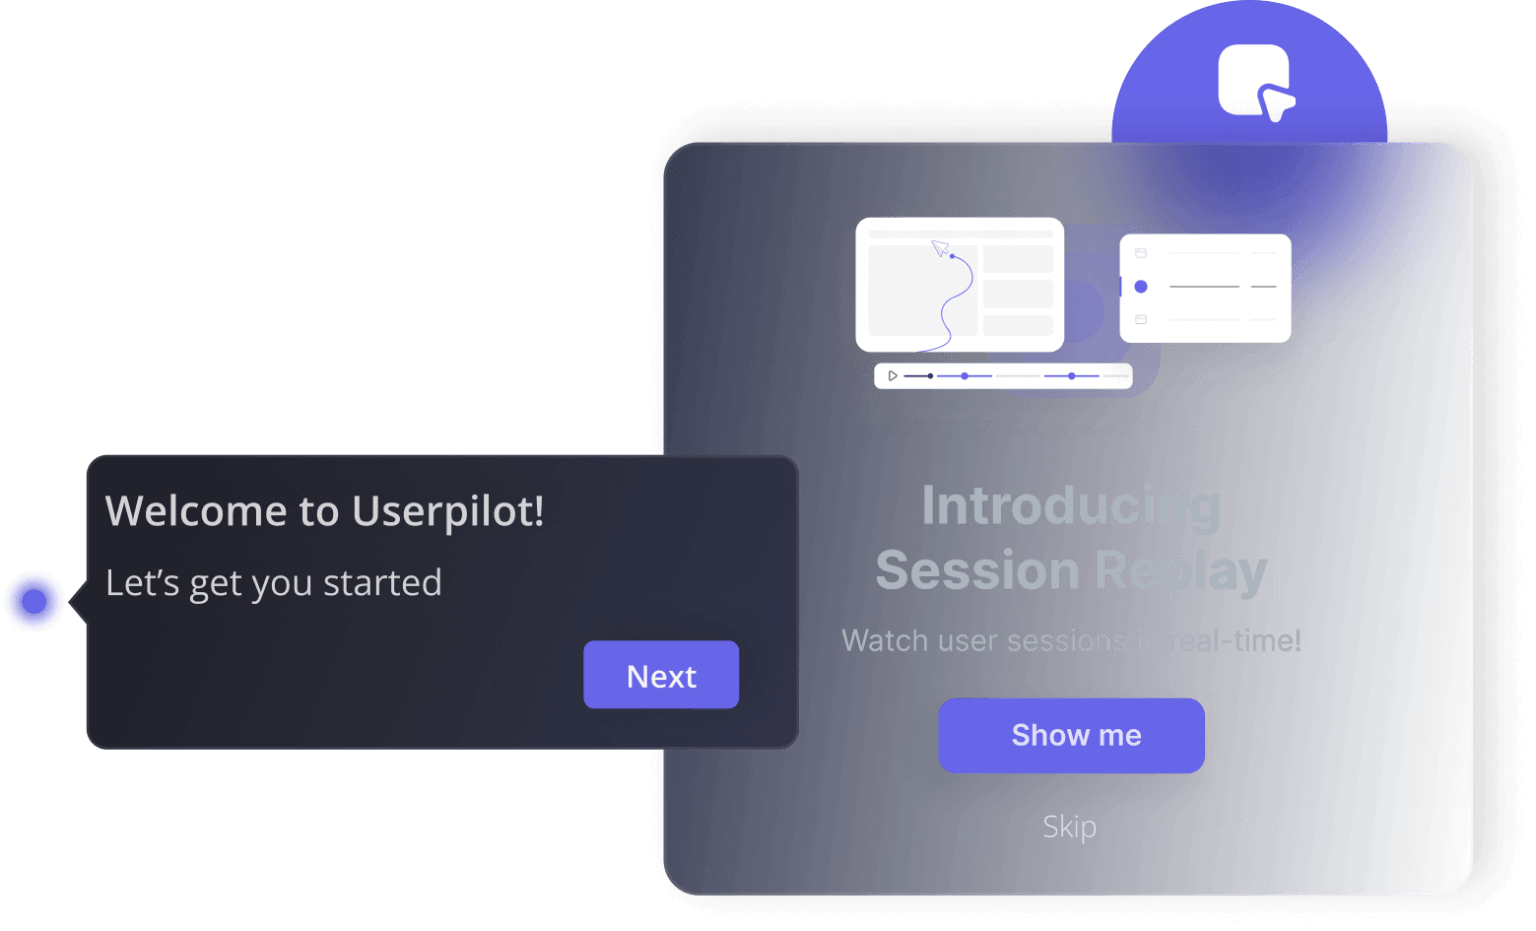
- Define the event with product analytics: Userpilot’s product analytics let you track usage and identify specific interactions that indicate that the point of first value has been reached for a particular user. This creates a data-backed, team-wide definition to ensure everyone is measuring the same behavioral signal rather than their individual interpretation of what “first value” means.
- Track the path with funnel analysis: With the event tagged, funnel analysis shows exactly where users drop off between signup and the first value event, with each drop-off point representing a specific friction problem you can target with an onboarding intervention. If 40% of users complete step two but only 12% reach step three, that gap is where your TTV problem lives.
- Find the fastest routes with path analysis: Path analysis surfaces the behavioral sequences that lead users to the first value event most efficiently. Users who reach their point of first value fastest typically follow a shorter or simpler path through the product, and those paths become the design basis for your onboarding flows: guide new users toward the route that demonstrably works.
- Compare and track with cohort analysis: Cohort analysis lets you compare TTV across user segments and see whether it’s improving month over month, where an enterprise segment showing a TTV two days longer than a self-serve segment is a clear signal that those groups need different onboarding treatments. Month-over-month comparisons confirm whether your reduction strategies are working or whether TTV is quietly drifting.
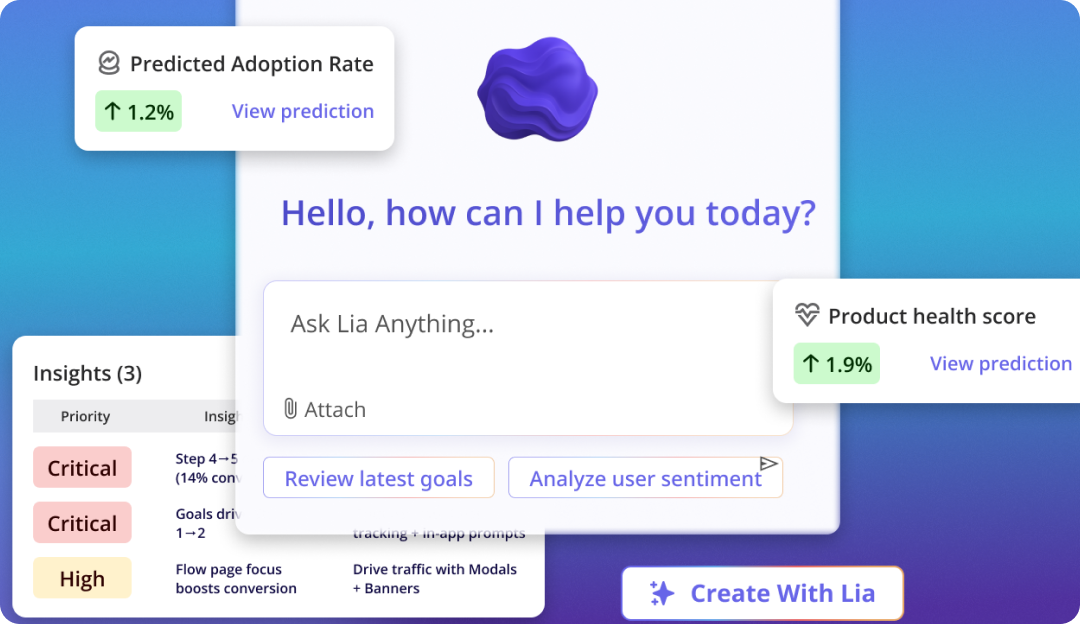
- Query trends with Lia: Lia, Userpilot’s AI analytics agent, lets you ask questions about TTV trends in natural language without building a manual report, so a question like “which segment had the longest average TTV last month?” gets an answer in seconds rather than in days.
For CS and product teams without a dedicated data analyst, the speed at which you can surface insights changes how often teams actually act on TTV data.
6 Strategies to reduce your time to value
Each strategy below addresses a specific friction pattern between signup and first value, along with a diagnostic metric to tell you whether the strategy is actually working.
1. Give users a starting point with templates
New users who open a blank dashboard see a canvas, not a product. Templates fix this by delivering 80% of the value configuration immediately: pre-built project structures, campaign layouts, or reporting dashboards that show users what the product does by example. The user handles the remaining 20% as customization, which is a much lower cognitive load than building from scratch. Time to first action is the diagnostic metric for this strategy. If templates are working, that number drops because users arrive at a populated state and complete their first meaningful interaction faster.
When it isn’t moving, the template is either hard to find at login or not relevant enough to the user’s specific use case to create momentum. With Userpilot, you can surface the right template at the right moment using targeted modals or onboarding checklists that trigger the instant a user logs in for the first time. Instead of expecting users to hunt for starting points, you put the starting point directly in front of them at the moment it’s most useful (which drastically hastens adoption as a whole).
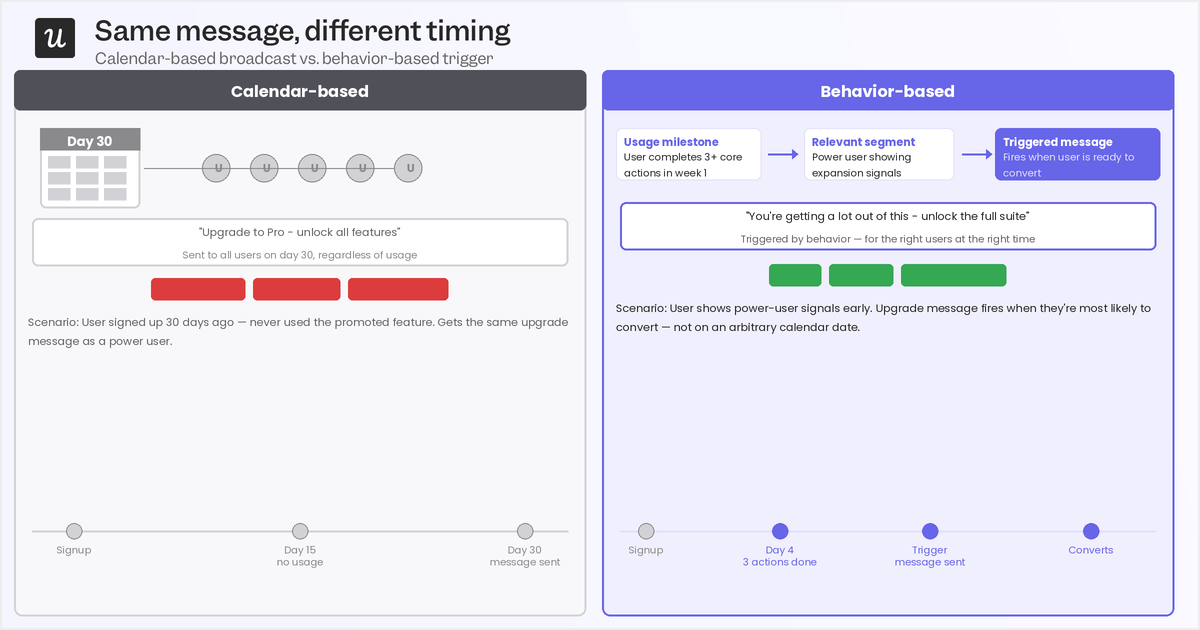
2. Segment users and route them to the right path
Generic onboarding forces every user through the same first-session experience regardless of their role, goal, or context. An SEO analyst and a content marketer using the same platform need different introductions to the same product. Contextual segmentation routes each new user to the onboarding path most likely to surface their specific first value event. The simplest version is a single welcome screen question: “What are you here to do?”

An SEO platform that asks this question can send keyword research users directly to creating their first keyword list, and site audit users directly to running their first crawl, collapsing the time each cohort takes to reach their specific first value moment. Each persona gets to value faster because they’re not sifting through irrelevant features to find the one they need. The diagnostic metric here is the percentage of users activated within X period, broken down by segment.
This reveals which user groups are under-activating despite contextual routing, and which segments convert fastest, so you can analyze what the fastest cohort is doing differently and apply it elsewhere.
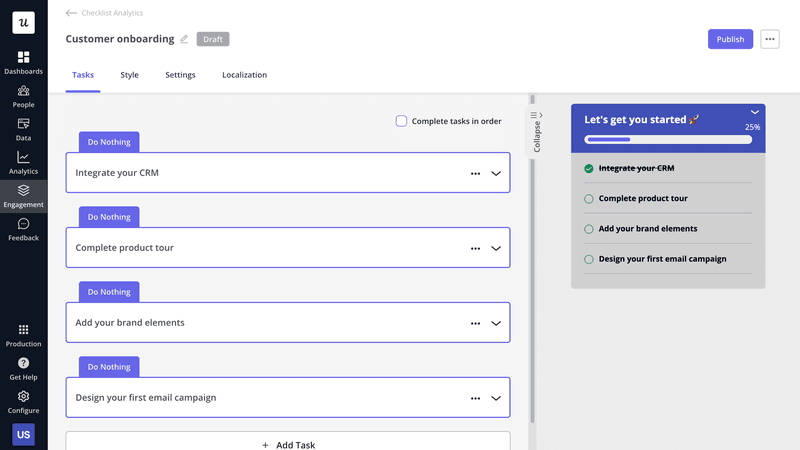
3. Design an onboarding checklist with Zeigarnik momentum
Most onboarding checklists are filled with administrative steps: profile completion, notification settings, billing details. None of those steps move users toward first value, which is these checklists get ignored and become an exercise for the product team rather than a genuine activation tool for users. A Zeigarnik checklist replaces admin steps with value-generating actions. Every item in the flow moves users measurably closer to their first value event.
Starting users with an auto-completed first step, like “Create your workspace,” gives them an endowed progress effect that makes remaining items feel more achievable than starting at zero. The Zeigarnik effect describes the brain’s tendency to keep uncompleted tasks more active in working memory than completed ones, and a partially filled checklist exploits that tendency to sustain momentum through the full onboarding sequence. Drop-off before activation is your diagnostic signal: if users complete early checklist items but abandon before the final value-driving action, that last step needs friction reduction or clearer framing.
Userpilot’s checklist builder supports auto-complete triggers, so you can initialize a user’s checklist with one step already marked complete the moment they sign up.
That small head start makes the difference between a user who perceives themselves as starting from nothing and one who already feels like they’re underway.
4. Replace static tours with interactive walkthroughs
Traditional product tours front-load information: you get 12 tooltips explaining what each button does before you’ve touched any of them. By the time the tour ends, users have been shown everything and retained very little.
Interactive walkthroughs replace the tour model with a learning-by-doing approach, guiding users through their first actual task rather than explaining what the first task will eventually look like. The specific example that illustrates this best is an email marketing platform that highlights “Create Campaign” only when the user navigates to the campaigns page, triggering guidance at the moment of intent rather than as a preemptive lecture at signup.
Time to activation per walkthrough variant is the diagnostic metric: A/B testing two different walkthrough designs and comparing how quickly each gets users to their first value event gives you a direct measurement of which design is actually shortening TTV rather than just improving tutorial completion rates. Userpilot’s behavior-triggered walkthrough builder fires guidance based on specific in-product events, so walkthroughs engage when users signal readiness rather than on a timer.
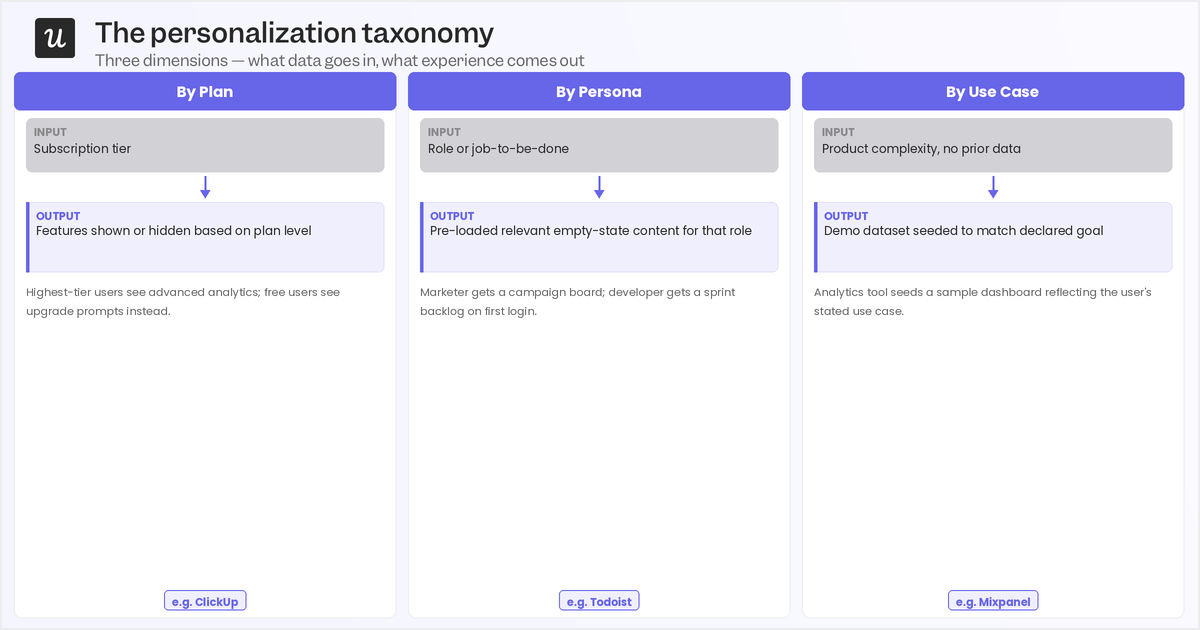
5. Personalize the experience at scale
Irrelevant help content slows TTV in the same way an irrelevant product tour does: it tells users the experience wasn’t built with their specific situation in mind. Personalization at scale means showing in-product guidance based on a user’s role, behavior, and context rather than broadcasting the same experience to every new account. Users who see guidance relevant to their actual task reach first value faster than those who have to filter through generic messaging to find what applies.
Personalization operates on two levels. Interface personalization uses the user’s name, company, or stated use case to make the product feel immediately relevant from the first session. Contextual help personalization shows guidance only on the pages and tasks where a specific user actually needs it, removing the noise that adds friction to the path between signup and first value. The diagnostic metric is repeat activation events: whether users return to the same value-driving action multiple times after their initial first value moment. Increasing repeat activation events indicates that personalization is turning one-time activation into retained engagement.
Userpilot lets you personalize in-app experiences by plan, persona, use case, and other criteria so that the right guidance appears to the right user at the right moment without manual effort at scale.
6. Match onboarding intensity to account value
Treating a $500/year self-serve user the same as a $50,000 enterprise account creates TTV problems for both. A self-serve user doesn’t need a human onboarding call that adds a week of calendar scheduling to their path to first value. An enterprise account attempting a complex implementation with only an automated checklist will take longer to reach first value than it should, and your CS team won’t have seen it coming.
Tech-touch onboarding works for low-ACV users (who can get by on automated email sequences, in-product checklists, and behavior-triggered nudges without human intervention) while human-touch onboarding should be reserved for high-ticket and enterprise accounts that actually need live walkthroughs, tailored setup, and proactive check-ins to work through implementation complexity. Time to adoption is the diagnostic metric for this strategy, looking past first value to ask whether early activation is actually turning into habitual use.
With Userpilot, you can automate the full tech-touch path using event-driven nudges, checklists, and contextual in-app guidance that scales across your entire self-serve base. Userpilot’s segmentation and health scoring also help CS teams identify accounts that need high-touch onboarding early enough to intervene before slow TTV becomes a churn signal.
What faster TTV looks like in real products
See how three Userpilot customers reduced their TTV. Each used different strategies, but they all started from the same place: a precise and retention-validated first value event.
How The Room increased new user activation by 75% within 10 days
The Room needed new members to upload their CVs, which was the product’s first value event: the moment a new member had something in their profile worth being discovered by others. Using Userpilot’s in-app onboarding flows and driven actions to guide users directly to the CV upload step at signup, they removed the friction that had been keeping new members in the product without completing the action that made it valuable. Within 10 days, CV uploads jumped by 75%.
How Sked Social tripled conversions with an onboarding checklist
Sked Social‘s first value event was completing a core setup sequence that proved the tool could handle a user’s specific scheduling workflow. They built a focused onboarding checklist in Userpilot around the steps with the strongest correlation to conversion, added progress cues that kept users moving through the sequence, and used an auto-completed first step to create initial momentum. Customers who completed the checklist were 3x more likely to upgrade to the paid version.
How Attention Insight increased activation by 47% with interactive walkthroughs
Attention Insight, an AI-powered analytics tool, needed users to upload a screenshot and tag areas of interest before the product’s value became visible. Without those two completed steps, users had a capable product they couldn’t yet evaluate, which made the path to first value entirely dependent on guided action. Using Userpilot’s interactive walkthroughs with context-aware guidance that triggered only at the relevant product stage, they drove a 47% increase in new user activation over six months.
Start with the definition, then reduce from there
Time to value is only a useful metric when you’ve defined what “first value” actually means for your specific product. The formula is simple and the industry benchmarks are readily available but what’s missing for most teams is the foundational definition work that makes all of it actionable. The teams with the shortest TTV aren’t the ones who implemented the most tactics; they’re the ones who started with a well-defined first value event, confirmed it through cohort analysis, and built their onboarding around accelerating users toward that specific outcome.
Book a demo to see how Userpilot’s usage analytics, funnel analysis, and cohort reports give your team the foundation it needs to reduce time-to-value!
About the author