A Practical Guide to In-App NPS for SaaS



An in-app NPS survey asks users how likely they are to recommend your product while they are using it. The 0–10 score is easy to collect, but it does not explain why users feel that way or what your team should do next.
To get useful insights, you need to show the survey to users who know the product, ask a follow-up question, connect each response with product and account data, and decide how promoters, passives, and detractors will be handled.
As a UX researcher at Userpilot, I use NPS to track the customer relationship over time. I do not use it to evaluate one feature, diagnose a usability problem, or decide the roadmap on its own. I’ll show you how to set up, analyze, and act on in-app NPS with Userpilot’s user feedback tool.
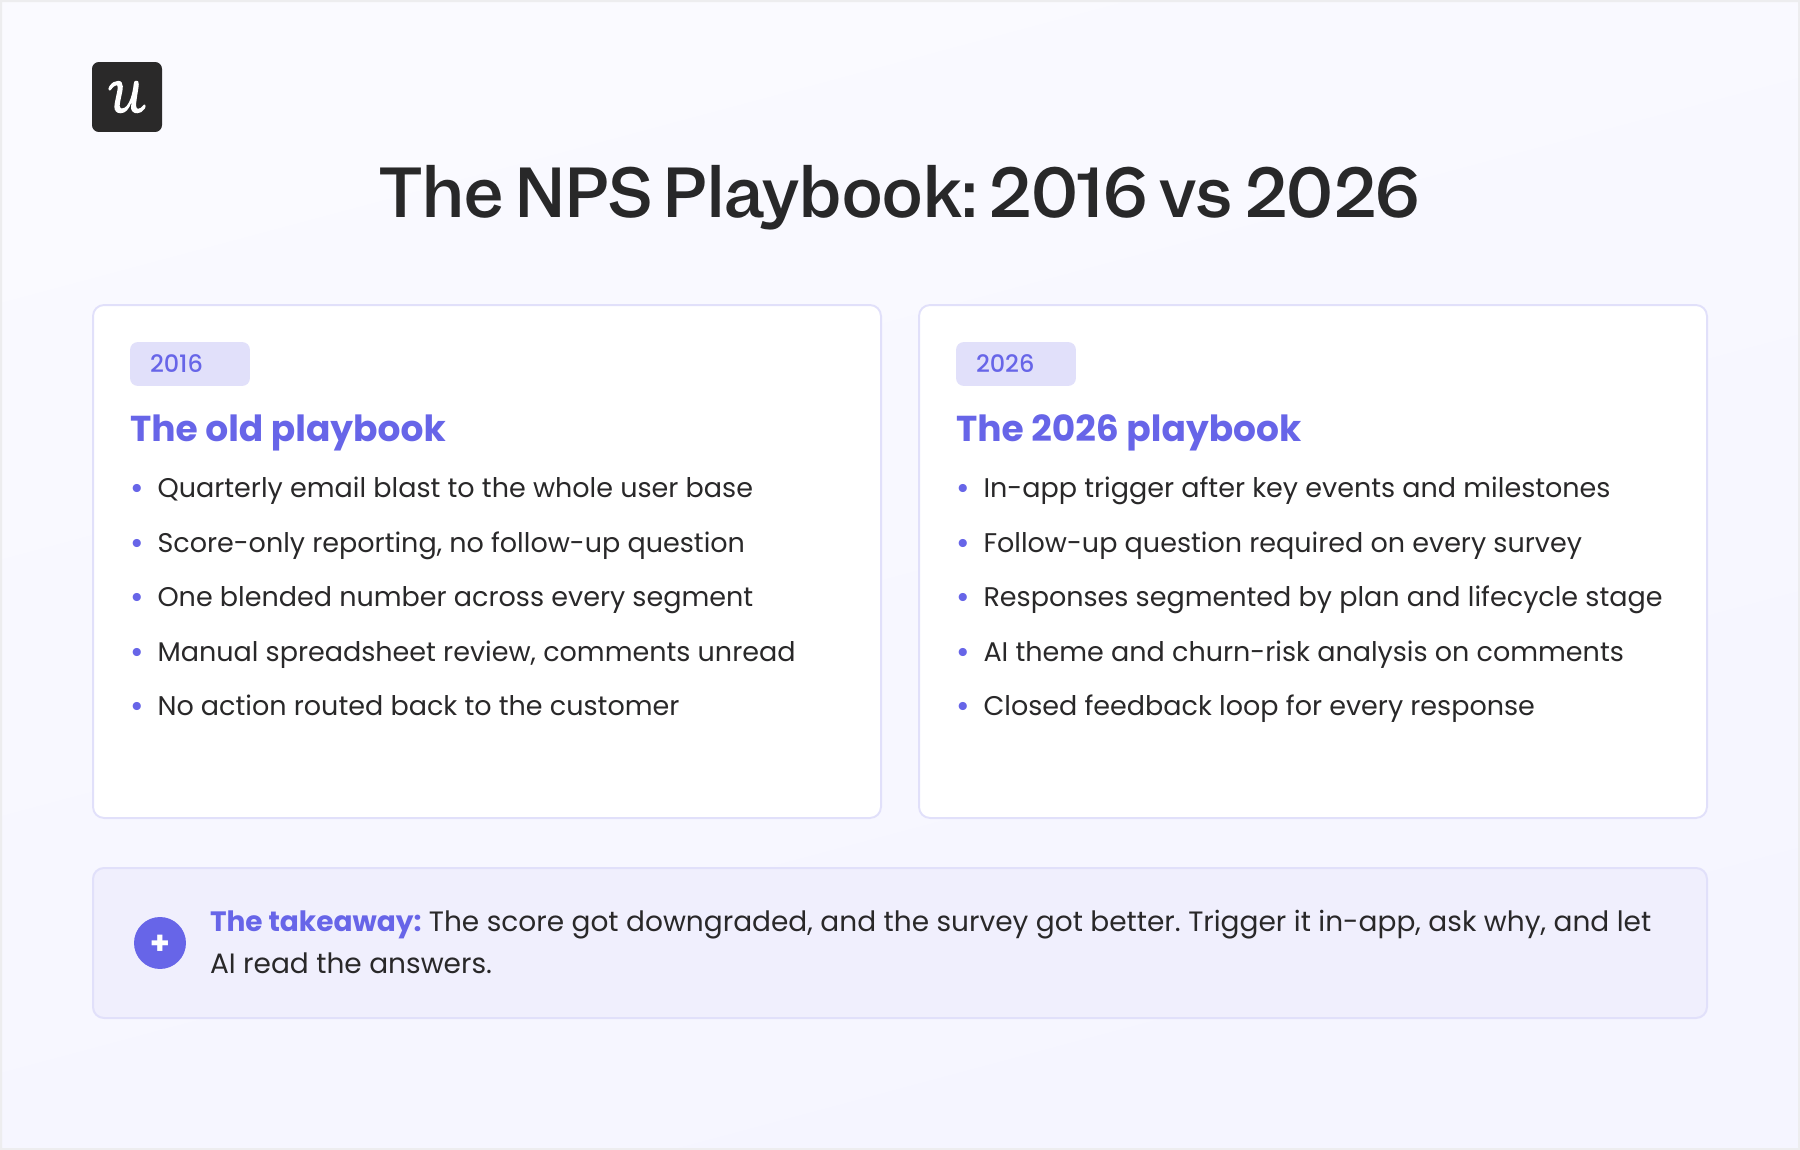

In-app NPS measures the customer relationship
NPS is designed to track how users feel about their overall relationship with your product. It is not a score for one task, feature, support ticket, or employee.
The score groups users into three categories
NPS turns 0–10 ratings into promoters, passives, and detractors, then subtracts the percentage of detractors from the percentage of promoters.
How likely are you to recommend [product] to a friend or colleague?
- Promoters (9–10): Users with a strongly positive attitude toward the product.
- Passives (7–8): Users who are broadly positive but do not count toward the final score.
- Detractors (0–6): Users whose responses reduce the final score.
The result ranges from -100 to +100. Passives are excluded from the calculation.
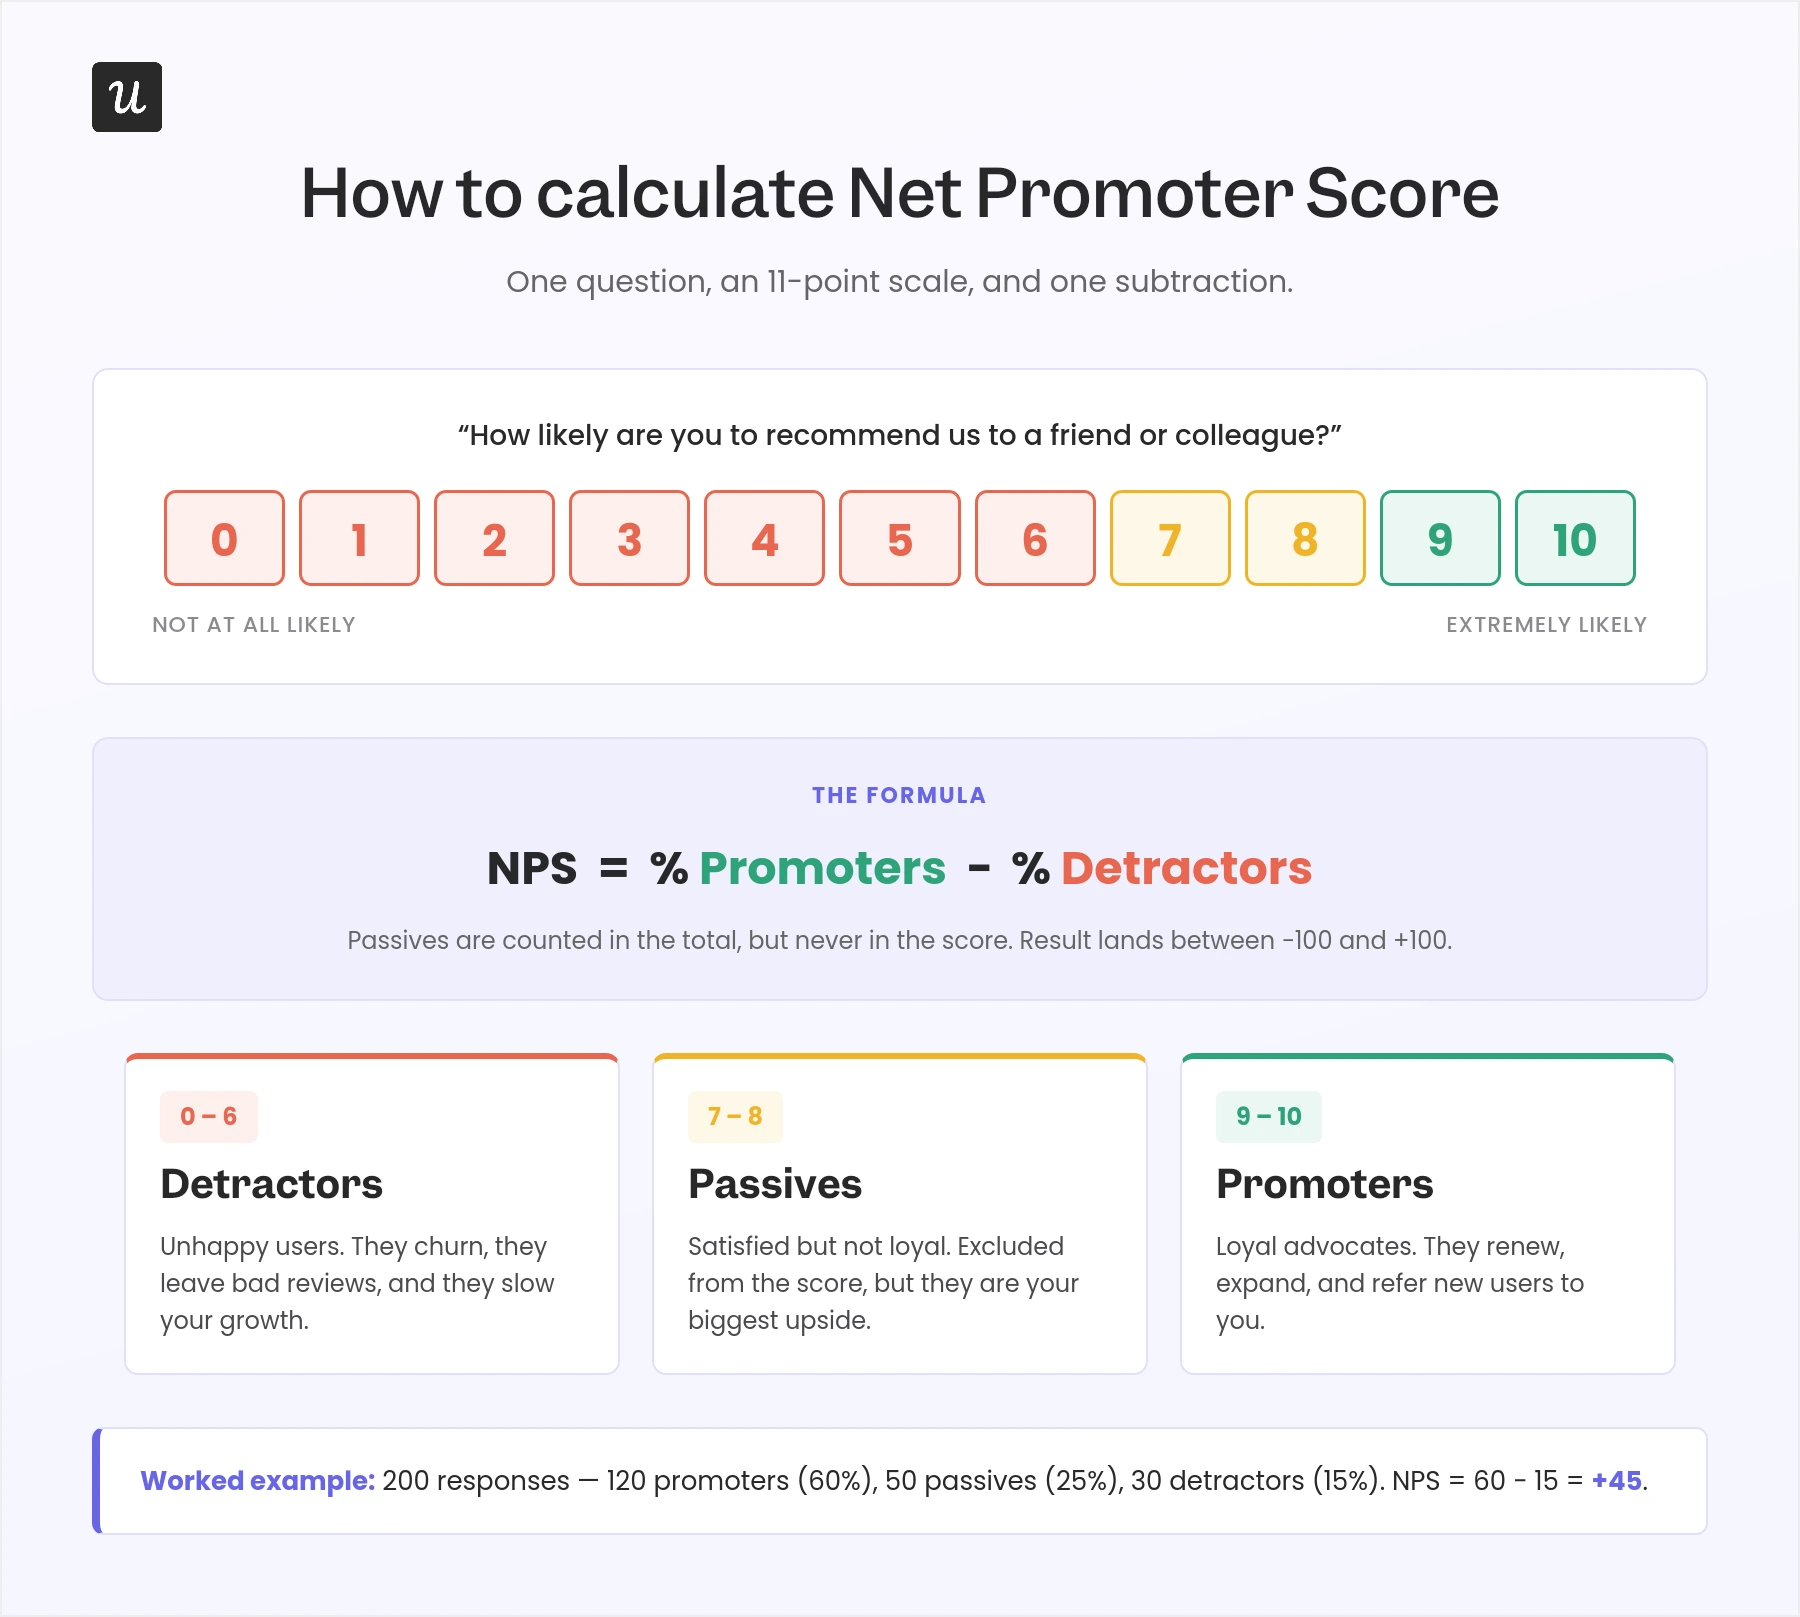
The calculation is simple, but the categories are blunt. A 7 or 8 sounds positive in normal conversation, yet it contributes nothing to NPS. A 6 and a 0 both count as detractors even though they can represent very different experiences.
The same final score can also hide completely different response patterns. An audience made entirely of 7s and 8s produces an NPS of zero. So does an audience split evenly between 0s and 10s. I always review the response distribution with the final score.
Make sure you know how to calculate NPS from the percentages of promoters and detractors. Averaging the 0–10 ratings gives you a different metric.
In-app surveys keep each response tied to the user
In-app surveys let you control who sees the question and keep the response attached to the same user and company data you already track.
You can exclude new signups, target paid accounts or specific roles, and wait until users have completed enough key actions to understand the product. Once they answer, you can compare the response with their plan, lifecycle stage, feature usage, support history, and account health.
Email surveys can collect NPS too, but they add more steps. The user has to remember the experience, open the email, follow a link, and answer outside the product. In-app delivery removes that friction and gives you better control over the audience.
Our product metrics benchmark report, covering 229 SaaS companies, found an average SaaS NPS of 35.7. I would use that as background context only. Your own trend is more useful when the question, audience, trigger, and sampling method stay consistent.
A useful NPS survey starts with one decision
Before you build the survey, decide what you want the result to change. That decision should determine the audience, timing, follow-up question, and response process.
Useful goals include:
- Tracking relationship sentiment among active paid users.
- Finding accounts that may need attention before renewal.
- Comparing sentiment across plans, roles, regions, or product adoption levels.
- Checking whether a major product change affected the wider customer relationship.
- Finding promoters for research, reviews, referrals, or advocacy.
“Leadership wants an NPS number” is not a complete goal. You may still need to report the number, but you should also decide which segments, comments, and usage signals will help explain any movement.
Keep the standard question for trend tracking
Use the standard recommendation question when you want to compare results over time. Changing the wording changes what the survey measures.
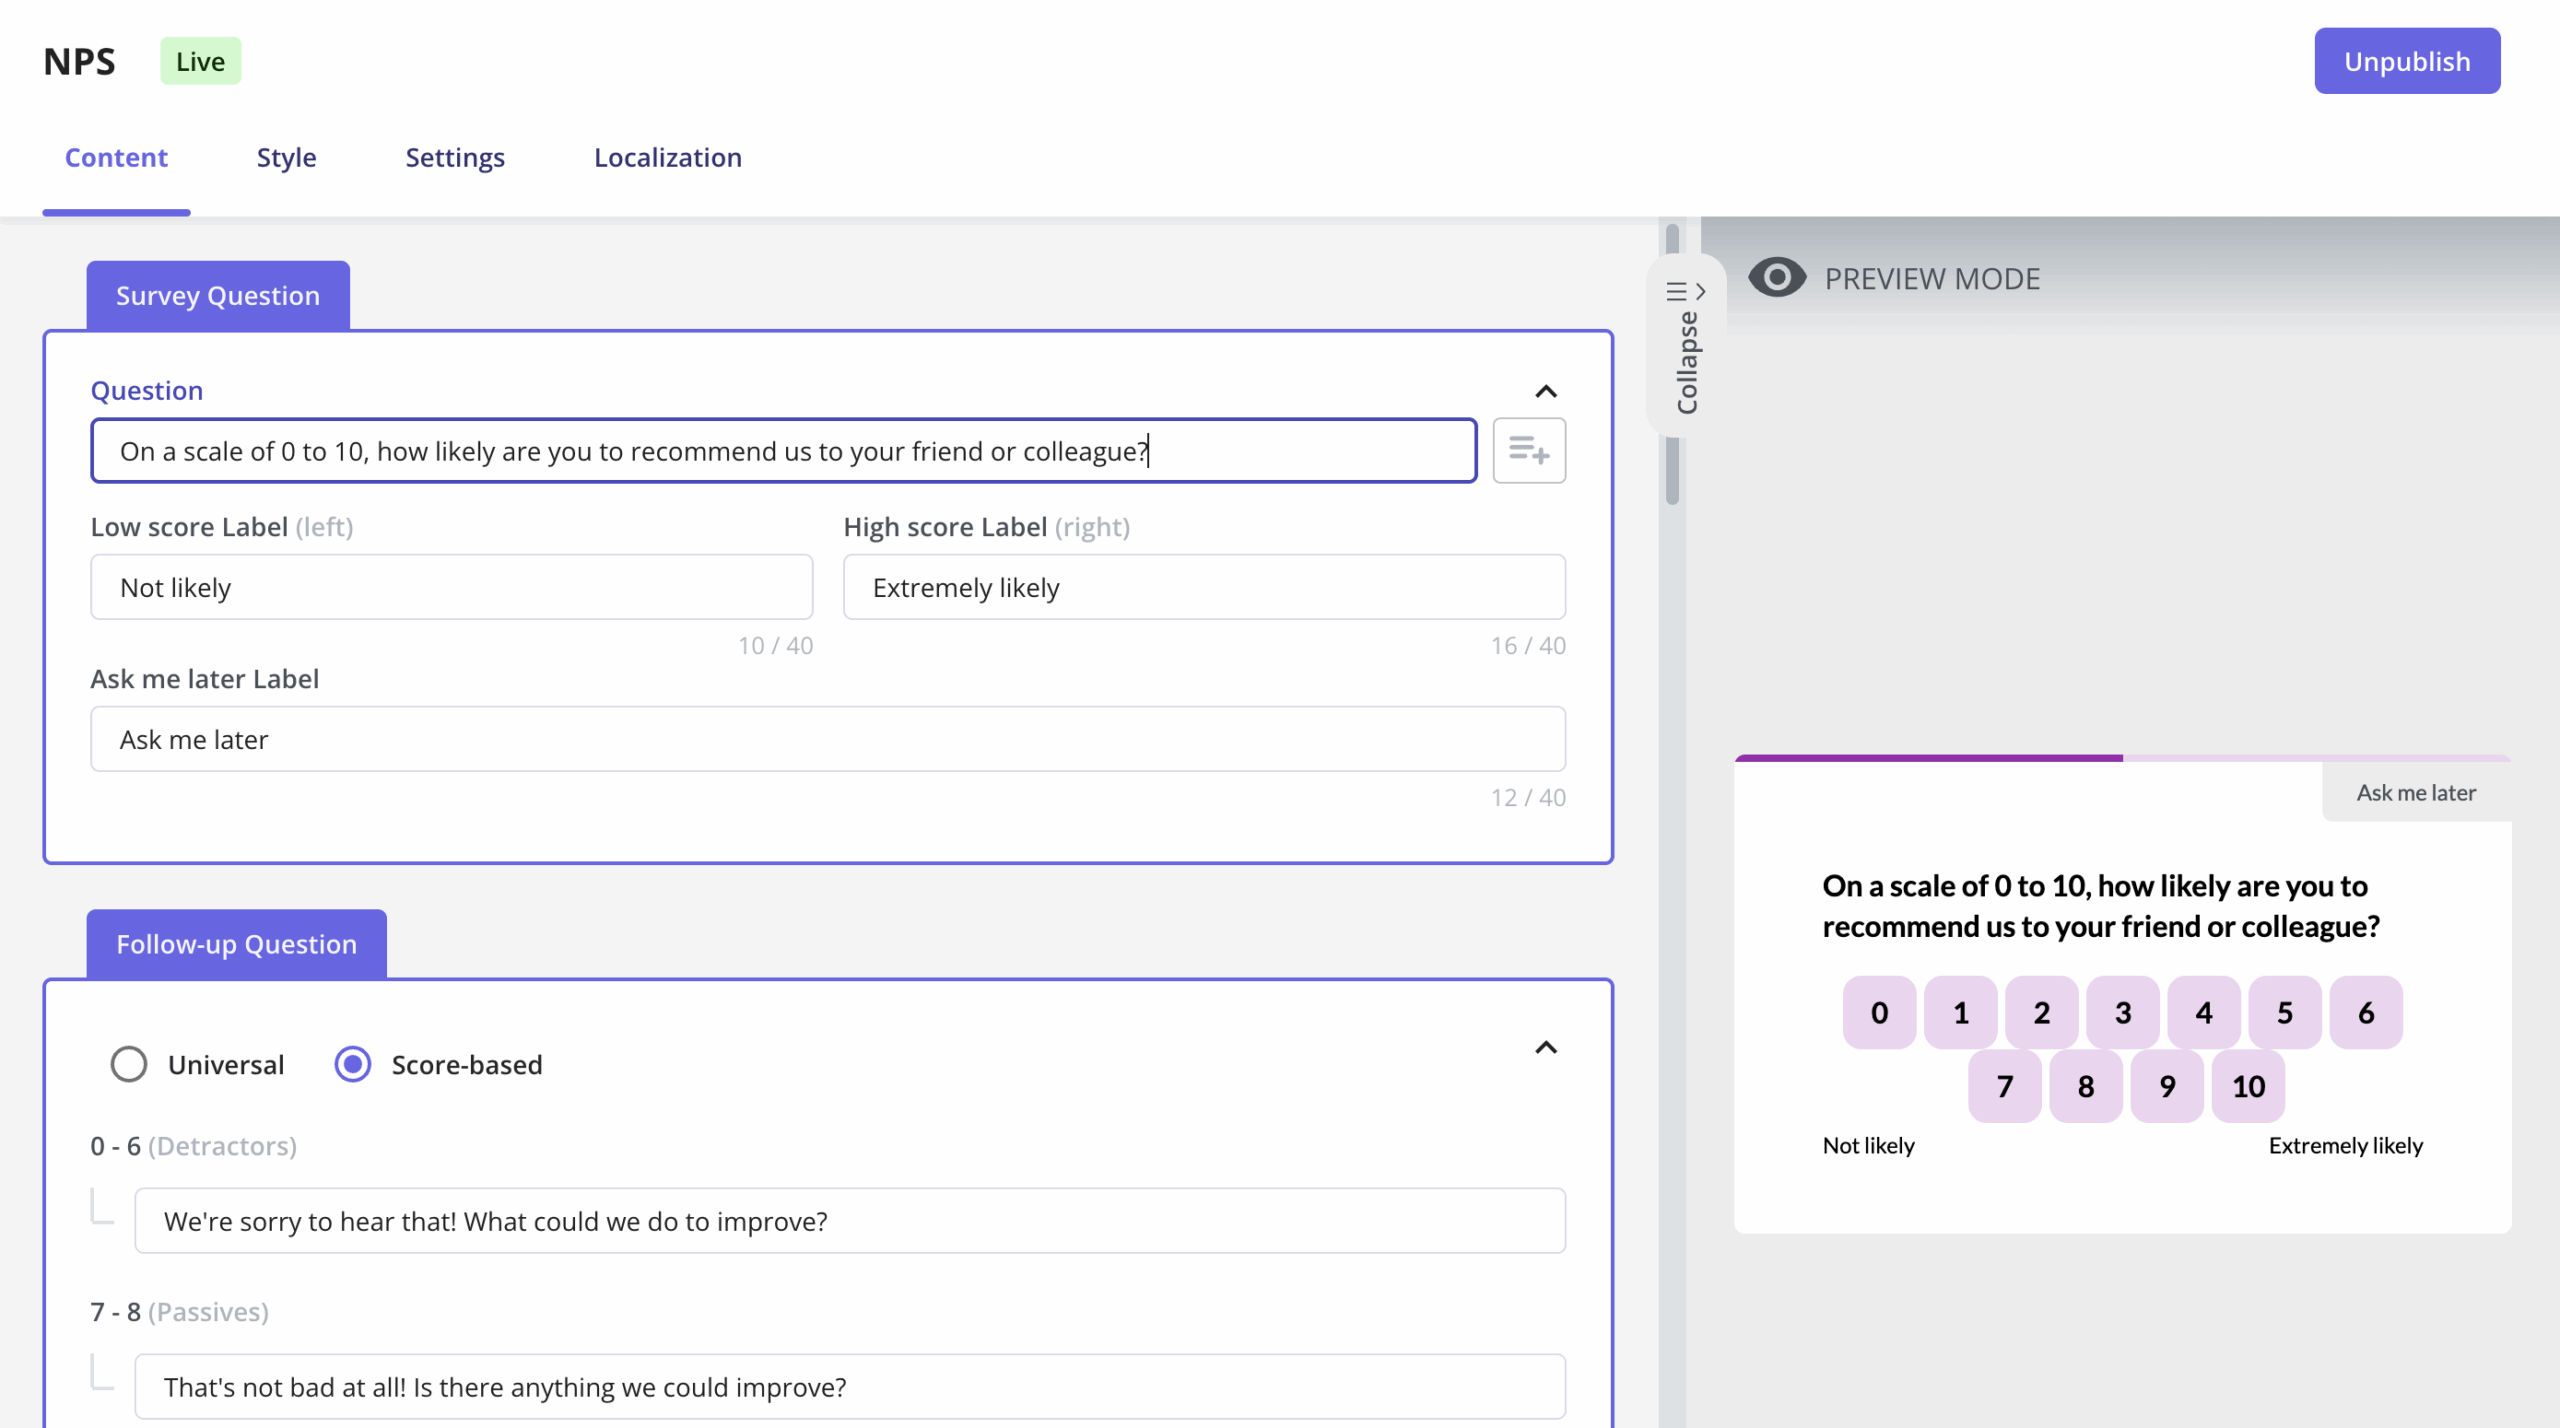
In Userpilot, go to Feedback > NPS and create the survey. You can keep the default question and add dynamic variables such as the product, company, or user name.
Avoid replacing the question with “How satisfied are you?” or “How much do you love us?” while still calling the result NPS. Those are different measures.
Do not color the scale in a way that teaches users which answer you want. Labeling 9 and 10 as good, or explaining that only those scores count as positive, can influence the response.
In B2B products, treat the answer as a relationship measure rather than a literal referral forecast. Some users did not choose the software, are required to use it for work, or do not know anyone with the same need. They can value the product and still have no reason to recommend it.
Use the follow-up to find the reason
The follow-up feedback question explains what the 0–10 score cannot. Userpilot lets you ask one general follow-up or show a different question based on the selected score.
| Response group | Follow-up question | What it helps uncover |
|---|---|---|
| Promoters | What do you value most about [product]? | The outcomes and workflows worth protecting. |
| Passives | What would make [product] more valuable to you? | The gaps preventing users from seeing stronger value. |
| Detractors | What is the main reason for your score? | The problem that needs investigation or follow-up. |
I prefer score-based wording because each group has a different reason to explain. A promoter can tell you what works. A passive can tell you what is missing. A detractor can point you toward the problem.
Keep the text field optional. The low effort of the first question is one reason NPS gets responses from people who would never complete a longer survey. Longer forms tend to attract highly engaged users and people with strong complaints. Their feedback can be valuable, but they may not represent everyone else. Use the comments to find themes, then recruit separate interviews when you need depth.
Ask users who know the product
Only show product NPS to users who have enough product experience to judge the relationship. A new signup can react to onboarding, but cannot evaluate the whole product yet.
Your eligibility rules might include:
- Signed up at least 30–90 days ago.
- Completed onboarding and reached the activation milestone.
- Used one or more core features several times.
- Logged in across multiple weeks or sessions.
- Belongs to a paid account or a relevant role.
- Has not recently answered another survey.
Userpilot lets you target saved segments or build conditions from user attributes, company data, NPS history, and product usage.
Do not limit the audience to your most active power users. Requiring enough experience improves answer quality. Requiring perfect adoption inflates the score. Define the minimum exposure needed to answer, then sample fairly within that group.
Show the survey at a natural pause
Place the survey where users can answer without interrupting an important task. NPS should appear after users have experienced the product, not immediately after one isolated action.
Good moments include:
- The dashboard after users complete a meaningful workflow.
- A return visit after the user has adopted the core product.
- The end of a session rather than the middle of a task.
- The pre-renewal period while there is still time to address concerns.
- Several weeks after a major change, once users have adjusted to it.
Use CSAT after a support interaction or feature experience. Use CES after a workflow when the main question is how easy or difficult it felt. Showing NPS at those moments creates recency bias and gives you less precise feedback than a touchpoint-specific survey.
Major releases need extra time. Newness can lift scores because the change feels fresh, or lower them because returning users have lost familiar habits. Wait until users have repeated the new workflow, then compare NPS with adoption and task outcomes.
Let users dismiss the survey
Users should always be able to close an NPS survey. Forced answers increase completion by adding random or irritated responses.
I would not show the survey again the next day after a dismissal. A repeated prompt can improve the response rate while making the score less trustworthy.
Userpilot lets you control sampling, recurrence, dismissal behavior, survey order, and throttling. A practical starting point is to sample a portion of eligible users and wait several months before asking submitted users again.
Set feedback limits across the whole product. A user who answered a feature survey last week should not immediately receive NPS because a different team owns it.
Keep each survey wave comparable
Use the same audience rules, question, timing, and collection method when you compare NPS over time. Changes to the survey setup can move the score even when the customer relationship stays the same.
Adding an incentive to one wave, asking account managers to chase selected customers, or excluding users who may respond negatively breaks the trend. Document any major setup change and treat the next wave as a new baseline.
Sampling also helps. Instead of showing NPS to every eligible user on the same day, collect responses steadily so one unusually active week does not dominate the result.
Adapt the survey for each language and market
Translate the question carefully and review how users in each market interpret the numeric scale. A direct translation does not guarantee that people use the numbers in the same way.
Userpilot lets you customize the design, preview the survey on web and mobile, and localize the text manually or automatically.
Some audiences avoid extreme ratings. Others may read 0 as the neutral starting point instead of the most negative response. I compare regions cautiously and inspect the raw score distribution before deciding that one market has a weaker customer relationship.
The score only makes sense after you check the sample
Start the analysis with who saw the survey and who answered. The final score is easy to misread when the respondents do not represent the audience you intended to measure.
Check who answered
Review the survey analytics, eligible users, survey views, responses, response rate, and respondent profile, before you interpret whether the score is good or bad.
A high NPS with a low response rate means the responding group was positive. It does not prove the wider customer base feels the same way.
Survey respondents often overrepresent users with strong opinions. The quiet middle may close the prompt and continue using the product, or slowly disengage without saying anything.
Compare response coverage by plan, role, account size, tenure, region, and activity level. If account admins respond but end users do not, the score reflects the buyer relationship more than the daily product experience.
Long comments create another bias. The people who write the most are often highly invested or highly frustrated. Their feedback may be useful, but the amount they wrote does not tell you how widespread the problem is.
Read the score distribution
Look at the number of promoters, passives, and detractors behind the final score. The distribution shows what actually changed.
Ask:
- Did promoters increase?
- Did detractors decrease?
- Are passives growing while the headline score stays stable?
- Did one large account or customer segment drive the change?
- Was the movement meaningful relative to the response count?
- Did the audience or timing change between periods?
I do not celebrate a small increase without checking those questions. Minor movement can come from normal sample variation rather than a meaningful change in the product.
Compare meaningful segments
Break NPS down by customer context so you can see where the relationship is improving or getting worse.
Useful segments include:
- Plan and account size.
- User role and permissions.
- Lifecycle stage and tenure.
- Activation and adoption level.
- Feature usage.
- Region or platform.
- Renewal window and account health.
Userpilot lets you filter NPS results by segment, company, time period, and platform. You can also create segments from NPS responses or users who ignored the survey, then compare those groups with product analytics.
A drop among newly onboarded admins points to a different problem from a drop among long-term end users after a release. The company-wide average can hide both.
Group comments by problem
Tag written responses by the underlying problem so you can see which themes appear across promoters, passives, and detractors.
Userpilot supports custom response tags, while Lia can group open-text feedback by theme and sentiment. I use AI for the first pass, then read examples from every major group because similar wording can still describe different causes.
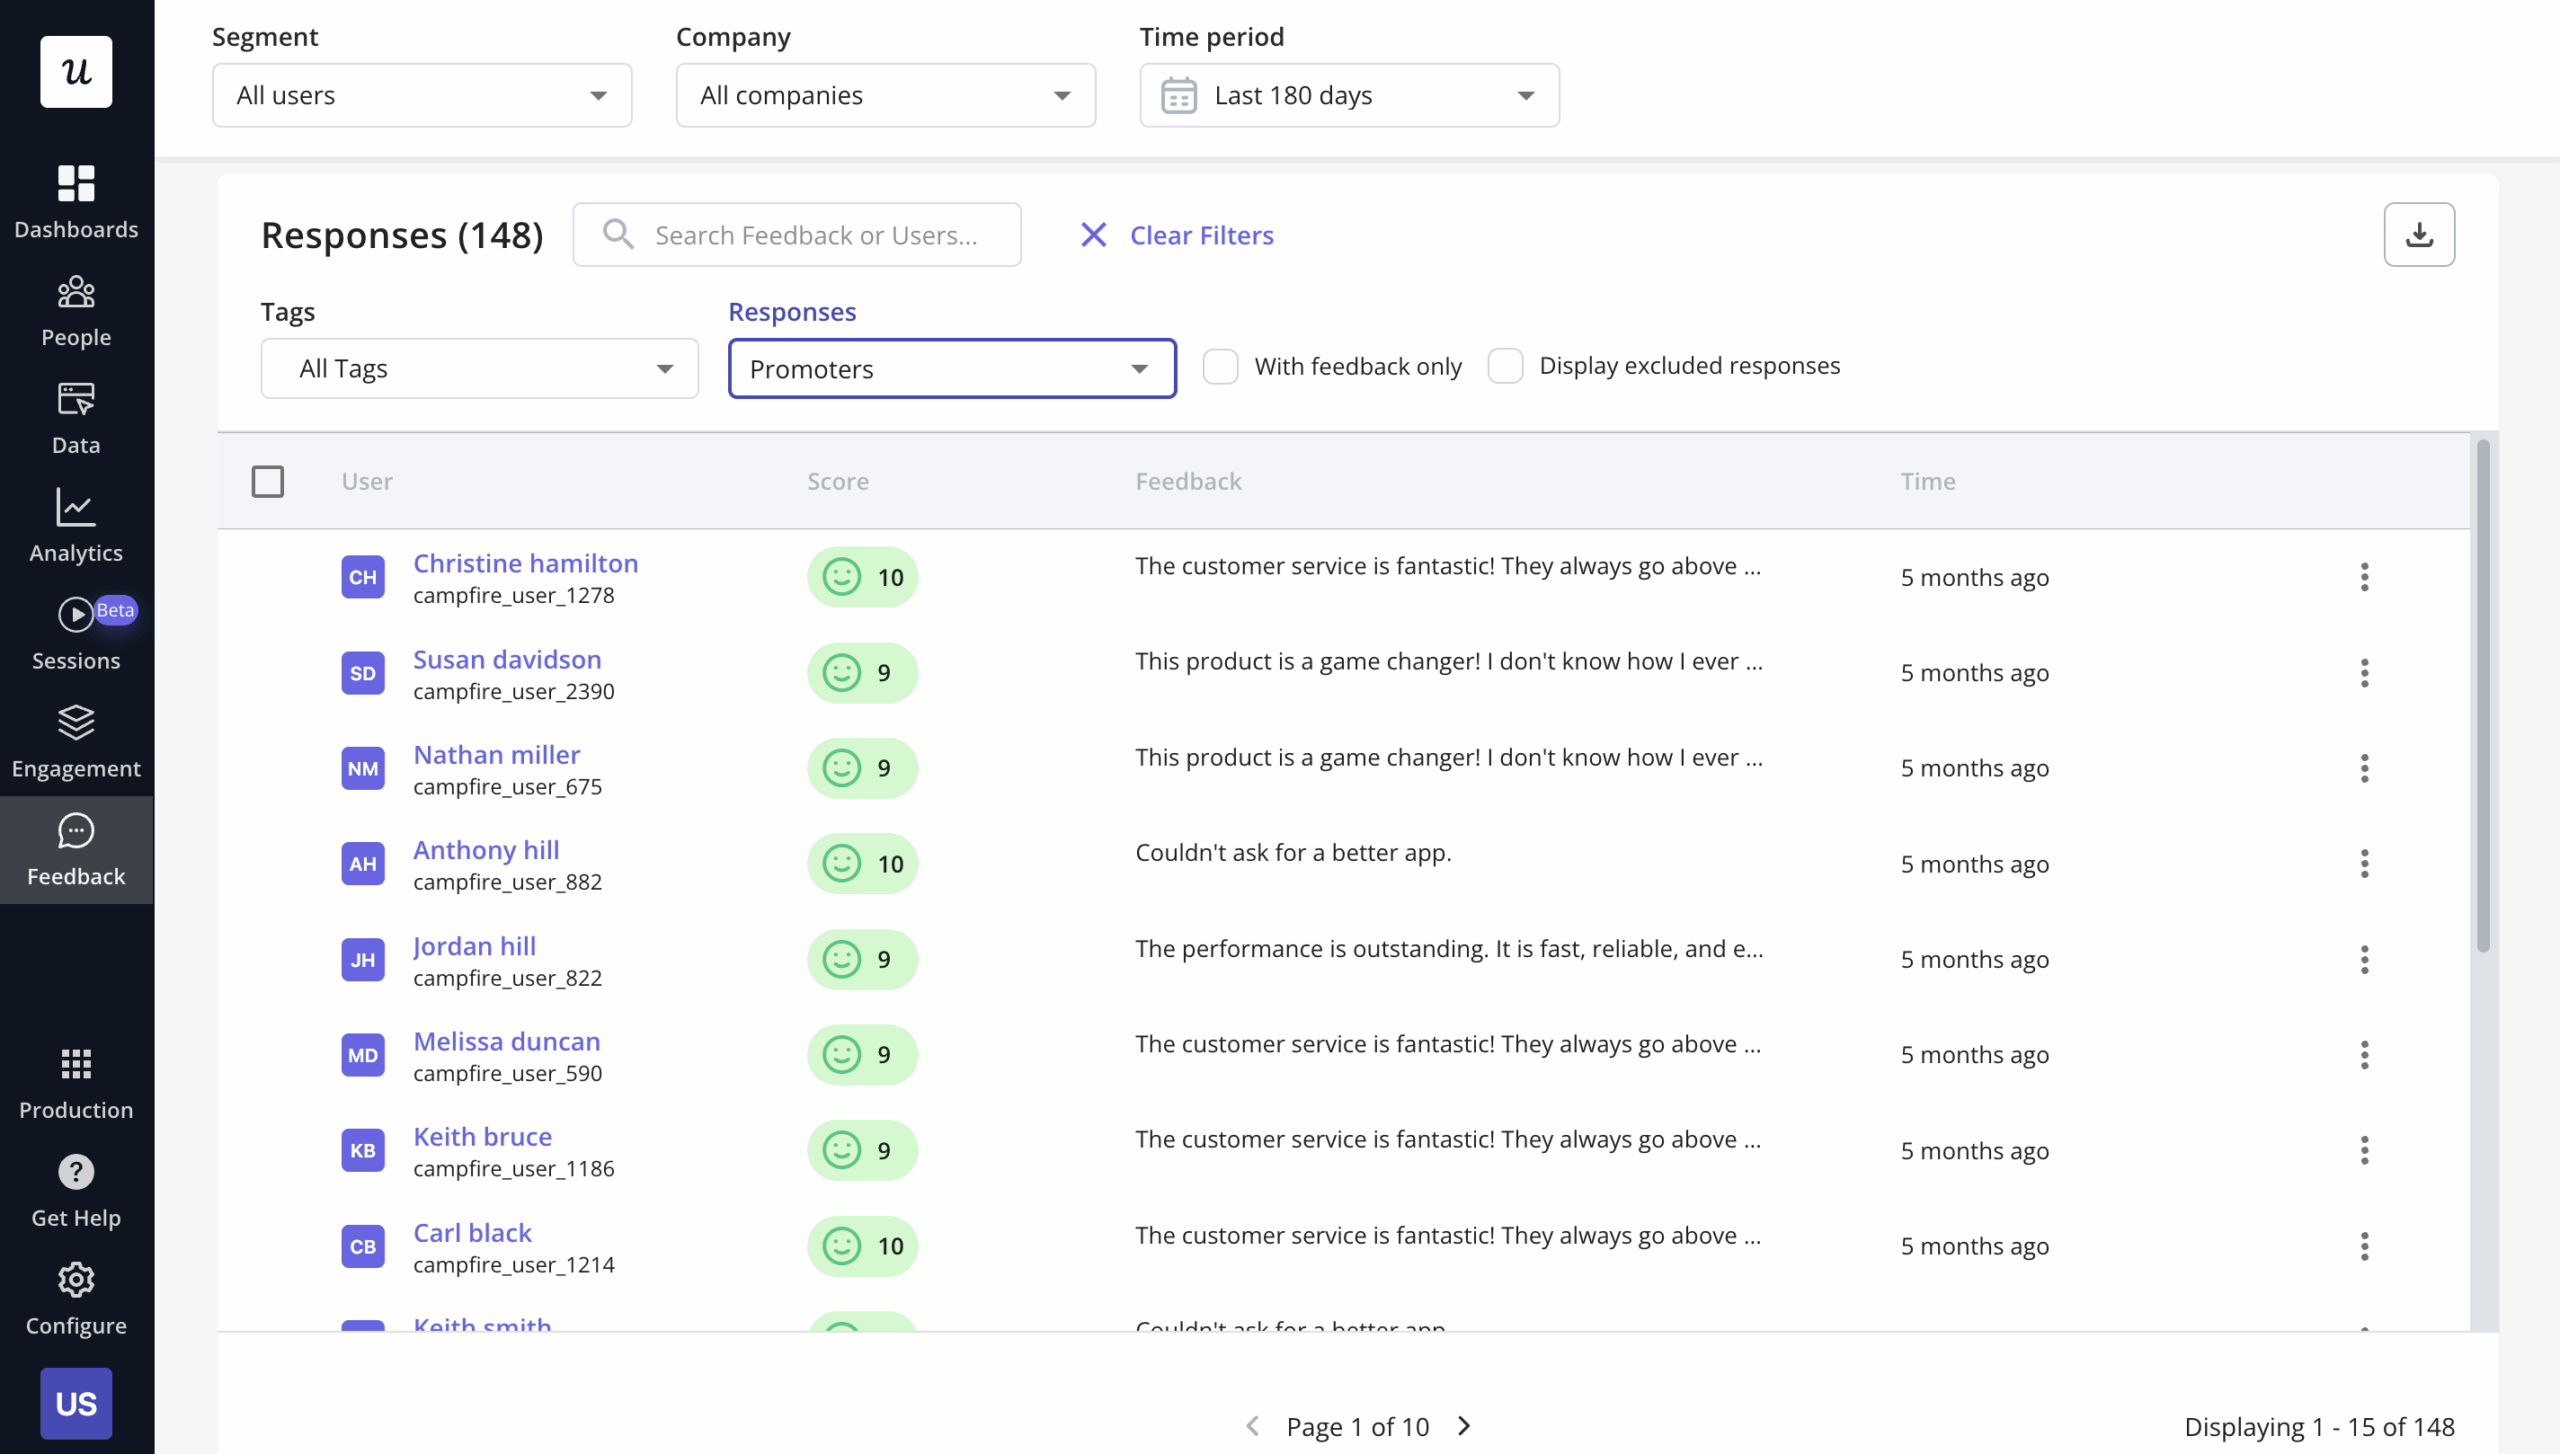
For a more detailed method, use our NPS SaaS guide to analyze responses.
Do not put a request on the roadmap because several articulate customers described it well. First, check how many accounts share the same underlying need, whether the problem appears in usage or support data, and whether the requested solution is the only way to solve it.
The comments tell you where to investigate, yet they do not set the priority by themselves.
Compare answers with product behavior
Use product behavior to check whether recommendation intent matches what users actually do.
Compare each response group with:
- Activation and time-to-value.
- Core feature adoption.
- Login frequency and breadth of use.
- Retention and renewal behavior.
- Support tickets and repeated problems.
- Session recordings around reported friction.
- Account-level adoption across multiple users.
A promoter may never make a referral. A detractor may keep renewing because the product is mandatory for work. Those mismatches do not make the survey useless, but they show that the recommendation question is only one part of the relationship.
Where possible, track whether promoters refer, participate in advocacy, renew, expand, and keep using the product. Check whether detractors reduce usage, reopen tickets, or churn.
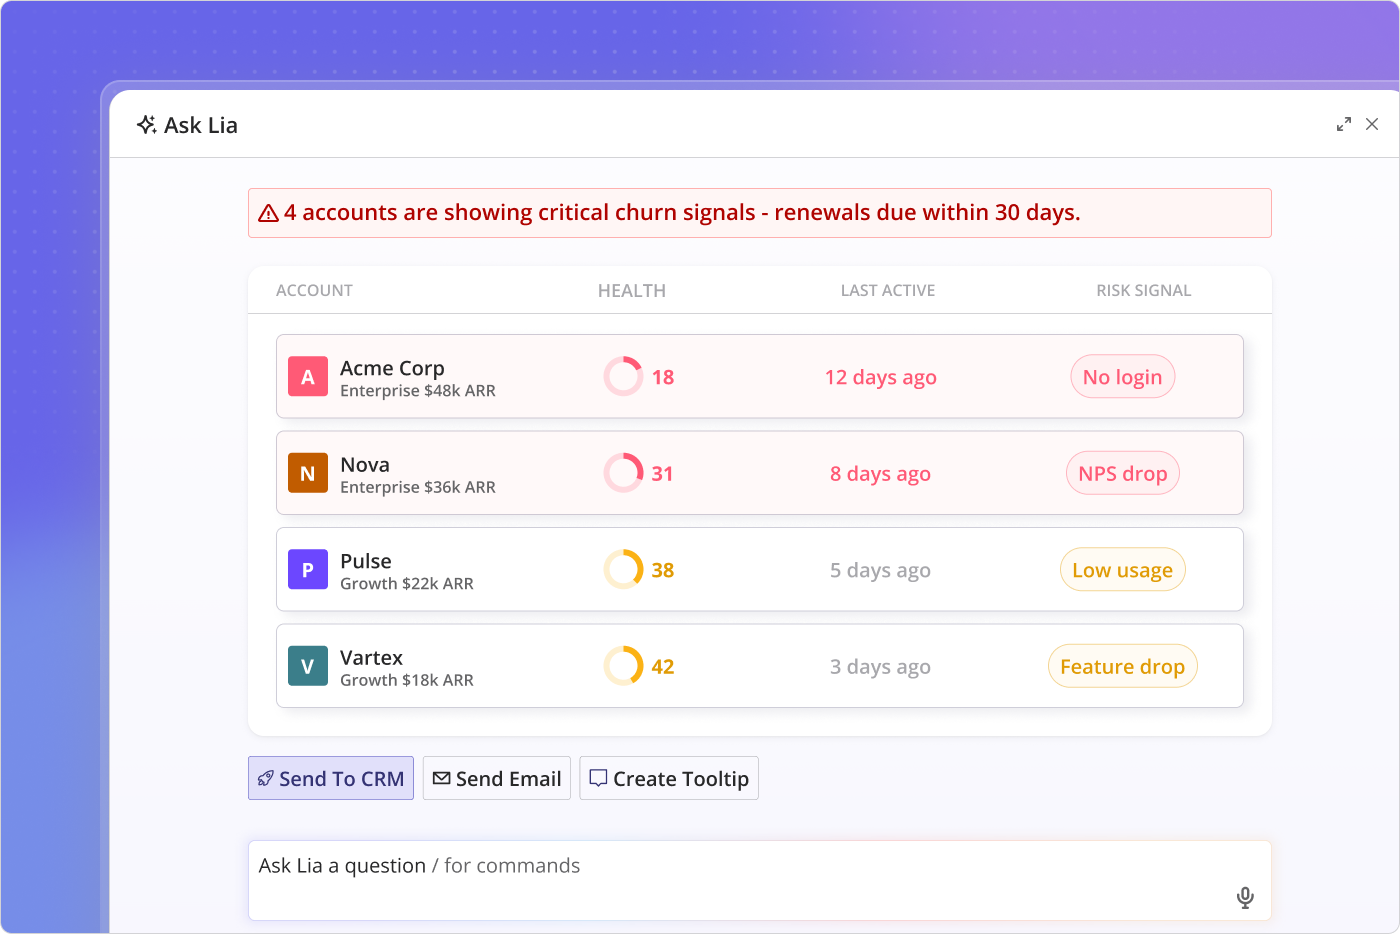
Lia can compare feedback themes with product data and surface accounts where a negative response lines up with adoption risk.
Every NPS response needs a next step
Decide what should happen after each response before you launch the survey. The score should route the user into an investigation, conversation, or follow-up that fits the reason behind it.
Promoters can support research and advocacy
Promoters are useful when their positive score is supported by real product experience. Check what they value, how deeply they use the product, and whether the account is healthy before asking for anything.
Qualified promoters can be invited to:
- Join a research interview.
- Test a beta feature.
- Take part in a case study.
- Leave a review.
- Refer another customer.
- Join an advocacy program.
A new user who clicks 10 times without leaving a comment is not automatically a strong advocate. Product usage and account context still matter.
Passives need help reaching more value
Passives often like the product but have not found enough value to become strong supporters. Their comments and usage can show what is missing.
A passive user may need:
- Help discovering a feature that fits their use case.
- Guidance completing setup.
- A clearer explanation of an advanced workflow.
- A missing capability investigated by the product team.
- A conversation about an account-level blocker.
Do not treat every passive as a future promoter. Some users are simply conservative scorers, and some may have no realistic reason to recommend a B2B tool. Focus on the gap they describe rather than trying to move the number for its own sake.
Detractors need the cause investigated
A negative NPS score needs a fast review of what happened, how serious it is, and whether the problem affects one user or the whole account.
Check:
- Whether the issue is urgent.
- Whether it appears in session replay or product events.
- Whether usage has declined.
- Whether the account is approaching renewal.
- Whether support has seen the same problem before.
- Whether the complaint concerns the product, billing, policy, or service.
Route the response to the right owner. A billing complaint belongs with a different team from a usability problem or a failed integration.
Live segments keep follow-up current
Turn NPS responses into live segments so the audience updates as user behavior and account conditions change.
Examples include:
- Detractor AND renewal within 90 days.
- Detractor AND declining core-feature usage.
- Passive AND has not adopted a relevant feature.
- Promoter AND active admin on a healthy account.
- Ignored NPS AND otherwise highly engaged.
In Userpilot, those segments can combine NPS responses with user attributes, company data, and product behavior. The team does not need to export a static list and rebuild it somewhere else.
Tell users what changed
Close the feedback loop by telling respondents what happened after they shared their feedback.
The response can be small. You might correct confusing copy, update a help article, fix an account issue, explain a product decision, or invite users to test an improvement.
Use a personal reply for urgent account feedback. Use an in-app announcement, email, changelog entry, or beta invitation when several users raised the same issue.
The full feedback loop ends when users can see that their response reached someone and influenced an action.
NPS cannot replace the rest of your research
NPS tracks relationship sentiment. It cannot explain usability, effort, satisfaction with a specific interaction, unmet needs, or the cause of a score change.
Use CSAT and CES for specific experiences
Use a metric that matches the question you are trying to answer.
- Use NPS for the overall customer relationship.
- Use CSAT for satisfaction with a feature, support interaction, or completed experience.
- Use CES for the effort required to complete a workflow.
- Use usability measures for interface performance.
- Use interviews and discovery research for needs, motivations, and root causes.
NPS is useful because the question is standardized and easy to answer. It becomes less useful when teams try to make it cover every research need.
Keep NPS away from employee targets
Do not tie NPS directly to an employee’s bonus or performance rating. People will change how the survey is delivered to protect the target.
Teams may coach customers to select 9 or 10, choose the accounts most likely to respond positively, or pressure users to complete the survey. The score can improve while the evidence gets worse.
A low response can also reflect product limitations, pricing, policy, staffing, or the wider journey rather than the work of one employee.
Report guardrails with the score
Report the information needed to judge whether the NPS result is trustworthy.
I include:
- Response coverage.
- Audience composition.
- Sample size.
- Promoter, passive, and detractor distribution.
- Adoption and retention trends.
- Support trends.
- Qualitative themes.
- Any changes to the survey setup.
These guardrails stop a clean headline number from hiding a weak sample or a product-health problem.
Treat score changes as a research prompt
A change in NPS tells you to investigate. It does not identify the cause.
Pricing changes, outages, support backlogs, a different customer mix, release novelty, and market conditions can all move the score.
Use the written feedback and behavioral data to form hypotheses. Then test them through session replay, interviews, usability testing, support analysis, or account conversations.
Build the response process before you launch!
An in-app NPS survey becomes useful when the team knows who should see it, what follow-up to ask, how to analyze the sample, and what happens after each response.
Set the decision first. Then target experienced users, ask at a natural pause, keep the survey optional, connect responses with product behavior, and assign a clear owner for the next step.
Book a Userpilot demo to build, target, analyze, and act on in-app NPS surveys in one platform.
About the author