User Engagement Analytics: How to Leverage Data to Improve Retention
Get The Insights!
The fastest way to learn about Product Growth, Management & Trends.
What is user engagement?
User engagement refers to the level of user interactions, involvement, and overall satisfaction that users have with a product or service. It is a measure of how actively users are using and interacting with your product.
Why is analyzing engagement data important?
Analyzing engagement data plays a vital role in understanding user behavior, improving product offerings, and driving business success. More specifically,
- Measuring user engagement provides valuable insights into how users are interacting with your product or service. It helps you understand user preferences, usage patterns, and the features that are most popular or underutilized.
- High customer engagement is closely tied to customer retention. By monitoring engagement data, you can identify signs of decreasing engagement or patterns that indicate potential churn.
- Engagement data provide crucial feedback for product improvement and innovation. It helps you identify areas of improvement, prioritize feature development, and uncover opportunities for innovation.
What are the most important user engagement metrics to track?
Tracking one metric isn’t enough to get a good idea about your overall engagement level. Here are some popular user engagement metrics that you should take into consideration:
Average engagement time
Average engagement time, also known as average session duration, is a user engagement measurement that provides insights into the amount of time users spend actively engaging with a website page, application, or digital content.
It is a metric often tracked using universal analytics tools like Google Analytics. However, if you need more actionable insights into user engagement, tools like Userpilot can help you collect granular engagement data like average events per session.
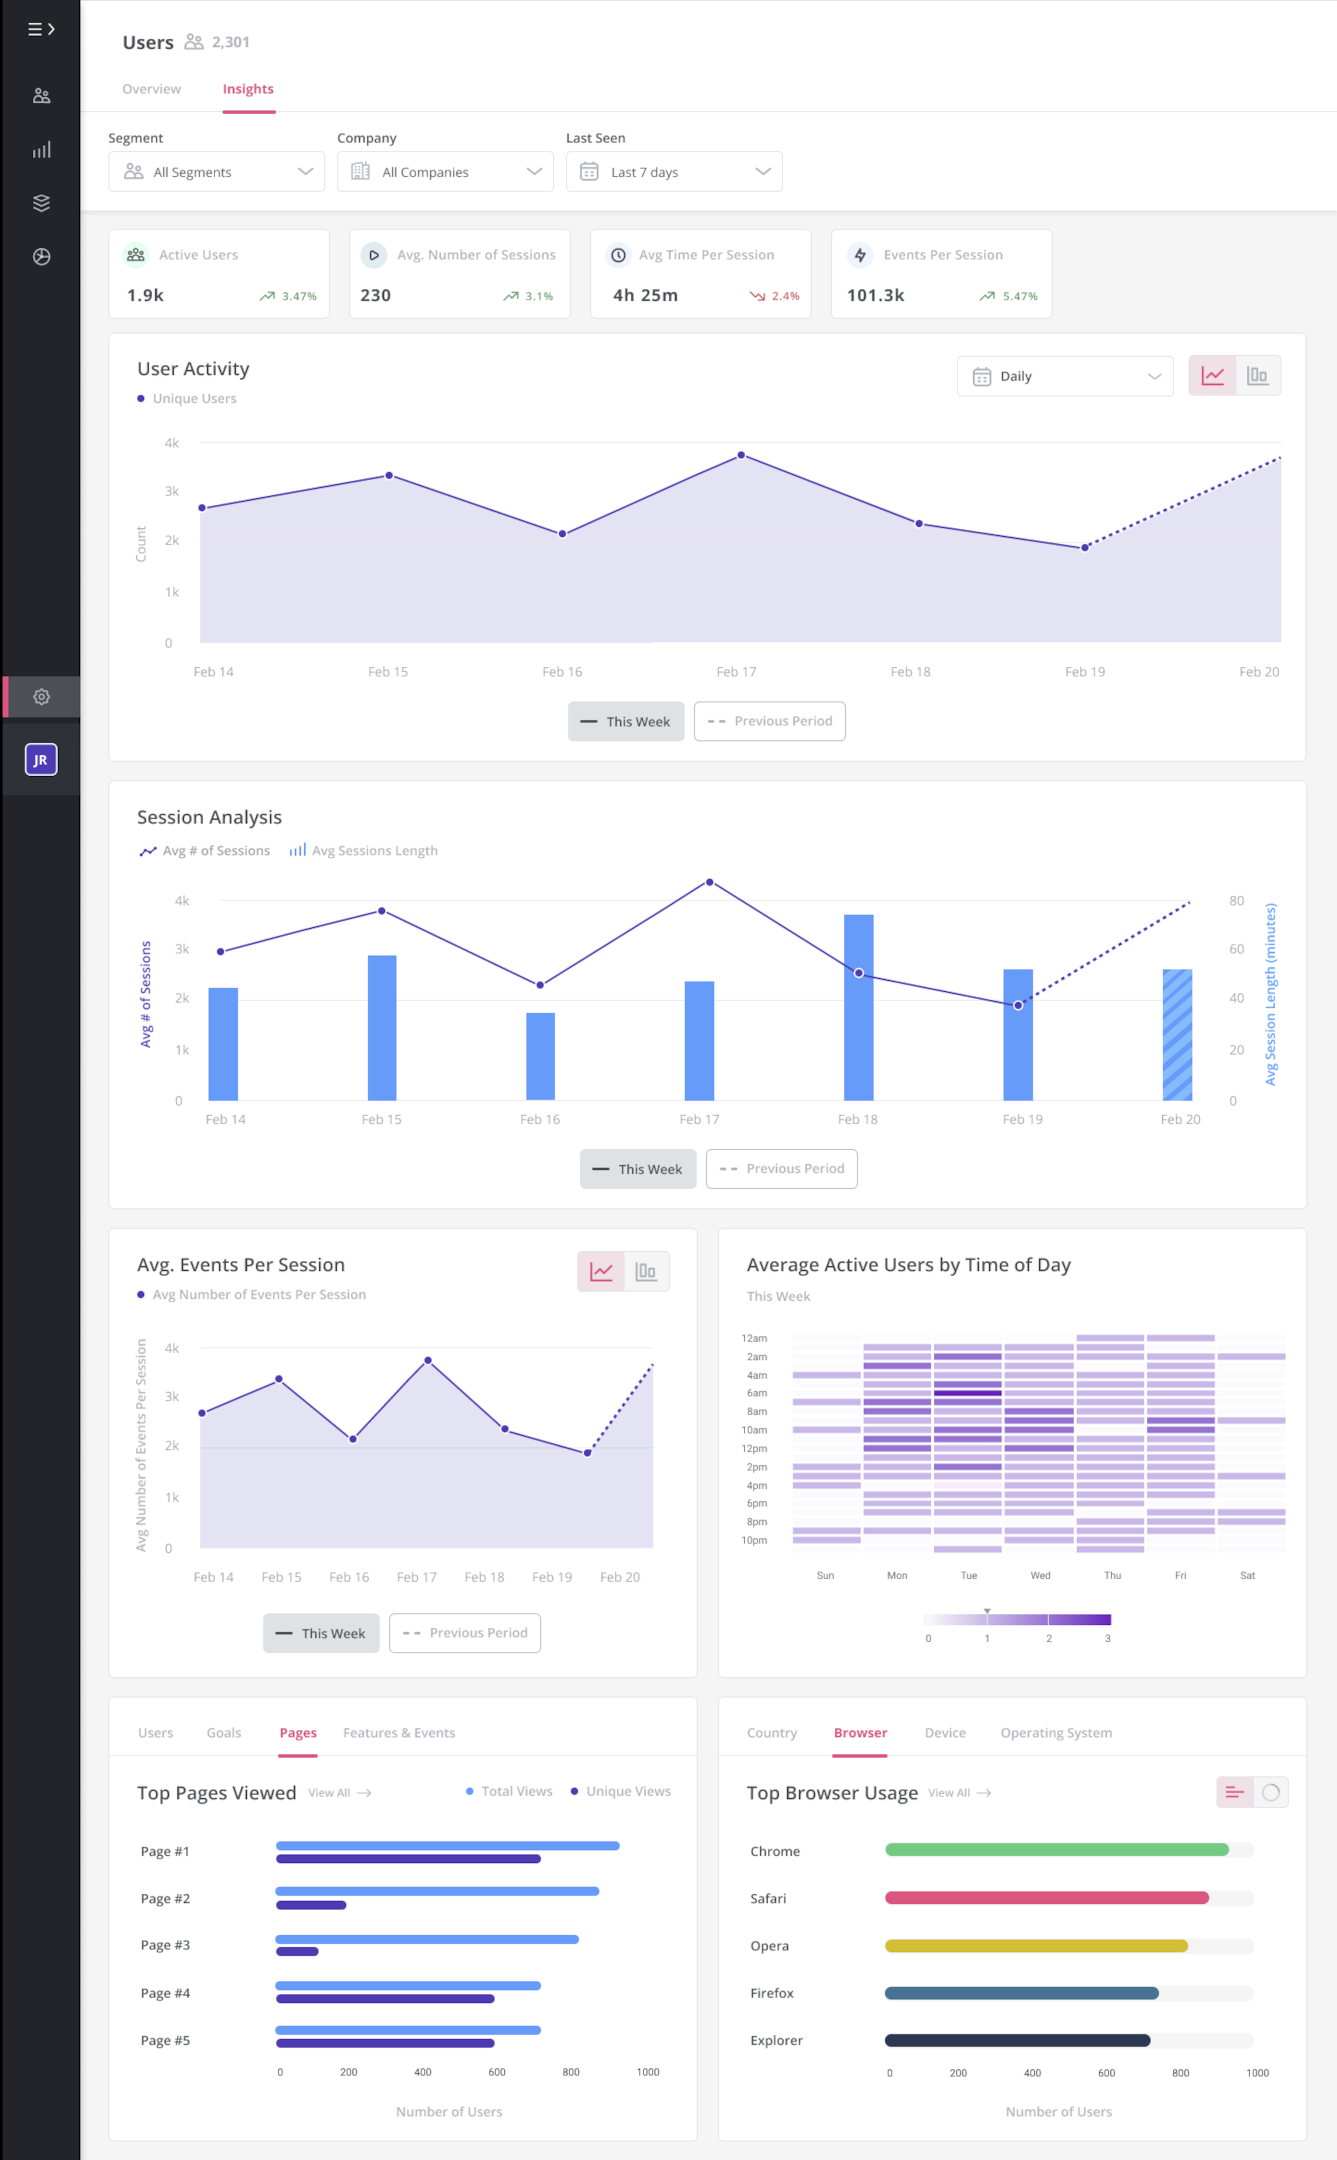
Daily active users, weekly active users, monthly active users
User engagement needs to be measured over a given period. Tracking engagement over each of these periods – monthly active users, weekly active users, daily active users – helps you understand key patterns.
Product stickiness rate
Product stickiness is the ratio of daily active users (DAU) to monthly active users (MAU). The resulting percentage tells you how often users return to your app.
When the ratio is 1:1, it means your whole user base is benefiting from your product all day, every day.
Feature usage
Closely track the usage of your product’s core features because they play a crucial role in improving your conversion and retention rates.
You can even measure engagement for every feature to learn which features are nailing it, which users don’t connect with, and which need to be promoted more.
It would be best to track feature usage metrics by segmenting users into cohorts. This will help you measure user engagement by learning what features are important for each kind of user persona.
You can then use these insights to personalize onboarding by helping users find relevant features.
Churn rate
High churn rates indicate your customers aren’t finding your product engaging enough. Compare your churn rate to engagement rate to identify users on the verge of churning.
This will help you come up with a target engagement threshold.
Retention rate
Retention rate is the opposite of the churn rate. The more users find value in your product and engage with it, the more likely they are to stick with your product.
How to use customer data for user engagement analytics?
Using customer data for user engagement analytics is a powerful approach to gaining insights into customer behavior and improving the overall user experience. Here are a few ways you can do it.
Segment customers to identify engagement drivers
By dividing your customer base into distinct segments based on various criteria such as company size, jobs to be done, in-app engagement, or product usage, you can gain deeper insights into their behaviors and preferences.
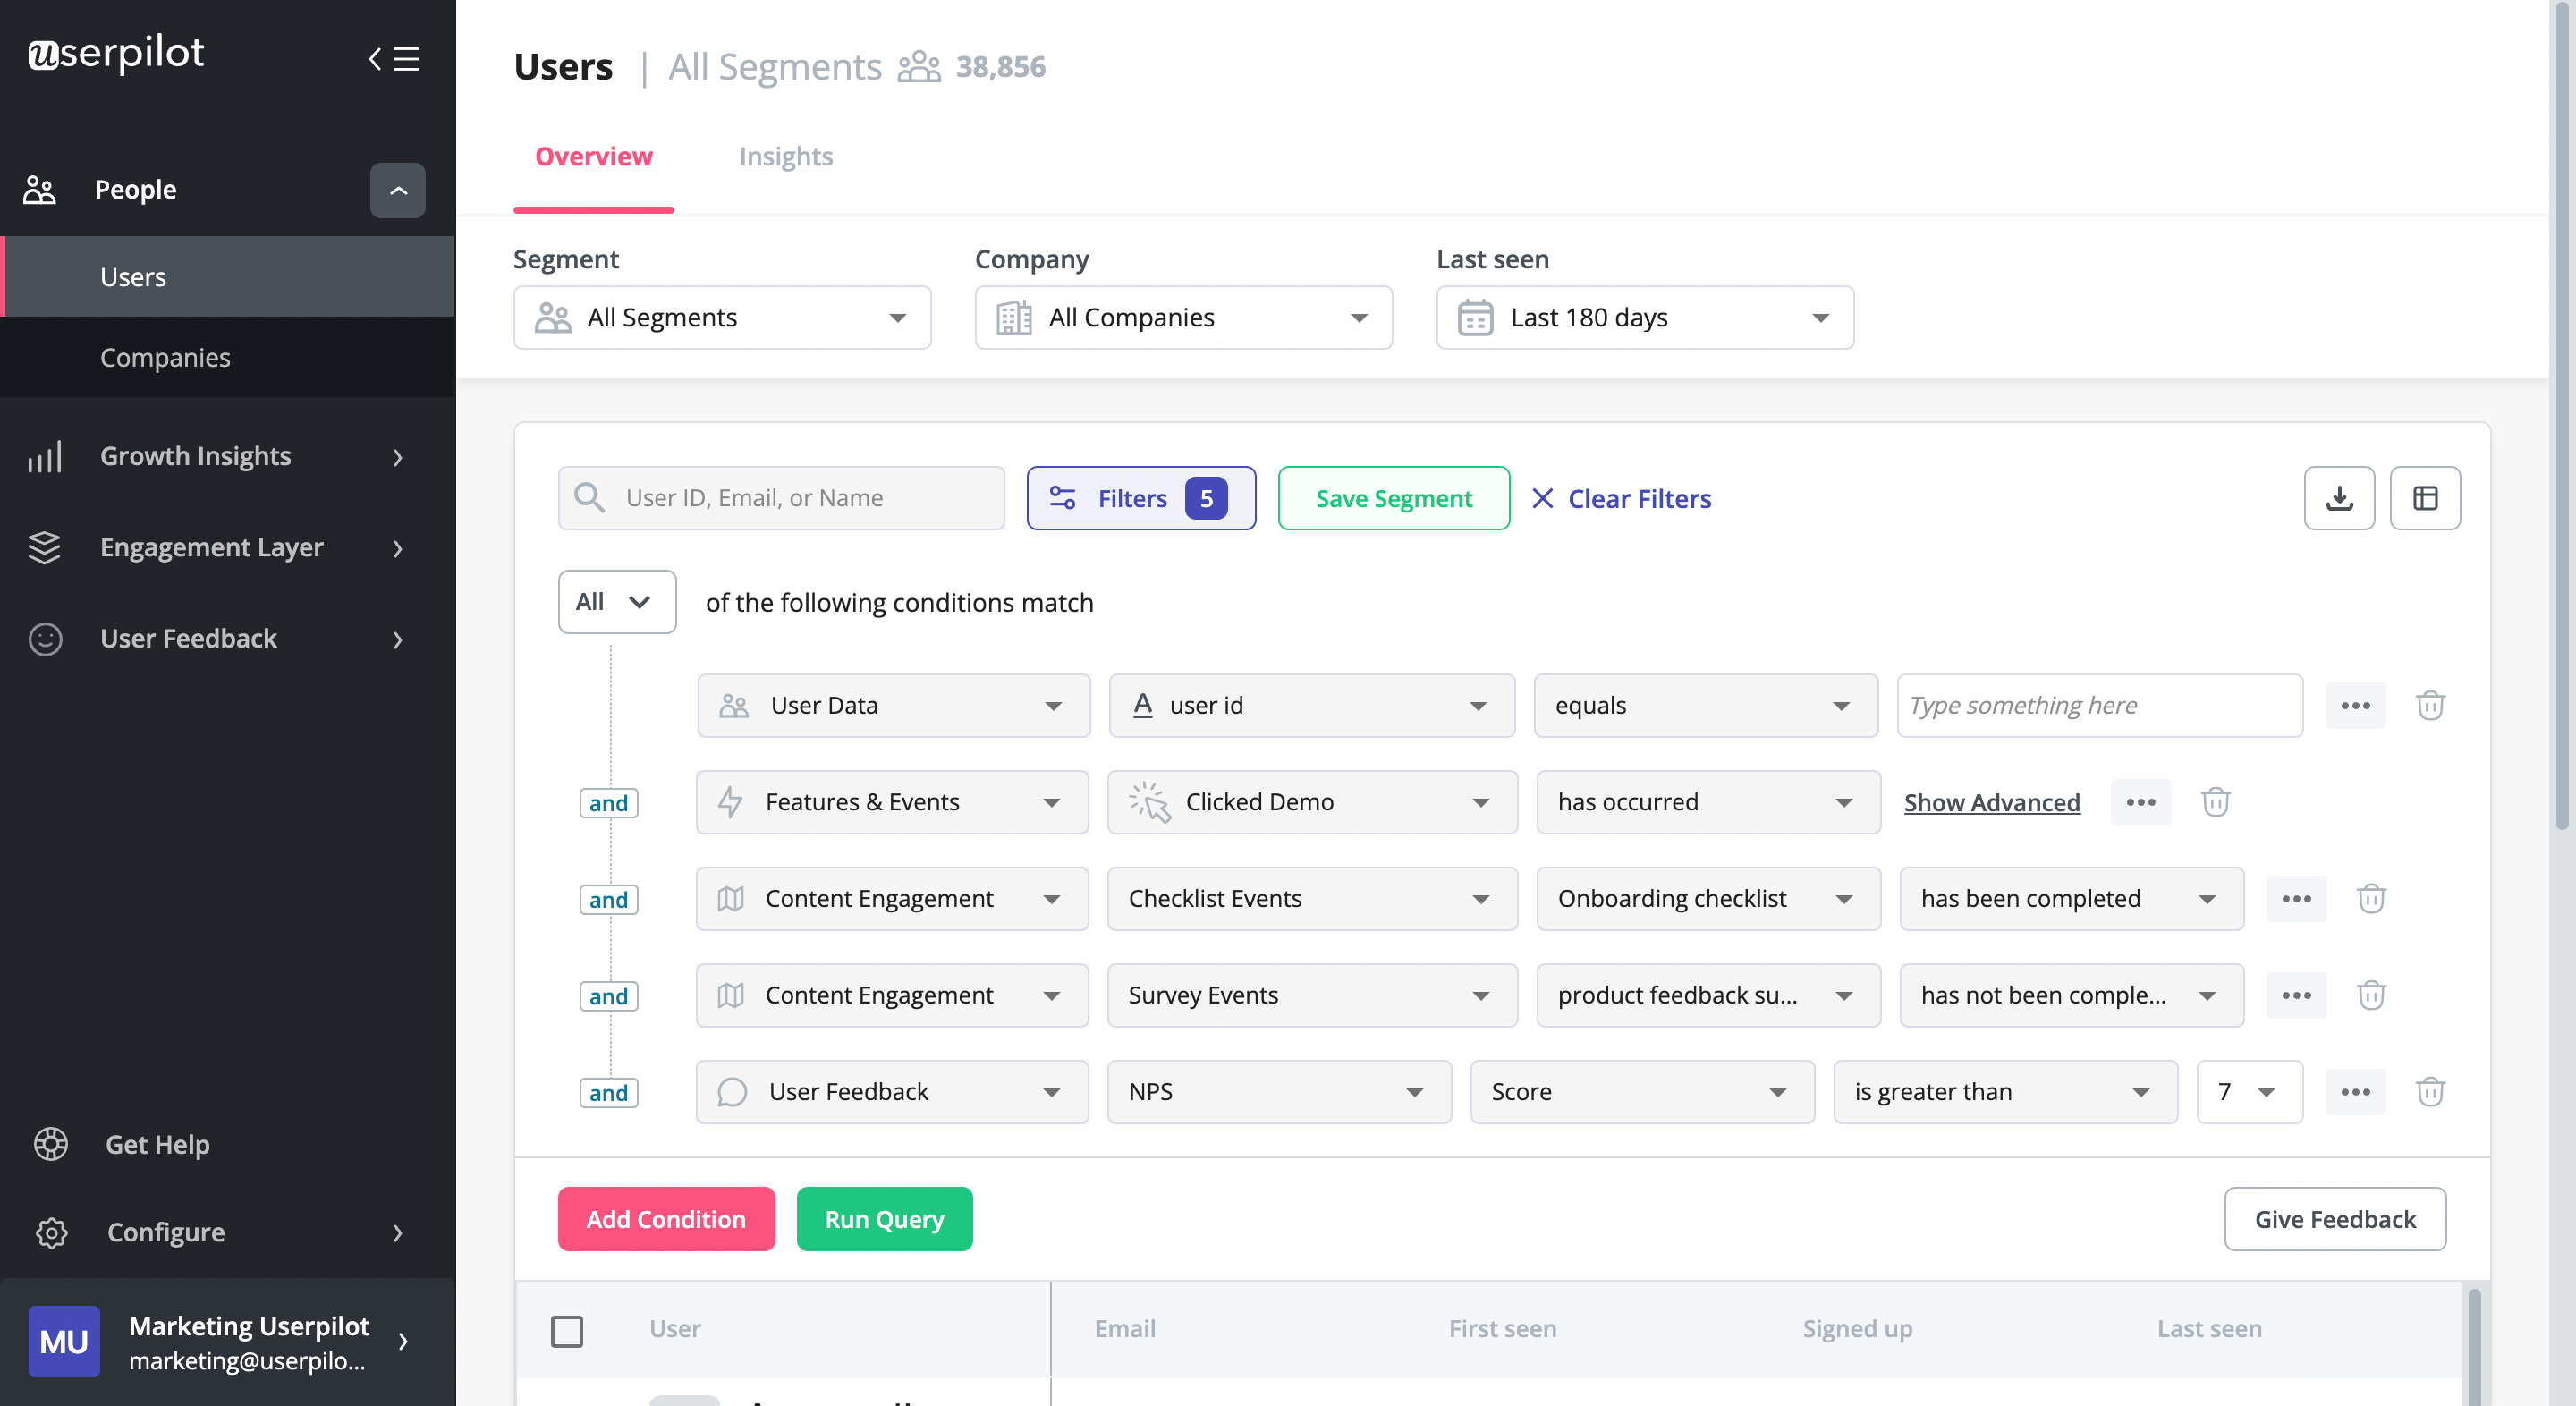
Segmenting customers helps you understand the unique characteristics and needs of different user groups. By analyzing the behavior and actions of each segment, you can identify the drivers that lead to higher engagement levels.
For example, you may discover that a specific segment of power users consistently engages with a particular feature or completes certain actions that drive their satisfaction and loyalty. Understanding these engagement drivers enables you to replicate and promote those behaviors among other segments, leading to increased overall engagement.
Leverage customer journey data to spot and remove friction
To drive engagement, analyzing your user’s customer journey progress is essential to know what to do.
You can collect customer journey data by setting up event tracking points – milestones that users need to reach or indicate important touchpoints. Once you have all the conversion events tracked, you can:
- Monitor the touchpoints across the customer journey map.
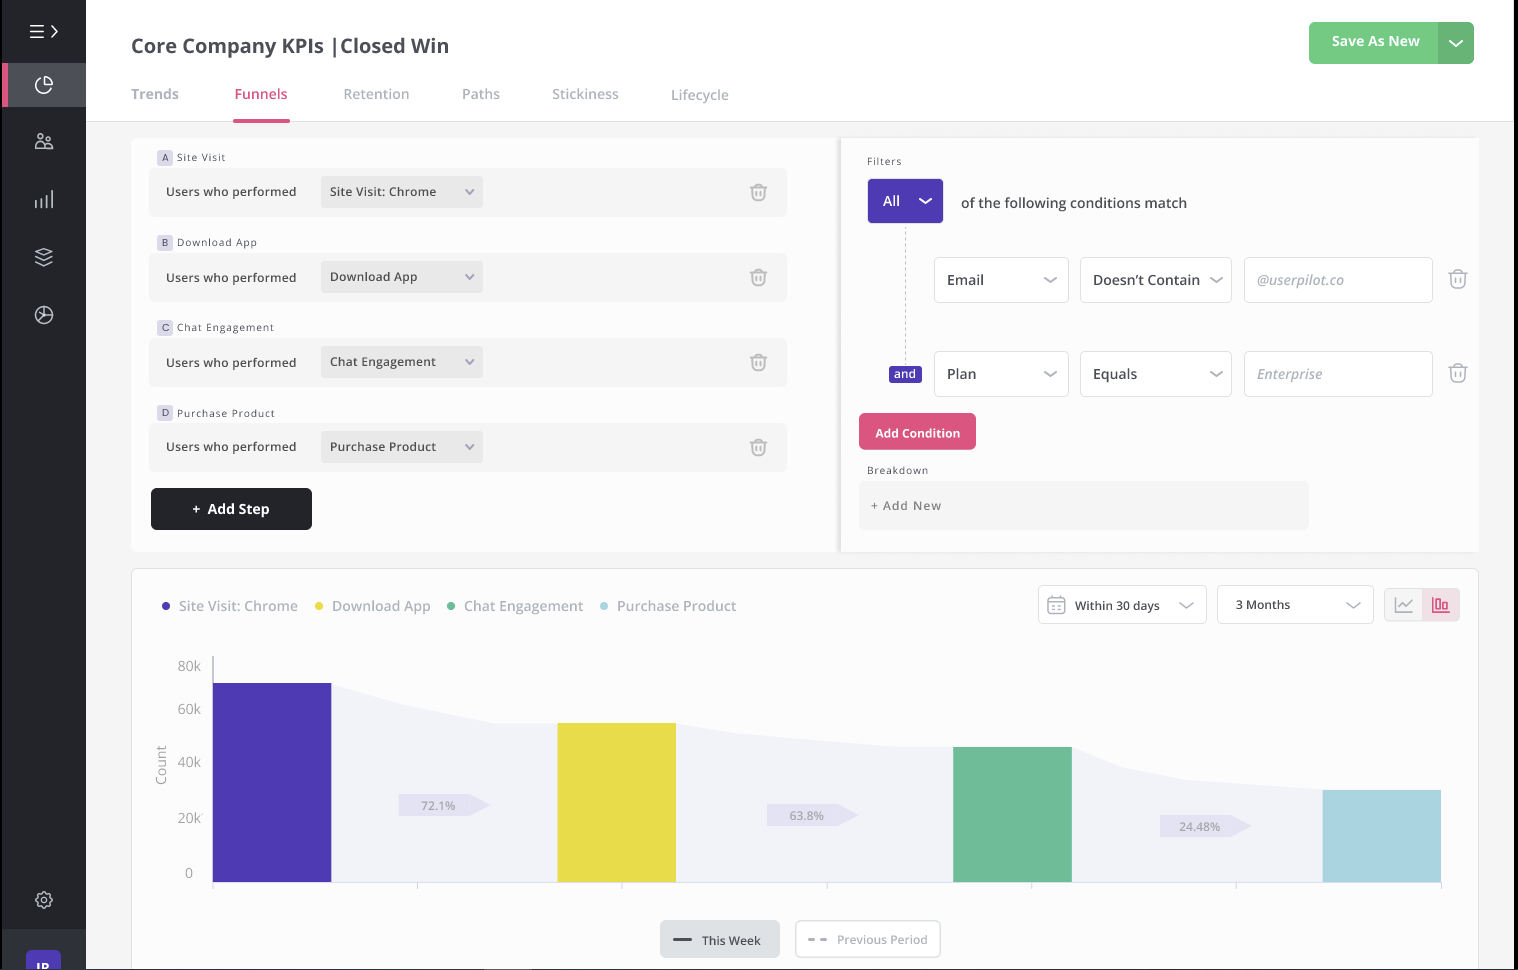
- Visualize the engagement funnel with a product analytics dashboard.
Funnel engagement analysis in Userpilot
How to boost user engagement and drive retention
In SaaS, the process of user retention begins just after a user achieves their Aha! Moment and adopts your product. As users engage more with your product and stick around longer, customer satisfaction improves, making them more likely to become brand advocates.
Thus, it’s not surprising that improving retention by 5% can boost revenue by 25%-95%.
The level of user engagement depends on your user’s positions in the marketing funnel. The further they are in the funnel, the more features they start to adopt. As this goes on, your user engagement continues to improve.
Here are a few tactics in user engagement analytics that you can use to boost engagement and improve your retention rate.
Personalize your onboarding process to drive user engagement
Personalization and a smooth onboarding process are crucial for a good user experience. Onboarding introduces your product to users and demonstrates its value. Personalization strengthens the relationship between your product and customers, increasing user engagement.
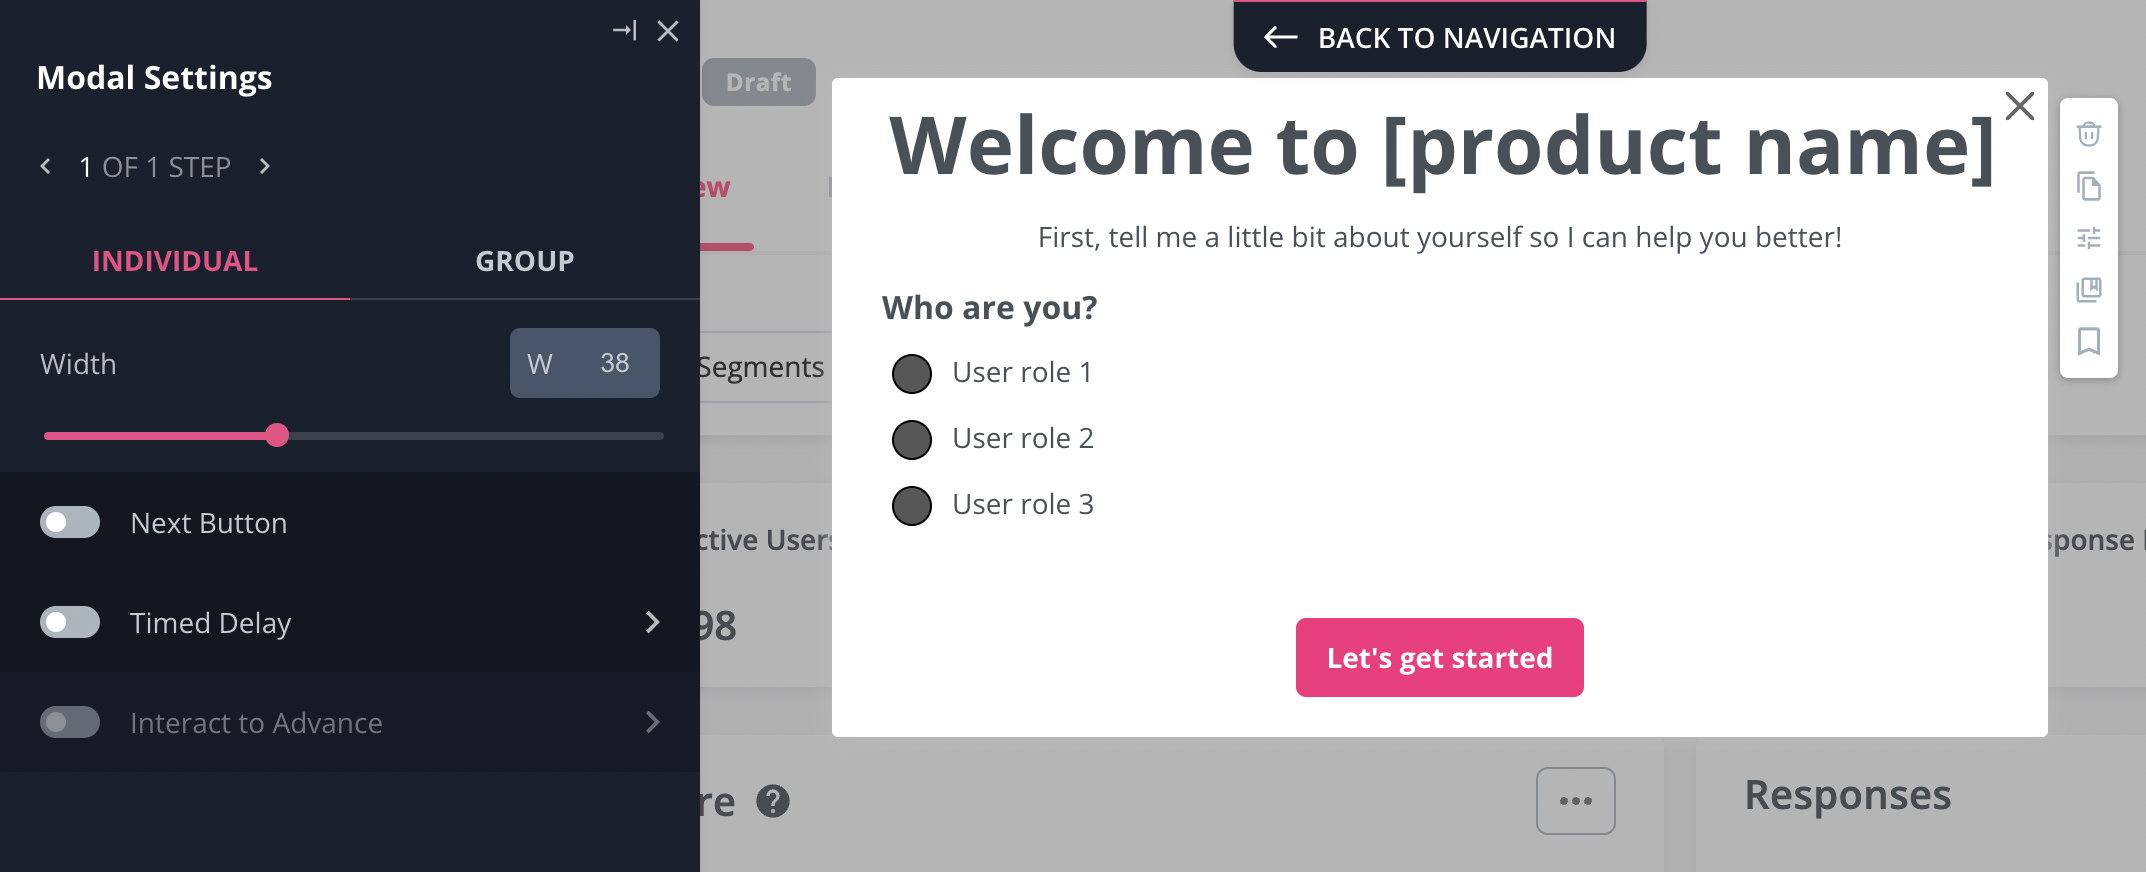
To create personalized onboardings, segment your users based on their “Jobs to Be Done” (JTBD), which are specific tasks they want to accomplish with your product. Each cohort represents a group of users with similar JTBDs.
Using tools like Userpilot, you can design tailored onboarding flows for different customer segments. This targeted approach ensures that users receive a customized experience aligned with their needs and increases their chances of success with your product.
Use interactive walkthroughs to help users understand your product
An interactive walkthrough is a step-by-step guide that leads to activation. Users trigger the next steps in the walkthrough as they keep performing actions.
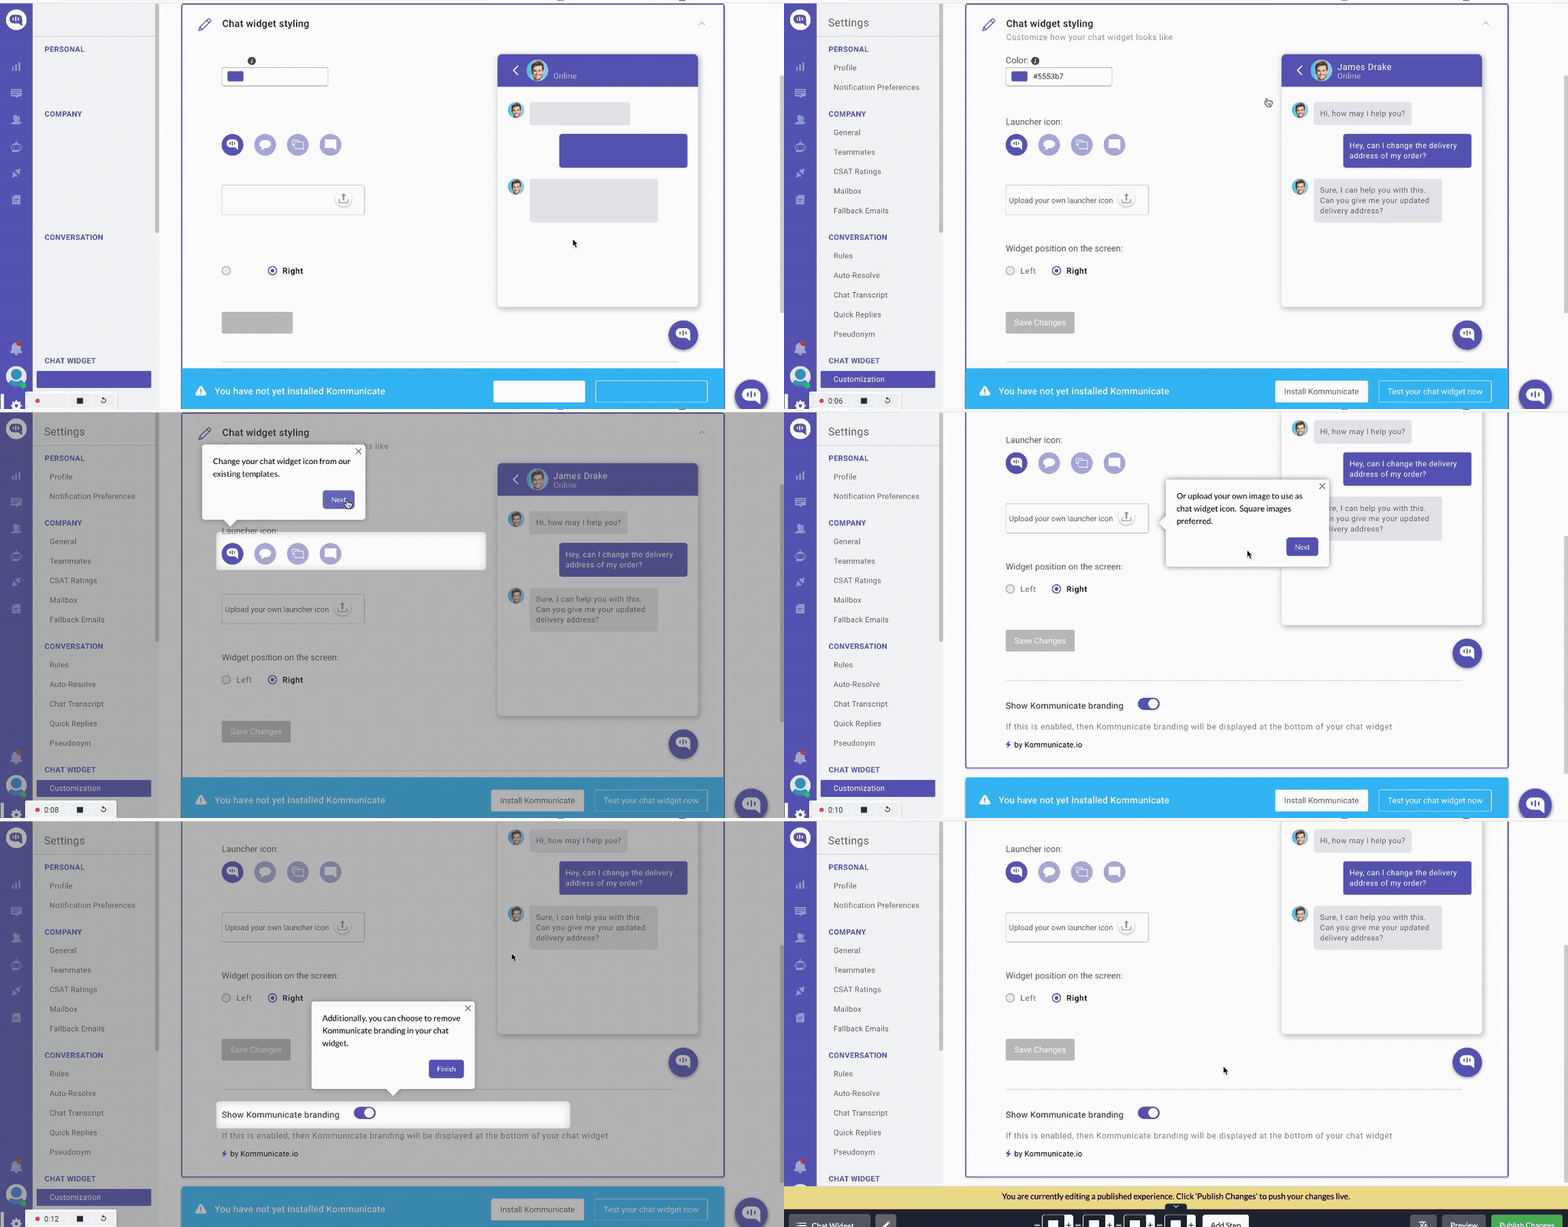
It focuses on one or two key actions at a time. Because users learn by doing and are not forced to perform action 2 before completing action 1, an interactive walkthrough helps them reach value (activation) very quickly. This decreases your Time to Value (TTV).
You can use interactive walkthroughs for new user onboarding, promoting secondary feature adoption, driving upsells, and reducing support costs. By providing step-by-step guidance and delivering value at various stages of the user journey, interactive walkthroughs improve user engagement and contribute to higher user retention.
Offer self-service support to enhance user experience
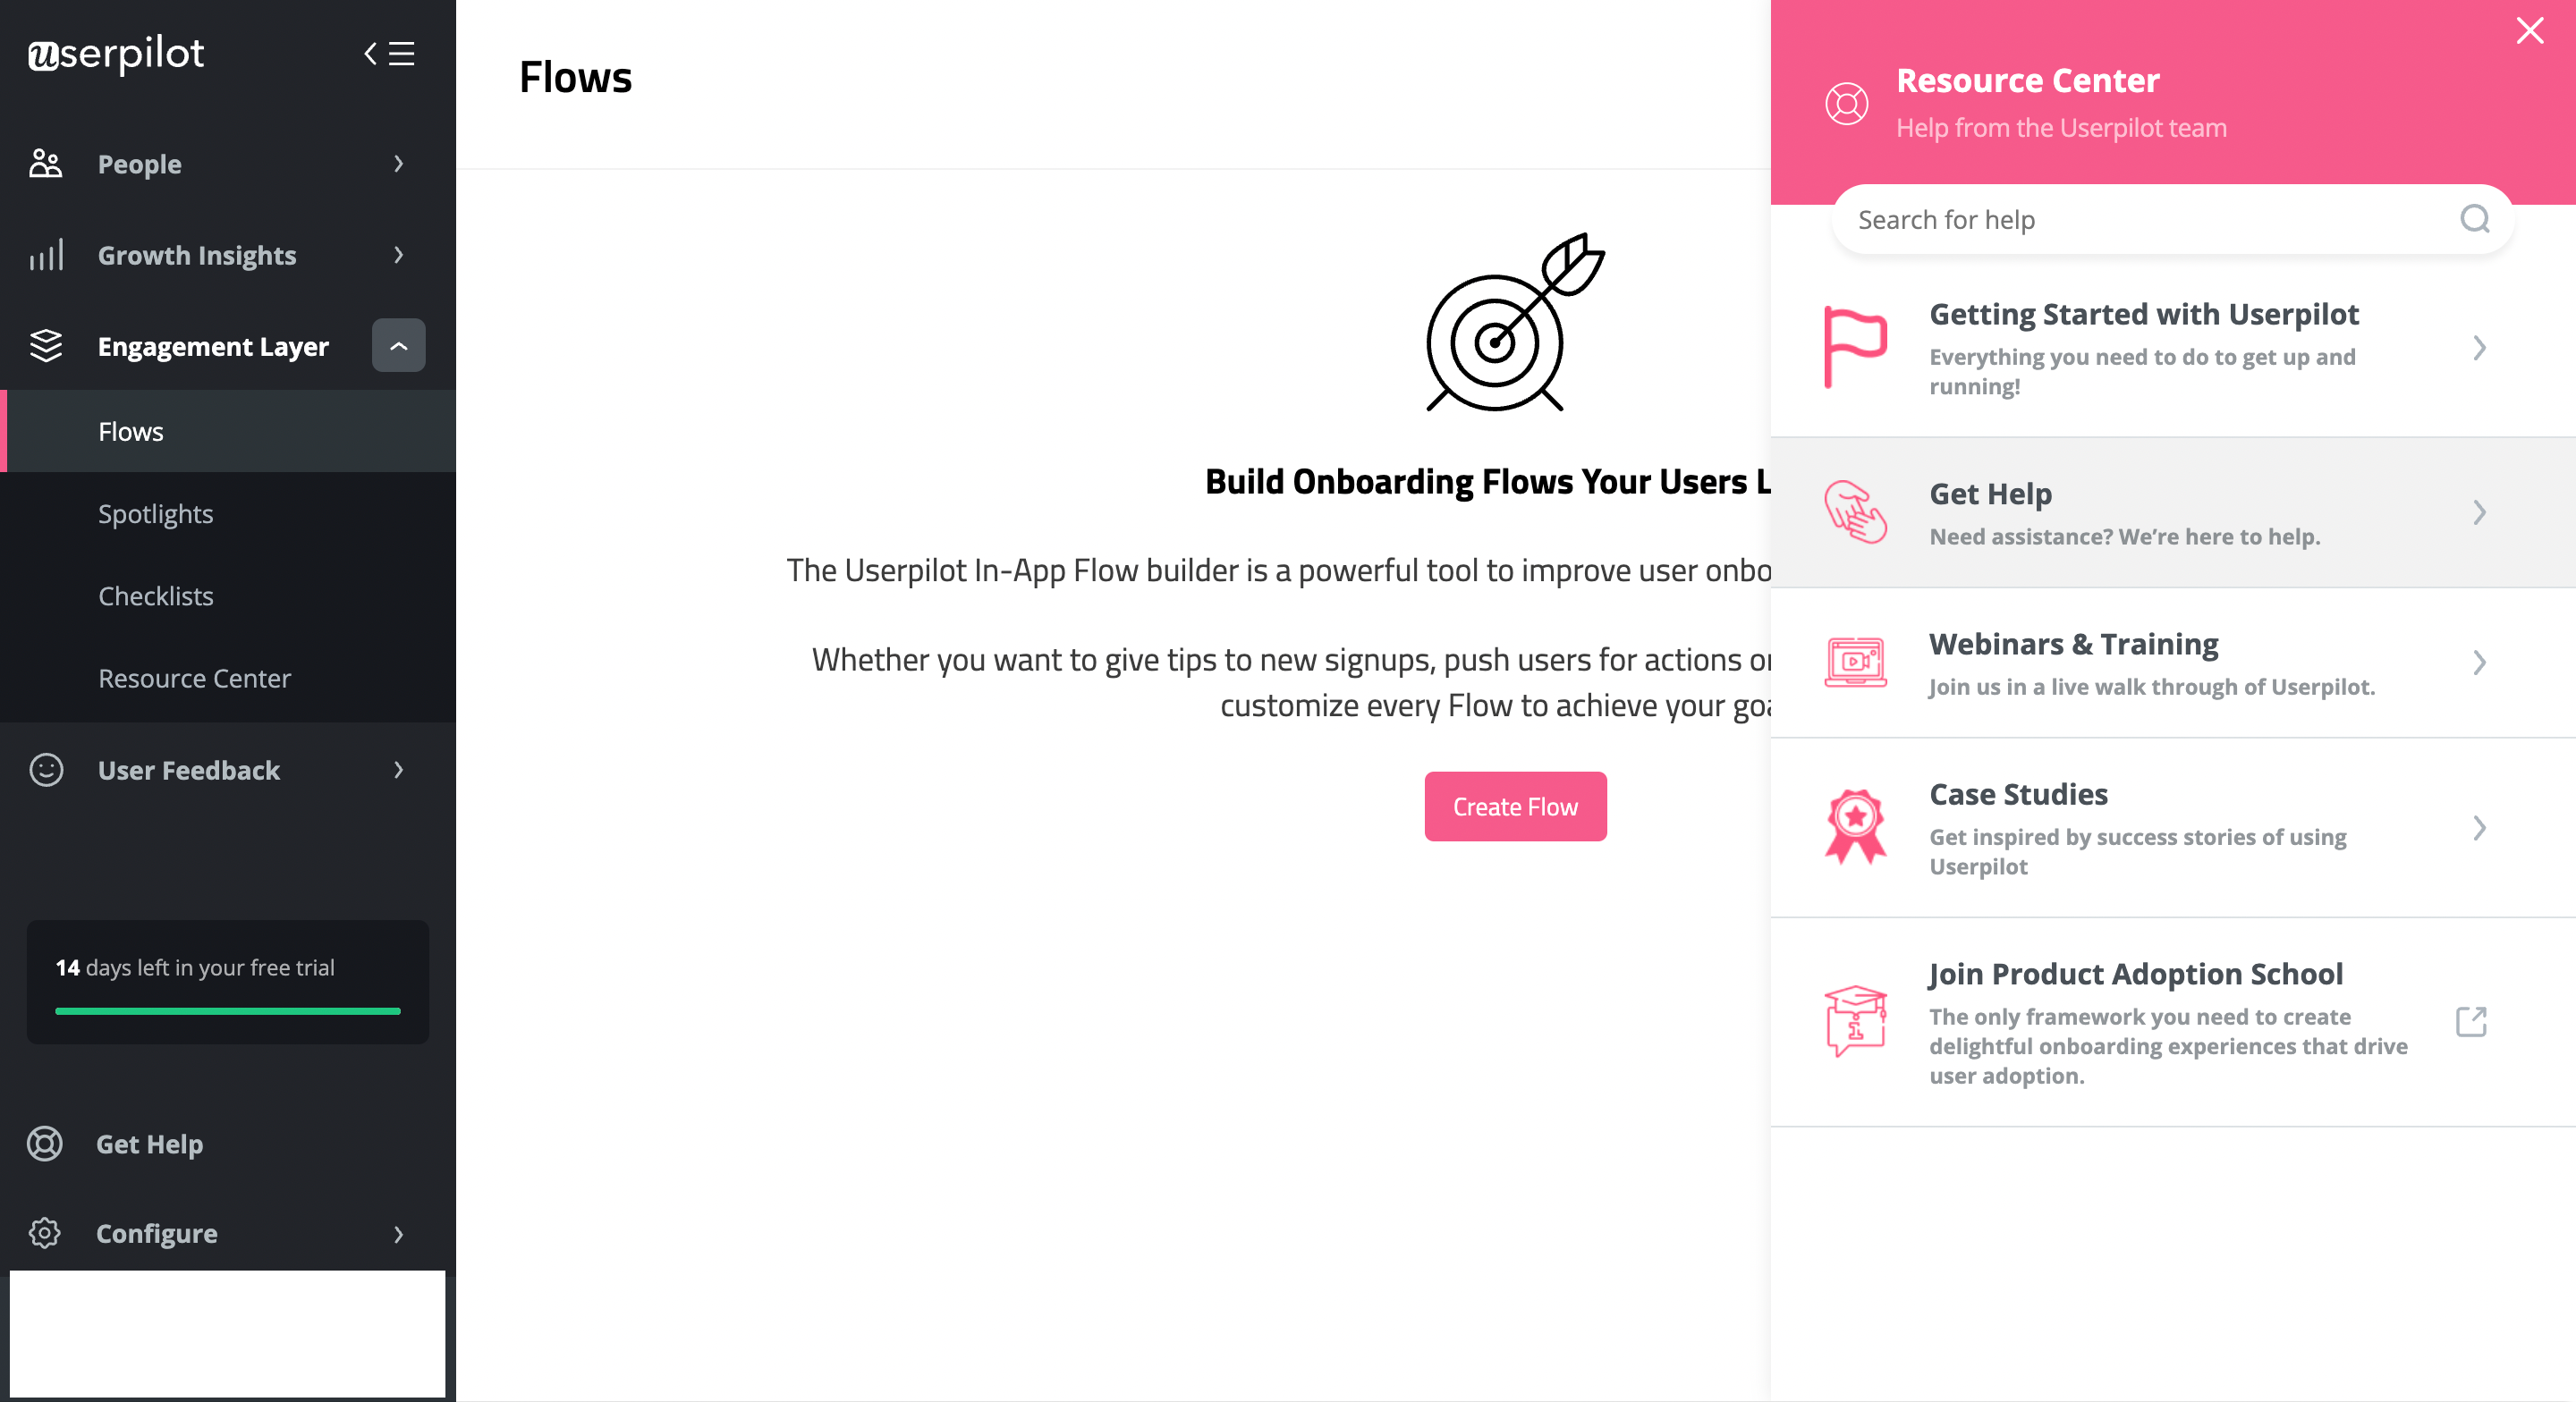
Self-service support tools such as chatbots, knowledge bases, and help centers enable users to solve problems on their own, reducing the need for direct support assistance.
In-app guides, including knowledge bases and resource centers, are effective in increasing retention rates and facilitating successful conversions. You can include different education formats such as help articles, FAQs, product documentation, etc. to better serve different learning preferences.
Collect and act on customer feedback to improve customer retention
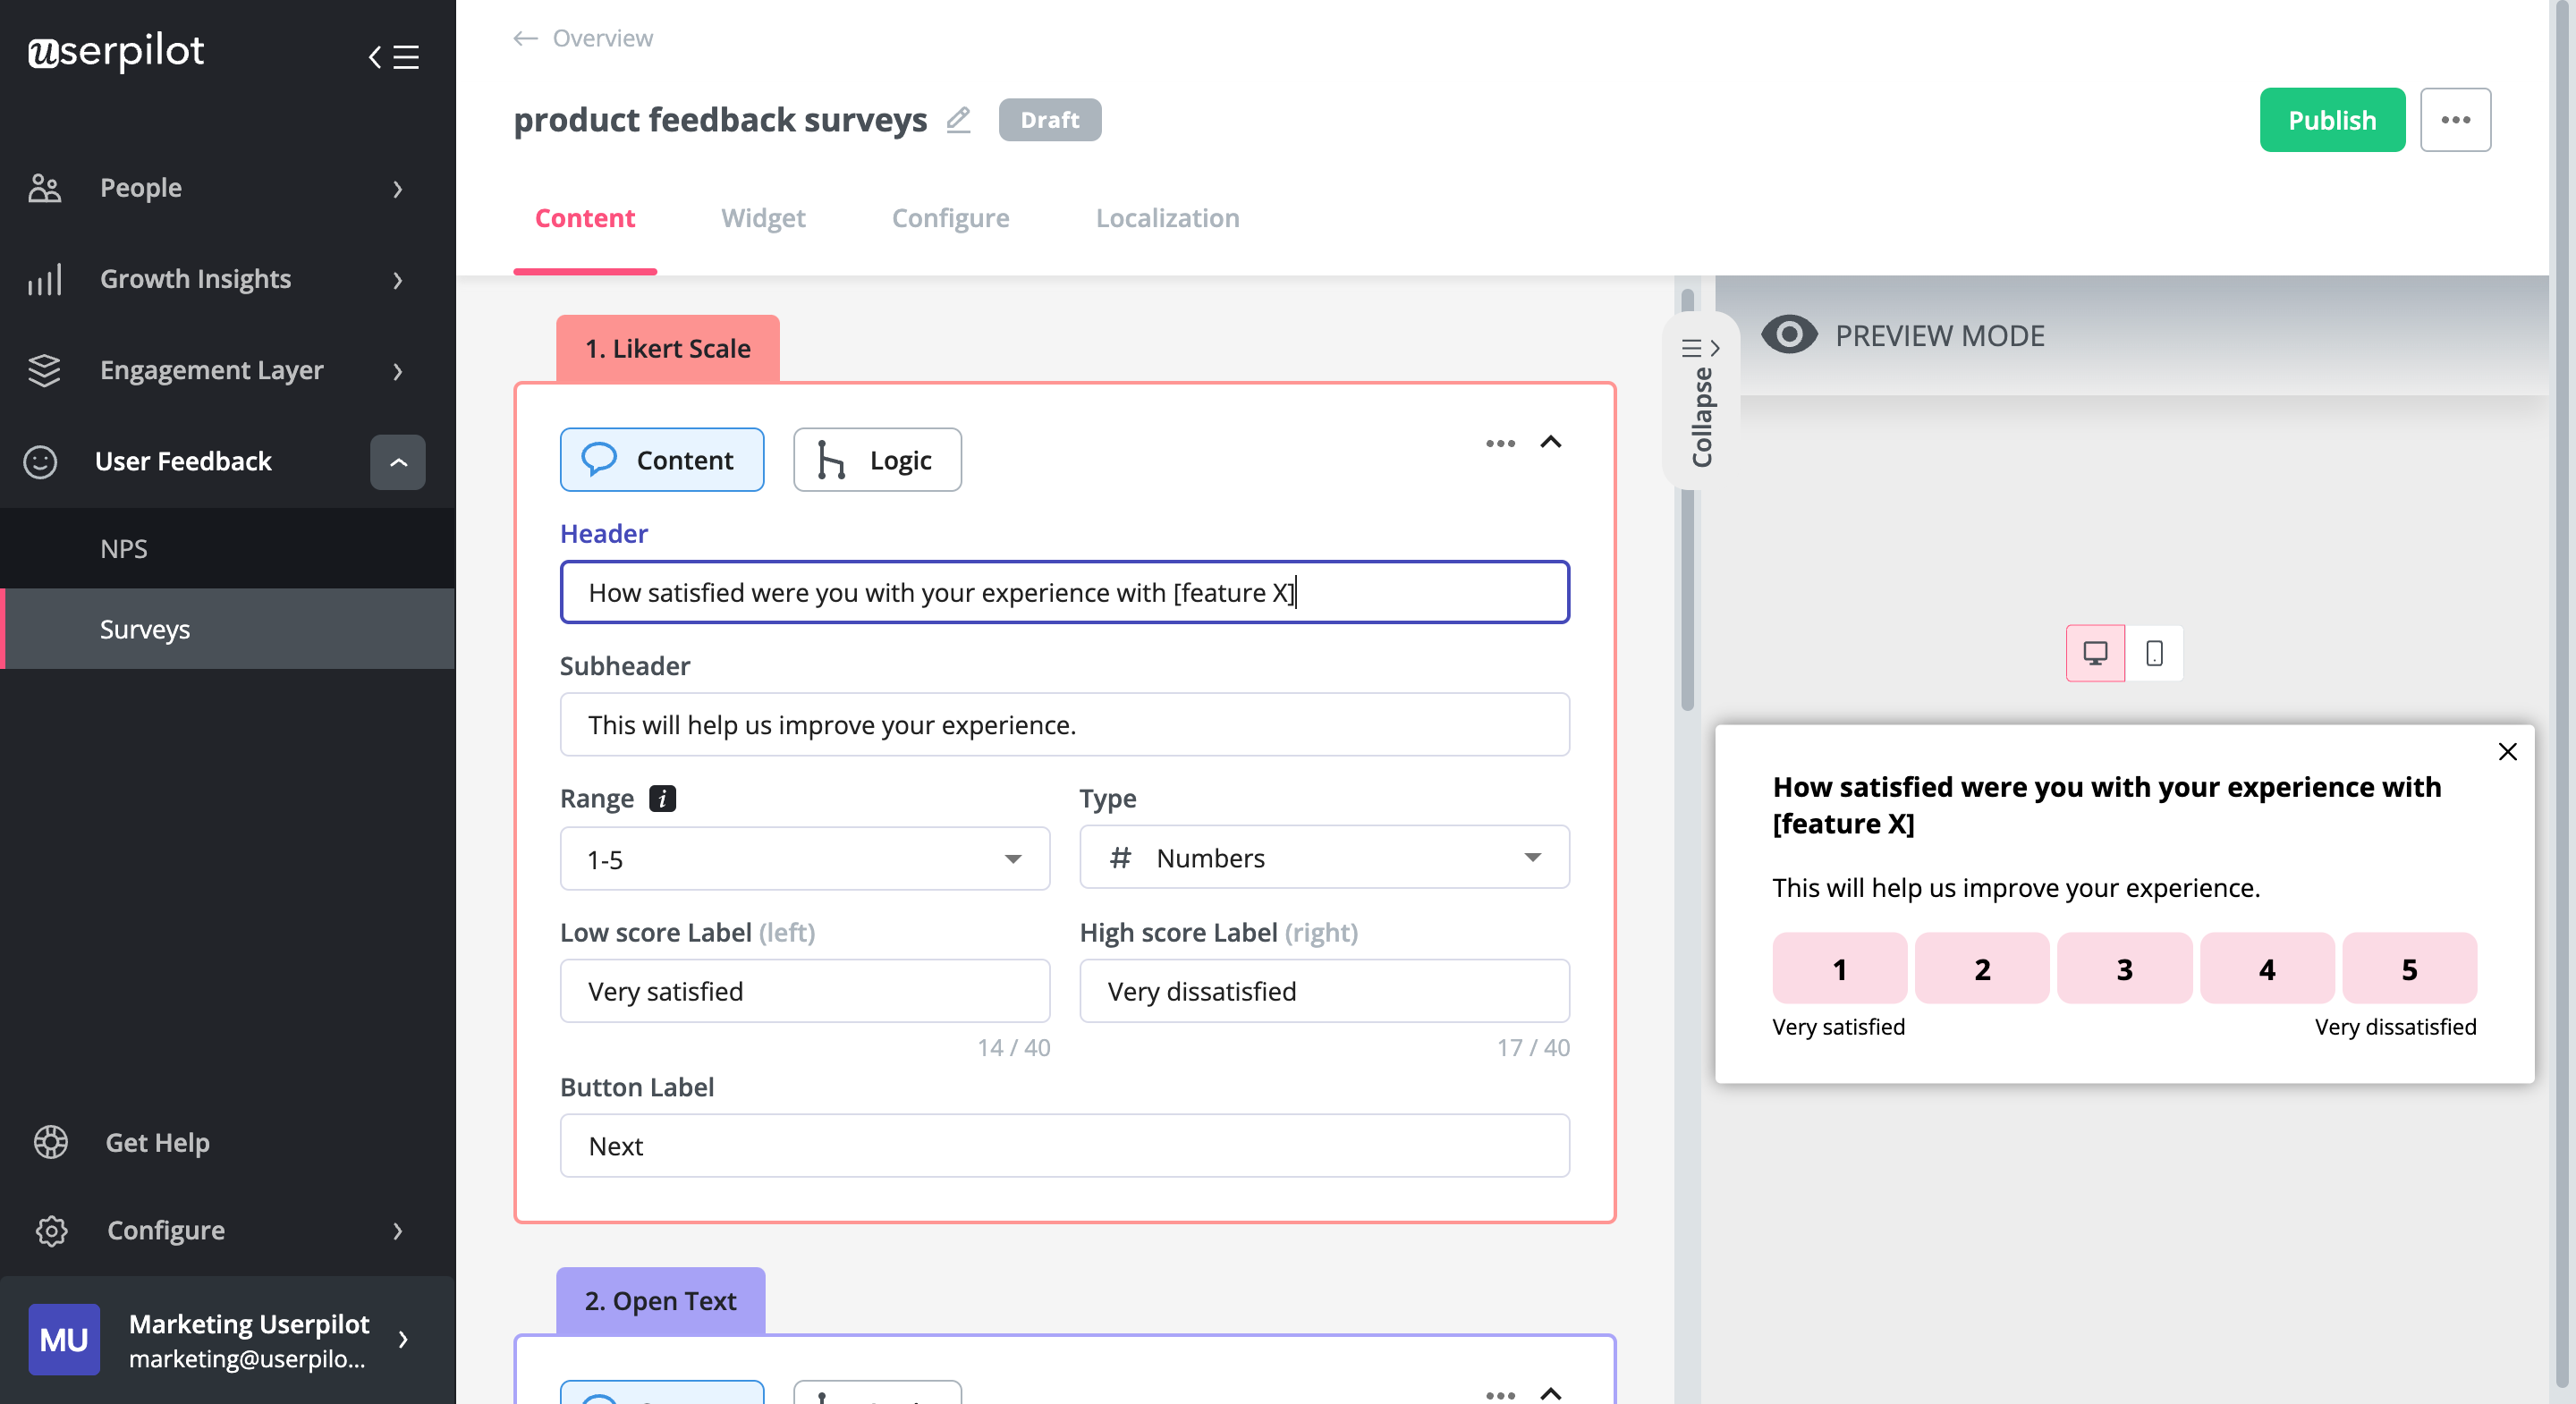
You can use micro surveys which are short forms, often displayed in-app to collect the user feedback you need to make product decisions for sustainable growth.
They concentrate on a specific question and can thus focus on a specific use case, such as gaining product development data from a feature request survey.
You can offer micro surveys to specific user segments, such as users who activated a particular feature. The data collected can help you make informed product roadmap decisions and eventually lead to greater engagement and growth.
Measure customer loyalty to build and retain engaged users
Customer loyalty score, alongside other engagement metrics, is an important indicator of customer satisfaction and loyalty. It provides insights into the level of customer commitment and their likelihood to continue using a product or service.
You can use tools like Userpilot to trigger in-app Net Promoter Score (NPS) surveys or Customer Satisfaction (CSAT) surveys to measure customer loyalty and create follow-up questions to further uncover drivers of churn and retention.
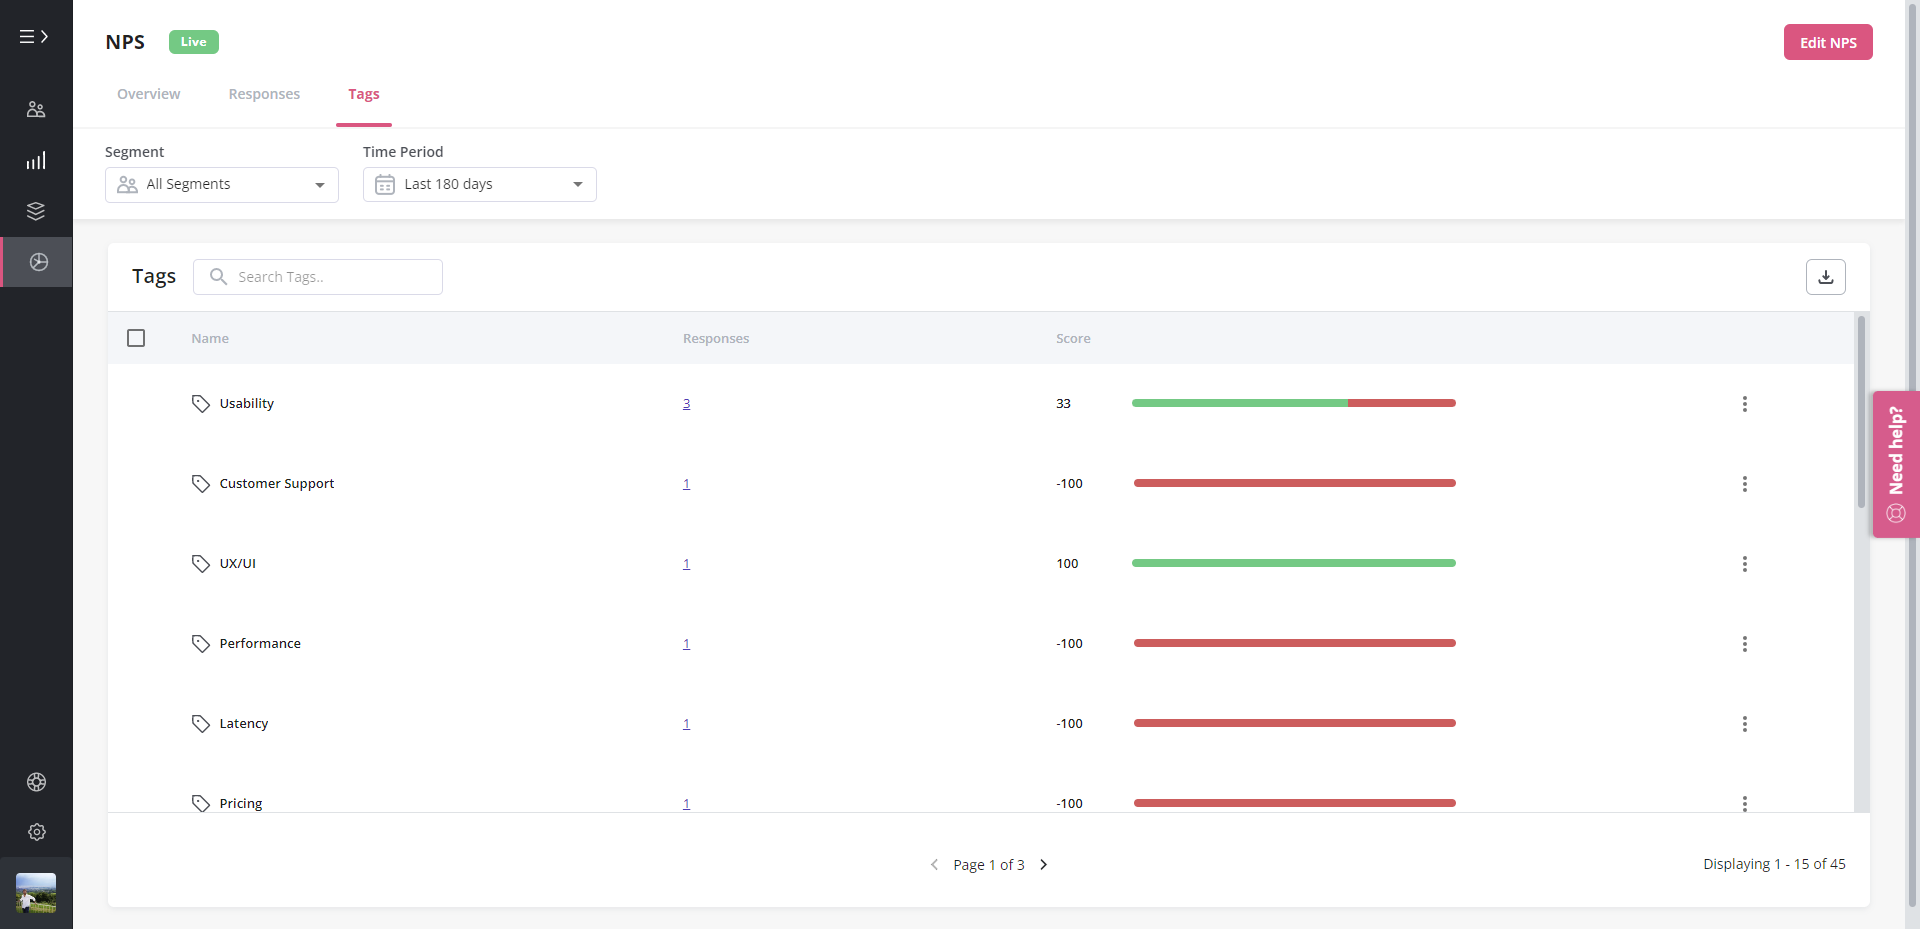
By tagging NPS responses, you get to know what makes users satisfied and engage with your products and also what makes them churn.
Conclusion
User engagement analytics is critical to understanding user behavior and improving user experiences. The more users benefit from your product, the more they engage with it and want to stick around.
From personalized onboarding and interactive walkthroughs to in-app guides, NPS, and micro surveys, you can leverage multiple tools to make your users happy.
Ready to boost user engagement? Get a Userpilot demo and see how you can significantly increase your customer retention rate.
Try Userpilot and Improve Your User Engagement!
