9 In-App NPS Survey Examples to Measure Customer Satisfaction in SaaS


Looking for the best examples for designing and implementing an in-app NPS survey? You’ve landed in the right place.
Net Promoter Score (NPS) is one of the most popular and effective ways to measure customer satisfaction and loyalty in a SaaS business.
In this article, we’ll cover what an in-app NPS survey is, how to calculate it and measure user sentiment. We’ll also break down some of the best examples from SaaS businesses and finally, explore the best product tour software tool for the job.
What is an in-app NPS survey?
An in-app NPS survey is a user survey designed to measure customer satisfaction and loyalty by asking customers how likely they are to recommend your product.
It typically involves two questions: an 11-point scale (from 0-10) to collect quantitative feedback and a qualitative follow-up question for more detailed feedback.
How to calculate Net Promoter Score?
To calculate the Net Promoter Score (NPS), you first need to collect in-app survey responses. Based on the NPS scores, users are grouped into three categories: detractors, passives, and promoters.
- Detractors (scored 0-6): These are customers who are unhappy with your product and are not afraid to show it.
- Passives (scored 7 or 8): passives are middlemen; they show no particular interest or enthusiasm to refer other people to your product.
- Promoters (scored 9 or 10): promoters are customers who leave a positive review. They’re mostly power users who use your SaaS product regularly and advocate for it at every chance.
To calculate your NPS score, subtract the detractors from the promoters and divide it by the total number of respondents.
NPS = (Number of Promoters – Number of Detractors) / (Number of Respondents) x 100
9 In-app NPS survey examples to gauge user satisfaction effectively
In this section, we’ve compiled some of the best in-app survey examples from SaaS companies. Use this as inspiration to design your own survey.
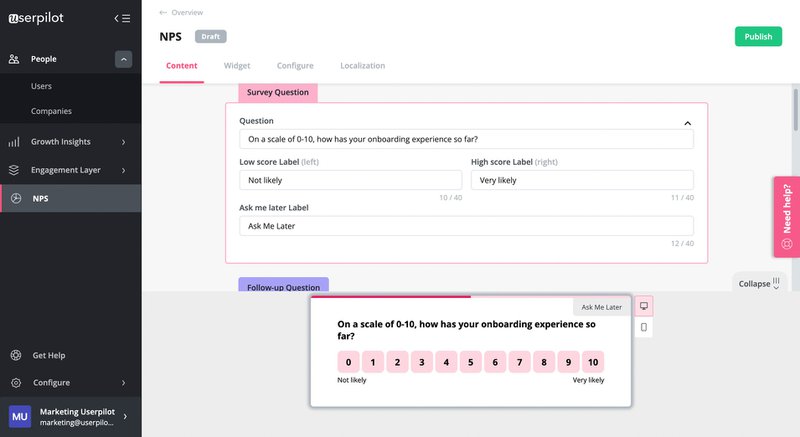
Collect customer feedback during onboarding to drive product adoption
User onboarding is a continuous process of actively guiding users to discover the value of your product. The quality of your onboarding experience can help users quickly decide if your product is worth it.
That is why Userpilot employs in-app NPS surveys to gain valuable insights into the onboarding experience.
Instead of asking “how likely are they to refer your product?” (which wouldn’t make sense at this point), they make the question more specific by asking about onboarding.
This is helpful to easily identify and remove onboarding friction that could prevent users from reaching product adoption sooner.
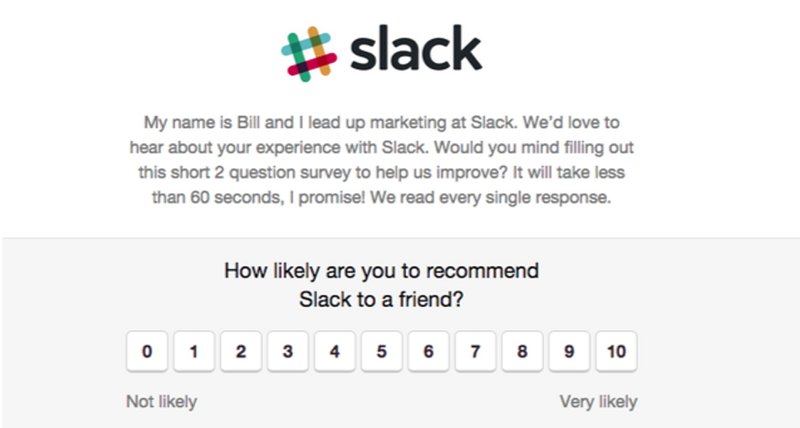
Humanize NPS survey messages to be more approachable
From onboarding, Slack makes it a mission to personalize its user journey. So, it’s no surprise that their in-app NPS survey takes on a casual and friendly tone.
Right off the bat, Slack introduces a member of their marketing team which makes the survey message more approachable and human. This sets a positive mood and makes the respondent feel appreciated.
What Slack does is a great example of how to speak to users without sounding spammy. In turn, this increases their response rate and the quality of NPS feedback.
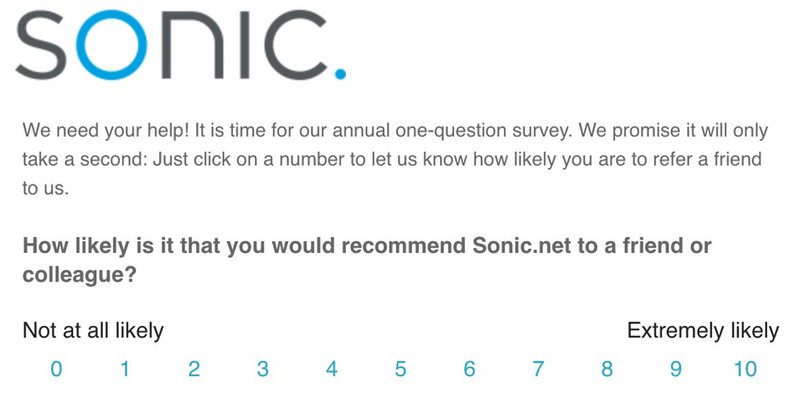
Add context to NPS surveys to increase the response rate
Sonic’s NPS campaign is one great example for SaaS companies to model. It’s spot on, very compelling, and makes the respondent feel like they’re a part of something important.
They add a contextual message to NPS surveys in a conversationally appropriate way. This makes respondents feel relevant and that their opinions really matter.
Users who read this are more likely to take their time to respond which helps them collect better NPS results.
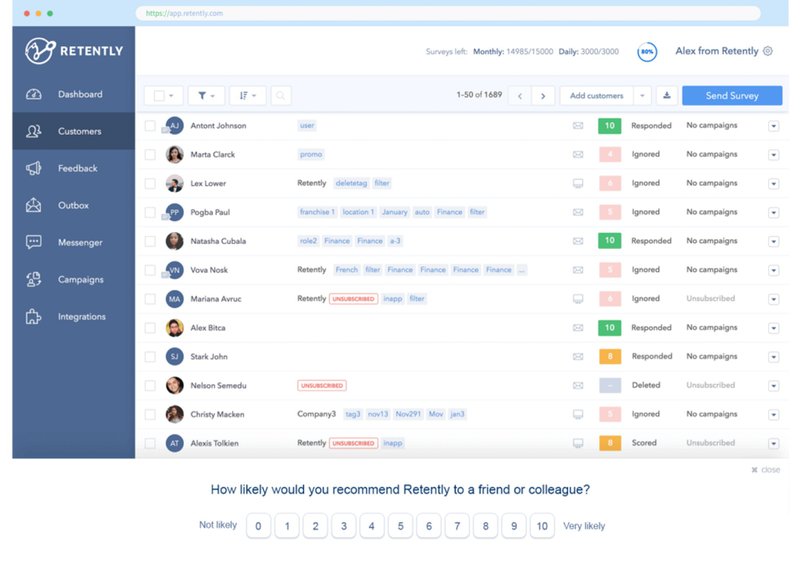
Place NPS surveys at the screen bottom to improve customer experience
In-app NPS surveys don’t have to be obstructive–and Retently is teaching us just that. Instead of a large modal pop-up which can be intrusive, they place their NPS survey at the screen bottom.
Users can finish their ongoing tasks and provide feedback in their own time. Retently also makes their survey simple, so that users can click once and be done with it.
Use NPS survey banners to avoid covering UI elements
Compared to the overlaying example above that may cover buttons or UI elements, Asana opts for a less obstructive element—notification banners. Banners are simple tools, but they have the power to pass a message without interrupting the user experience.
Asana’s in-app survey example is great because it blends flawlessly with its UI and does so with a minimalist approach. Plus, they ask one simple question that users can respond to without losing track of their actions.

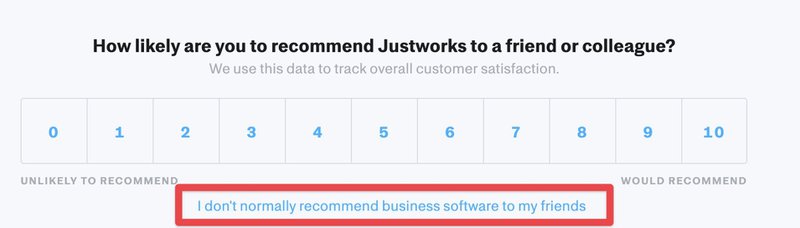
Give users an option to opt-out
NPS survey is all about users leaving their honest opinions; don’t make them feel forced to do so. This example from JustworksHR shows us exactly how to do so.
By inserting a simple opt-out option, the surveys feel freer and less forced. Users can easily dismiss it if it’s not the right time. This single step can increase the credibility of their NPS survey responses and help them collect better responses.
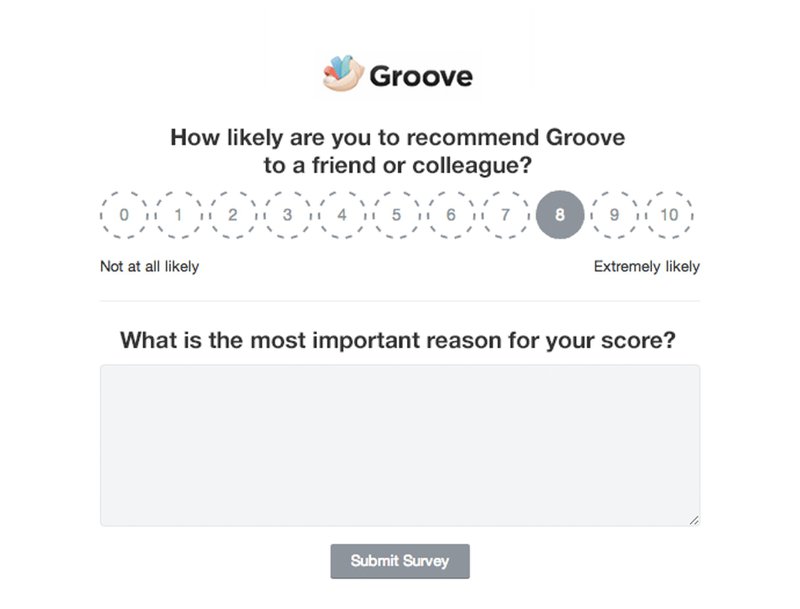
Include a follow-up question to collect qualitative responses
Using a number scale gives good feedback; the real juice is in collecting follow-up questions. This is great for collecting qualitative responses and actionable feedback.
Users can share their opinions and give reasons for their scores. With Groove, you can see how this works. Their follow-up question asks users specifically for the reason why they left the score, so they can always answer if they score both ways.
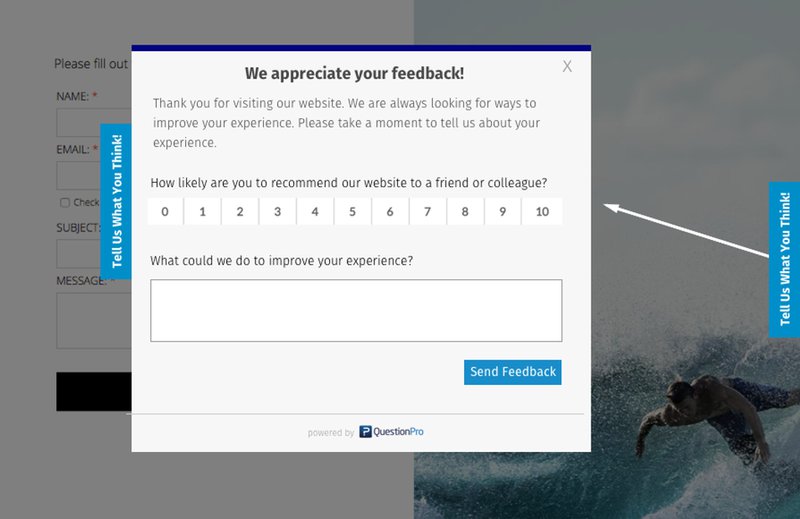
Use the feedback tab to collect NPS responses less intrusively
Like banners, feedback tabs also work great for collecting in-app NPS surveys in a non-obtrusive way. A feedback tab is a clickable button hanging on the side of a screen that opens up a survey form when clicked.
It is more passive in the background and often blends seamlessly with the UI, so users are less disturbed when working. And because it’s always on, users can easily drop their feedback anytime which makes it a great alternative to pop-ups.
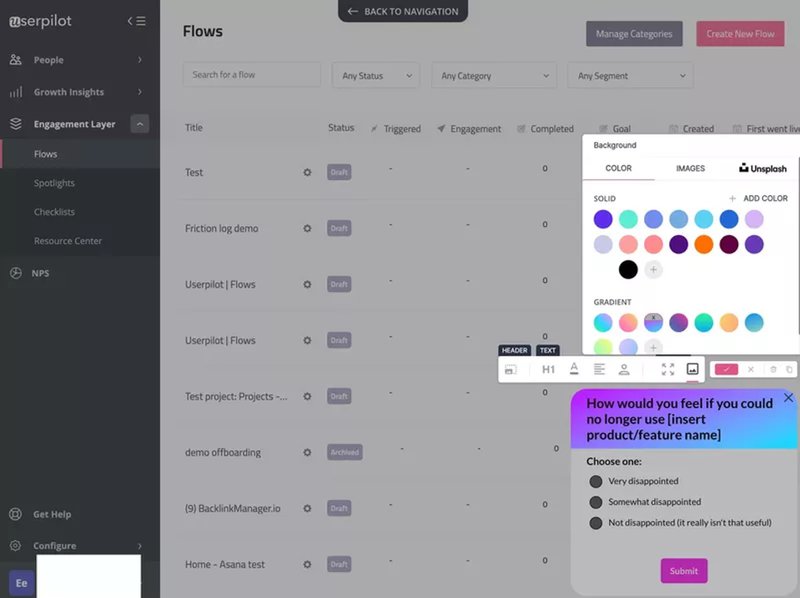
Bonus: Use PMF before NPS surveys
If you don’t have a product-market fit, then conducting an NPS survey would most likely give you a negative review. So, it’s better to understand if you have a fit with your current customers first by delivering a PMF survey.
NPS would make more sense if you understood how your products met the needs of your target customers. Here’s a simple PMF survey from Userpilot.
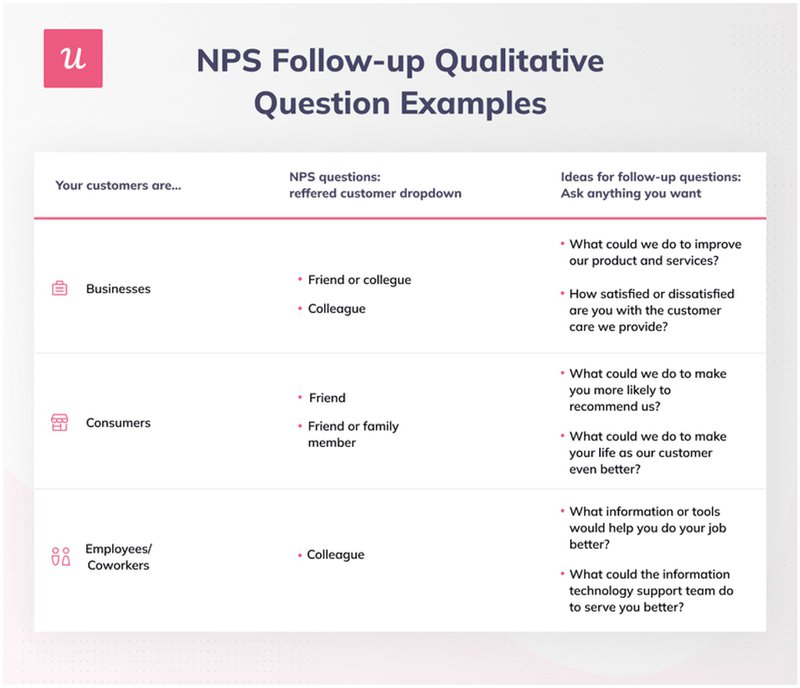
How should you ask NPS follow-up questions?
Depending on the target users, you should customize the wording of the questions differently. Avoid asking one-size-fits-all questions. This is because some questions appropriate for one audience might not resonate with another. Take a look at some examples below.
When should you send in-app NPS surveys?
Depending on the type of customer data you want to collect, you can trigger an NPS survey contextually based on user behavior.
You can send in-app surveys in the following situations:
- After users engage with a particular feature multiple times or reach a session time in-app. Your product usage data would give insight into user engagement.
- Immediately a user is done contacting support or closes a support ticket. Triggering an NPS survey helps you collect their feedback in real-time when the experience is fresh in their mind.
- After users complete the primary onboarding and move on to explore new features in your product.
- When a user is done engaging with an in-app experience and attempts to leave.
- After the user upgrades their plan from a free trial to a paid plan.
Note: Be mindful of frequency when sending an in-app survey. Triggering a survey at an unreasonable time can annoy the user. This is why you need an advanced tool like Userpilot to help you trigger surveys contextually. With Userpilot’s mobile features, you can trigger NPS surveys directly on mobile, effortlessly gathering valuable user insights on-the-go.
Build in-app NPS surveys for SaaS in 3 steps with Userpilot
Now that we’ve explored some examples of in-app NPS surveys, the next step is designing one. For this, you need the right tool for the job.
Userpilot offers a simple and effective solution for creating and analyzing NPS data to measure customer satisfaction and loyalty-all without writing a single line of code.
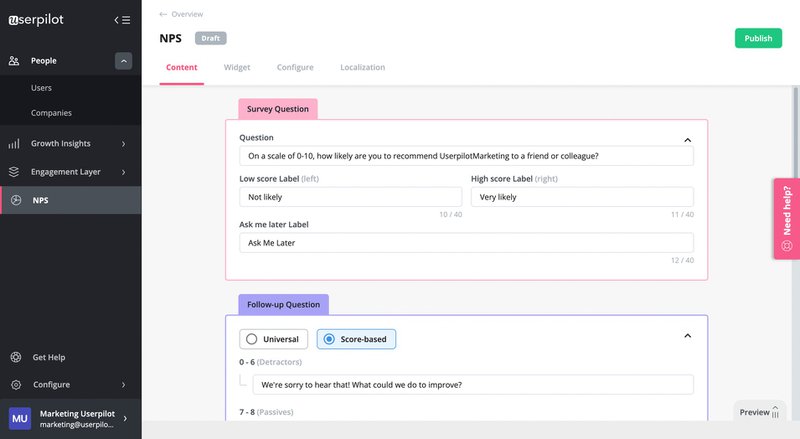
Add your NPS survey questions
The first step to designing a great is asking the right questions. In the Userpilot survey builder, add a list of questions and adjust the number scale accordingly. You can customize the follow-up question and thank you messages either universal or score-based.
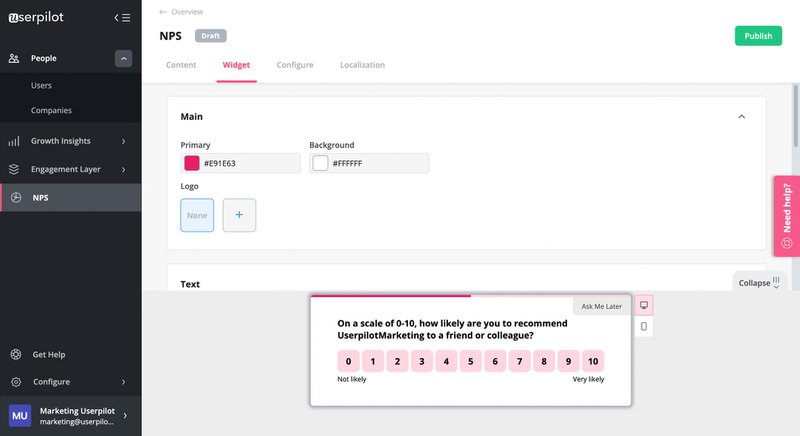
Customize the NPS survey appearance to match the native design theme
The next step is to customize your survey with your branding. Choose a color that suits your brand, add your logo, adjust the box size, and add progress bars if you wish to.
As you customize your template, preview your design to ensure it matches your expectations. Adjust design changes before moving to the next stage.
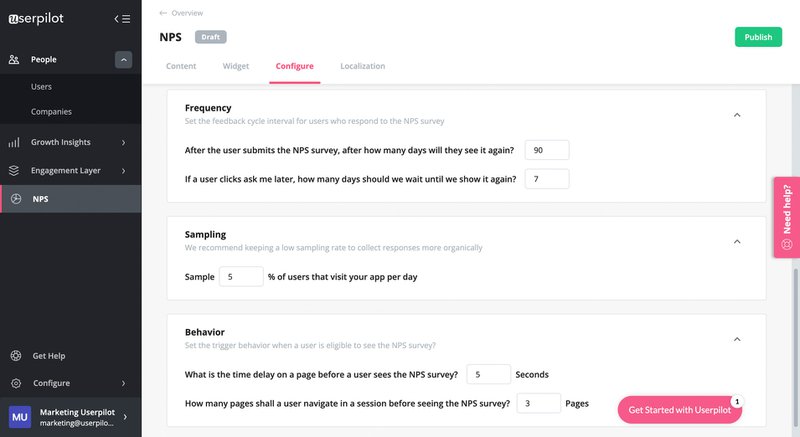
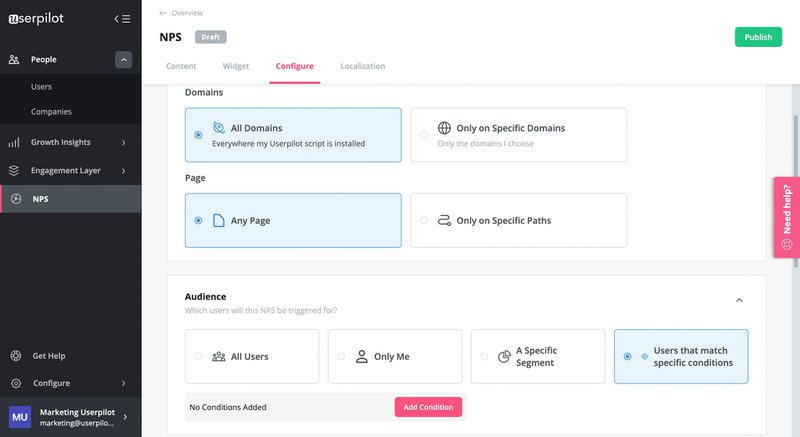
Configure target audience and set triggering conditions
With the design and questions out of the way, set the domains and pages where you want to apply NPS surveys. Choose the target audience to collect feedback based on various contributions (user segments, users with specific conditions).
You can also trigger your NPS when users complete key actions of milestones e.g onboarding.
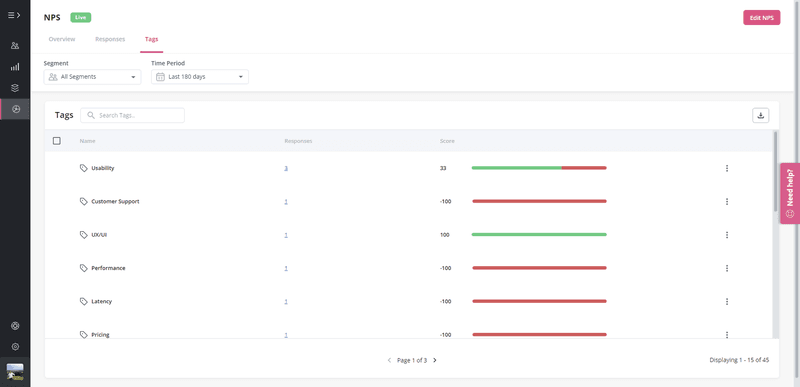
Apart from building NPS surveys, Userpilot also allows you to analyze responses and get actionable insights. You can segment users based on their NPS score and tag responses to identify improvement opportunities.
Conclusion
For SaaS companies, in-app NPS surveys are a great way to collect customer feedback and drive product adoption. Without it, companies will struggle to make accurate product decisions, measure customer loyalty, and increase customer retention.
Now that you know what in-app NPS surveys are and how to calculate NPS scores, you’re ready to tackle your next NPS survey.
To get started today, get a Userpilot Demo – and see how you can build in-app NPS surveys to collect feedback and improve customer experience.
About the author