Feedback Analysis: How To Analyze Both Qualitative and Quantitative Feedback Data


Wondering how can feedback analysis help you improve customer satisfaction?
Collecting and analyzing user sentiment is critical for any SaaS, but you need to gather both qualitative and quantitative data.
This article will explore the ins and outs of feedback analysis and how you can use tools to perform it.
Feedback Analysis Summary
- Feedback analysis involves assessing customer feedback to measure customer experience and satisfaction.
- You should include both qualitative and quantitative data in your feedback so you can analyze data effectively and make data-driven decisions.
- You should collect actionable insights by:
1. Collecting customer feedback with different types of in-app surveys.
2. Measuring customer satisfaction, experience, and loyalty.
3. Using passive feedback collection methods.
4. Gathering data about public reviews and online mentions. - Categorizing customer feedback is a crucial step in the feedback analysis process, where you group feedback data into different categories based on the type of feedback.
- Manual feedback analysis can be time-consuming, so AI can be a better alternative to get more accurate and faster results.
- Implement NPS response tagging, and trend identification with artificial intelligence (AI), and natural language programming (NLP) to simplify the analysis process.
- Brand 24 is a promising tool for tracking and analyzing online brand mentions.
- MonkeyLearn can be used for visualizing customer feedback with Artificial Intelligence.
- Userpilot is the recommended tool for creating in-app surveys, triggering them to the right segments, and analyzing both quantitative and qualitative feedback responses. Book a demo to see it in action.
What is feedback analysis?
Feedback analysis refers to examining customer feedback to gain insights into their experiences with your product. You can use it to enhance your customer experience and customer satisfaction.
Insightful data vs non-insightful data
Using all the data from your customer feedback collection may be overwhelming. While some information is valuable, others give you useful insights. This is where the concept of insightful and non-insightful data becomes important.
You should split the customer data from the feedback into these two categories:
- Insightful data.
- Non-insightful data.
Insightful data is the feedback that reveals new information from your customers that your business was previously unaware of. It bridges the gap between what you believe to be working and what your customers are experiencing.
It can give you insights that will help you:
- Find the opportunity to make necessary changes to your strategy.
- Identify areas where you need to maintain what’s working and where you need to improve.
- Make critical changes that will have a real impact on your business.
For example, if customers complain about a bug in your app, this is insightful data. It tells you to address the issue and take the necessary steps to fix it.
On the other hand, non-insightful data is feedback that doesn’t give any new information and merely confirms what you already know. While paying attention to all feedback can be tempting, focusing on non-insightful data might waste time and resources.
Suppose you receive negative feedback about a feature your team has already addressed. It is non-insightful data, which you can ignore because you’re already aware of the issue and are possibly taking steps to fix it.
Customer feedback analysis process
How do you implement an effective customer feedback analysis process? Let’s look at the proven ways to do that.
Collect quantitative and qualitative actionable insights
You should include quantitative and qualitative data while collecting insights from customer feedback.
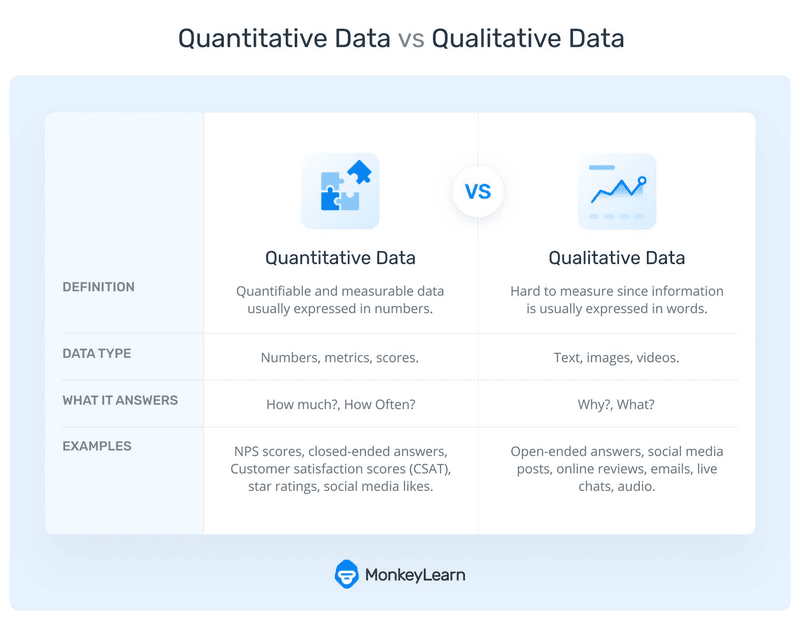
Quantitative data analysis involves analyzing numerical data to identify patterns and trends. This method of research deals with numbers and statistics to systematically measure variables and hypotheses. You can get objective and measurable results and compare them across customer segments or time frames.
However, depending solely on quantitative data can leave out important details you can collect through qualitative data analysis.
Qualitative data analysis refers to analyzing non-numerical, textual data to derive actionable insights about your customers’ perceptions of your product. Concluding qualitative data is harder because it is less structured than quantitative data.
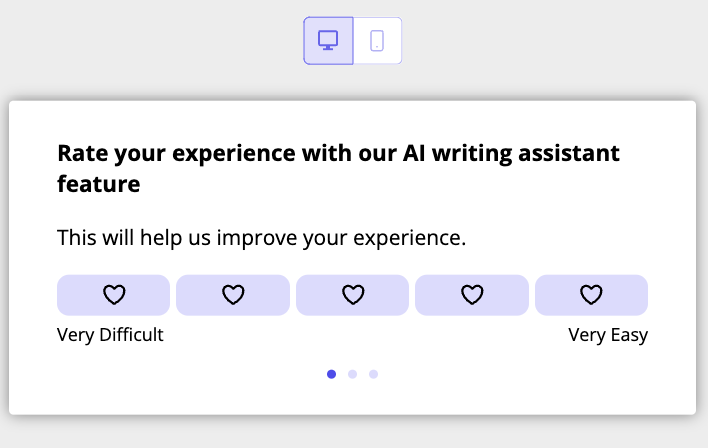
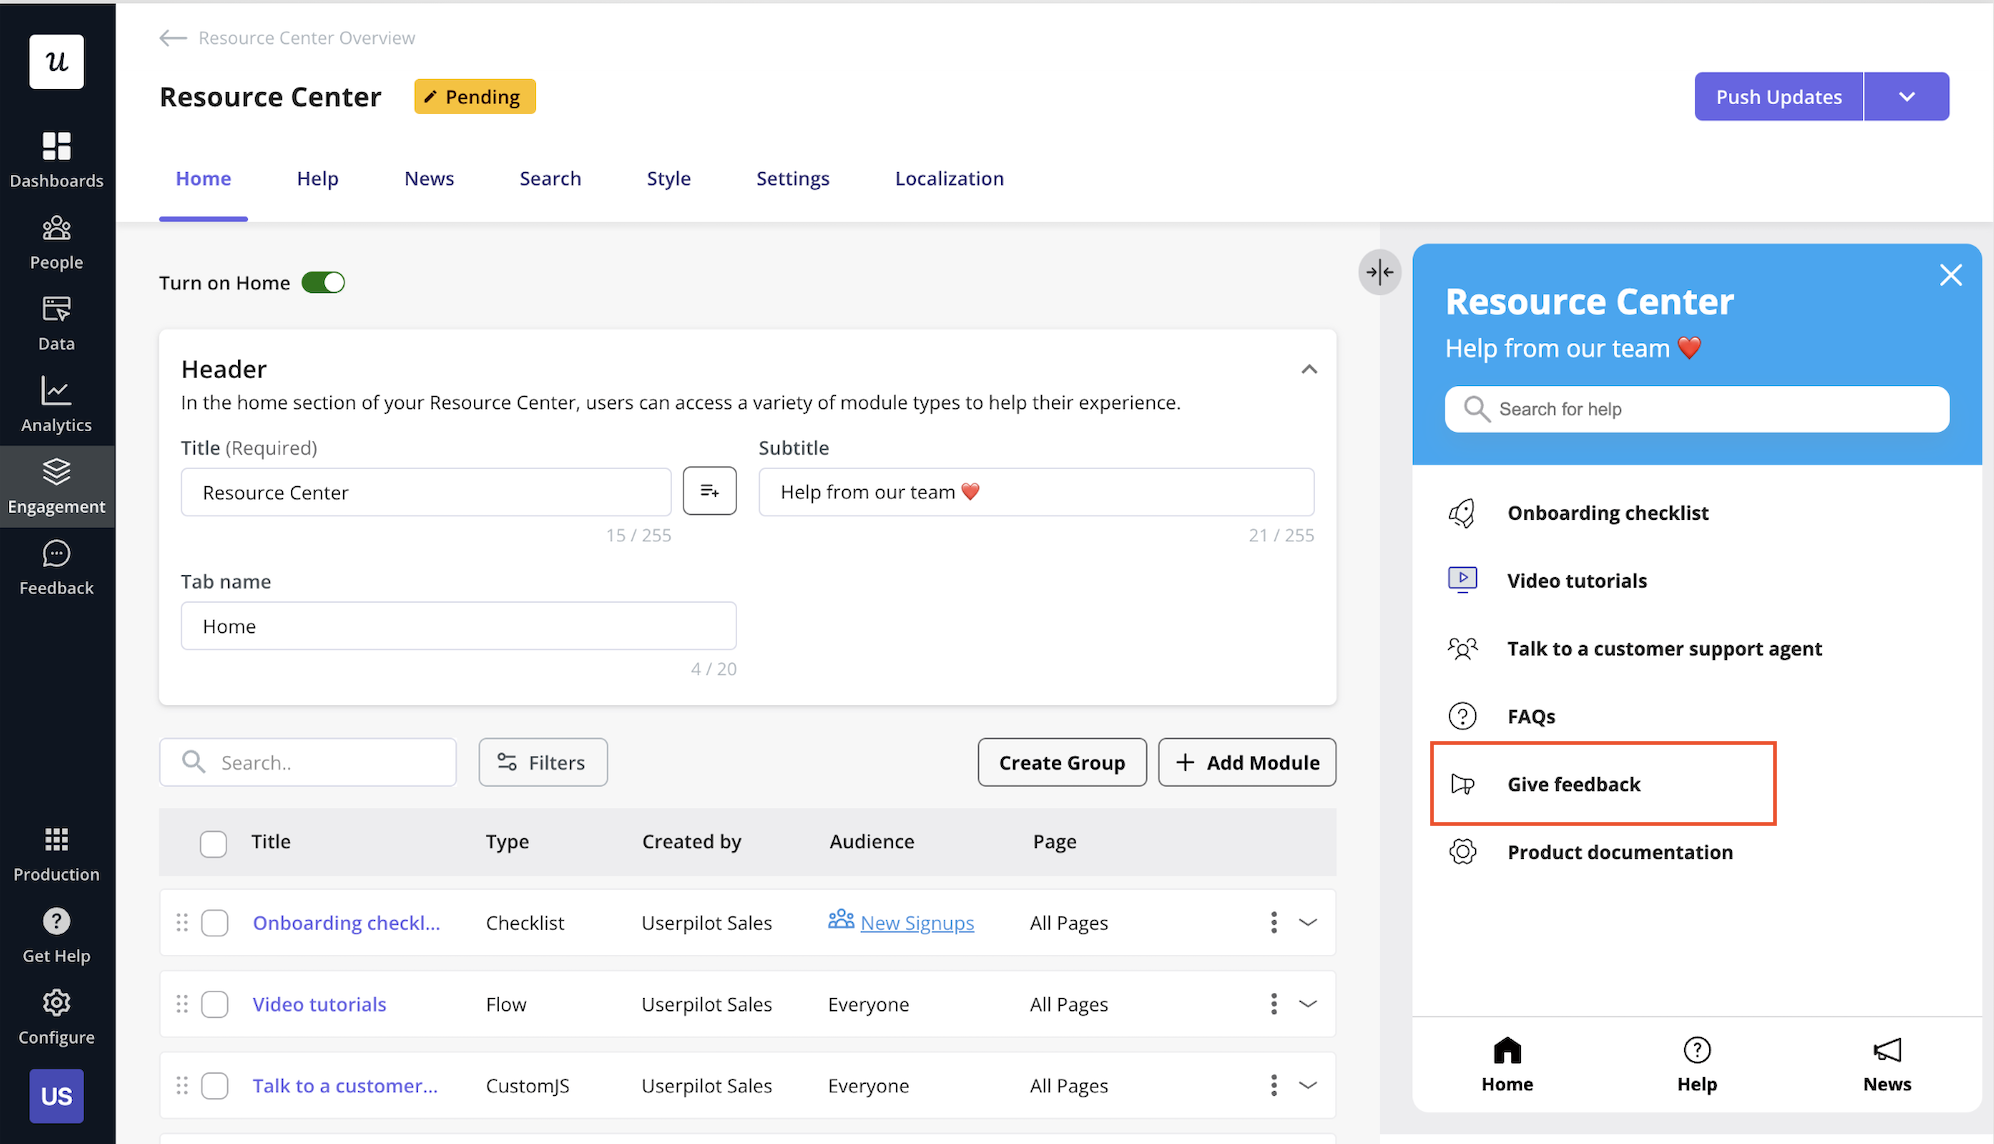
Collect customer feedback with in-app surveys
In-app surveys allow customers to conveniently provide feedback without leaving the app. The other benefit of in-app surveys is that you can gather customer feedback by triggering relevant micro surveys based on specific behaviors.
You should consider using the following types of in-app customer surveys to understand their thoughts about specific parts of your product:
- Feature request surveys: Help you learn what new features customers want in your app.
- Feature feedback surveys: Help you understand how customers use the features already in the app and what needs improvement.
- Product feedback surveys: Provide insights into what your customers think about your product as a whole.
Measure customer satisfaction, experience, and loyalty
To get a better idea of whether your product meets customers’ requirements, you need to measure customer satisfaction regularly with CSAT and CES surveys. They can help you identify points where customers may struggle or experience issues.
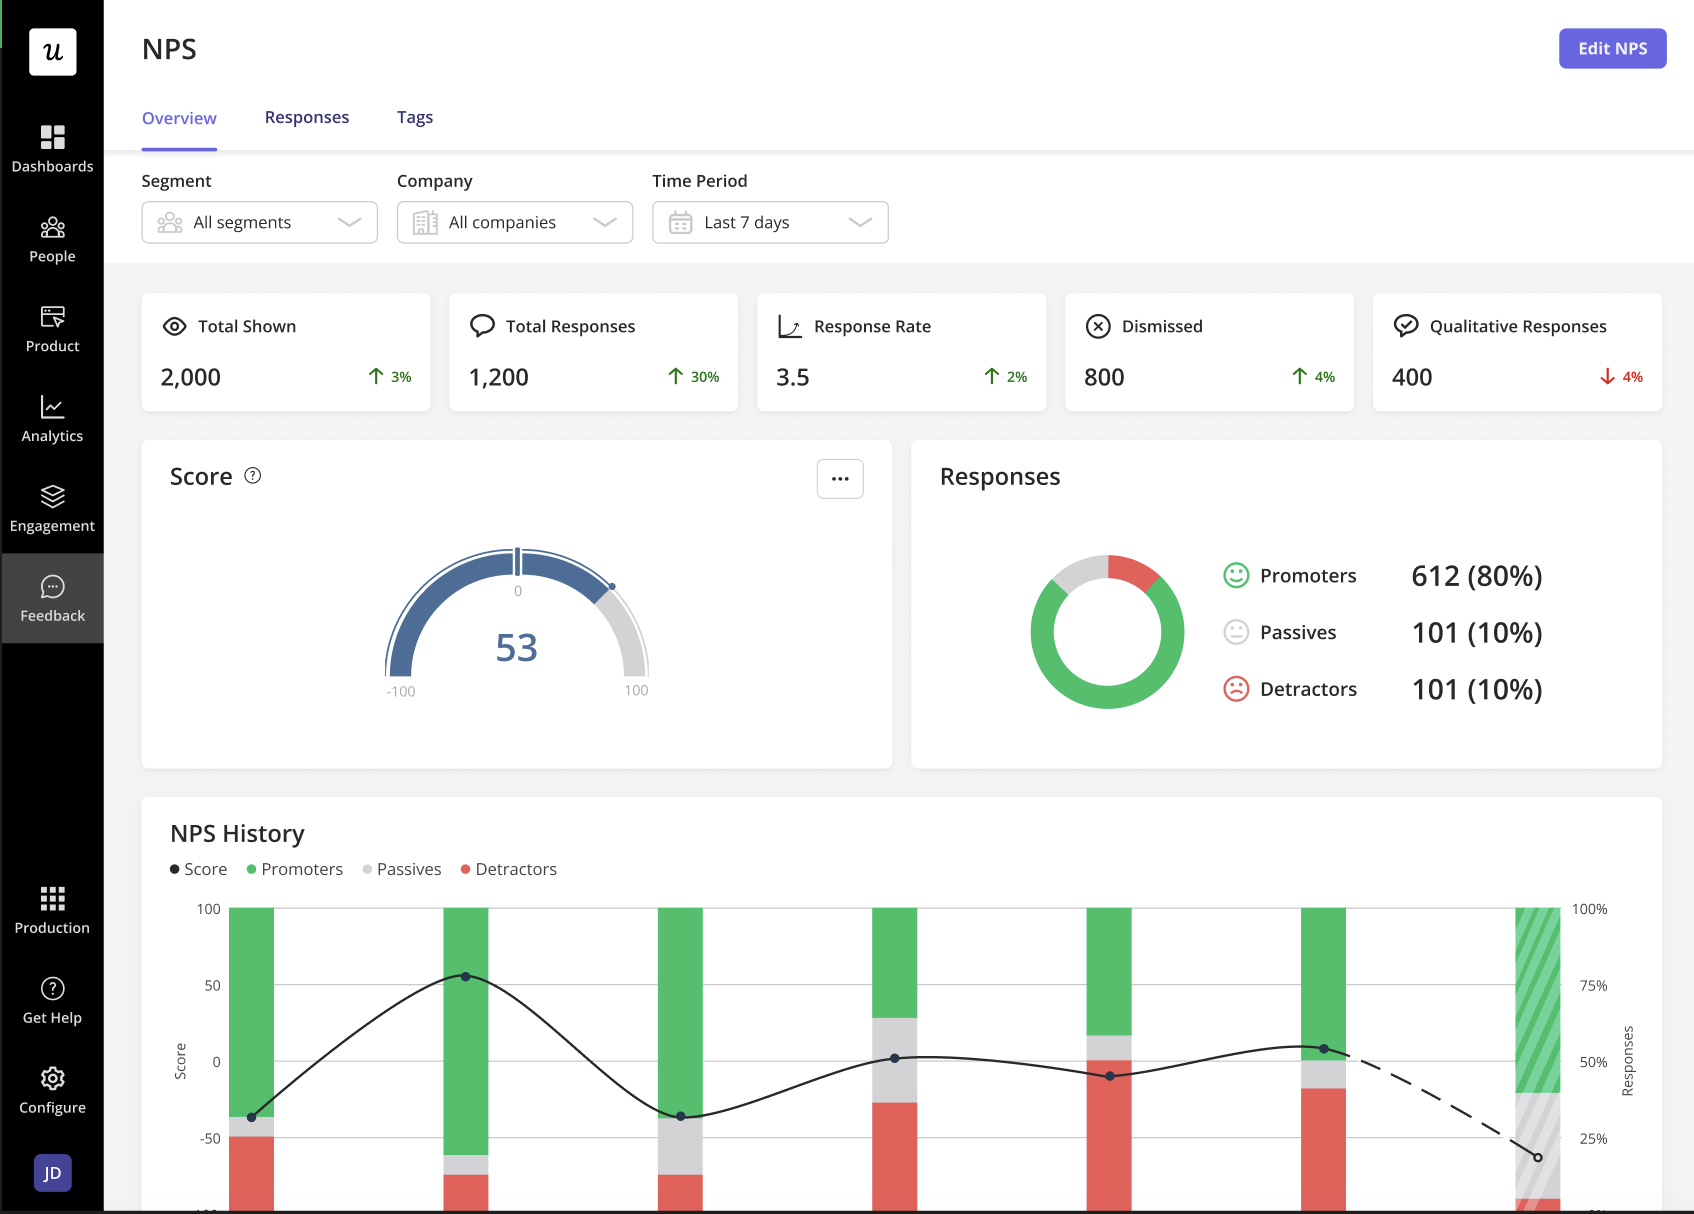
You should measure customer loyalty to determine how likely your customers will continue doing business with you. Customer loyalty shows whether your customers are ready to recommend your product to others or are searching for better alternatives and helps you understand their commitment to your product. You can do it easily with Net Promoter Score (NPS) surveys.
Use passive feedback collection methods
Passive feedback refers to your customers’ feedback through channels like on-demand surveys without you prompting them.
They are useful because they don’t require customers to participate in surveys actively. Instead, the customers can offer feedback based on their natural interactions with your product.
Some passive approaches you should know about for collecting customer feedback are:
- Always-on feedback widgets: It lets customers share their thoughts when they are most engaged with your product.
- Social media comments: You can gain insight into customer needs and pain points by collecting data about customers’ shared opinions and experiences.
- Product reviews: They can provide valuable feedback on the quality and usability of your product.
- Forums: You can learn about customers’ needs and preferences from the experiences and feedback they share in their own words.
- Online brand mentions: Monitoring online mentions helps you gain real-time feedback on your product, identify customer pain points, and respond proactively to them.
Gather public reviews and mention data
Public reviews and mentions data can provide valuable insights into how customers perceive your product and company.
However, negative reviews can harm your product and reputation. So monitoring reviews on external sites and following up on them is crucial.
You can use tools like ParseHub and Dexi to gather and analyze your product and company’s online review data. These tools scrape the web to help you collect online review data from various sources, like review sites, forums, etc., and analyze it.
Categorize data
Collecting feedback is only half the feedback analysis process. The next step is categorizing the feedback data. This involves grouping data into different categories based on the type of feedback. The categories can include:
- Product-related feedback.
- Service-related feedback.
- Bugs-related feedback, etc.
After identifying the primary categories, you might need to sub-categorize them further to obtain more specific insights. For example, you can sub-categorize product-related feedback into features, usability, etc.
Feedback data categorization can help you clearly understand your product’s overall performance. It also makes detecting patterns or trends within specific feedback categories easier.
Analyze feedback data
Once you’ve collected and categorized customer feedback, you should focus on analyzing it to gain valuable insights. You should consider a few different customer feedback analysis methods in this process.
The first option is manual analysis, where you analyze customer feedback manually and categorize it based on its type. It is time-consuming and requires much effort, as you will need to combine data from different sources.
The next option is using automated tools. Various easy-to-use third-party software can help you further automate the process and analyze feedback faster and more efficiently.
Finally, you can use AI-powered analysis to gain more accurate and faster results than analyzing feedback manually. AI can sort through thousands of data points and provide clear analysis, helping you take meaningful action based on the feedback analysis. It can also provide real-time insights to help you respond to customer feedback quickly and effectively.
Analyzing customer feedback using tools
Analyzing customer feedback can be overwhelming due to the volume of data. So using tools can be an excellent approach to making the process more efficient.
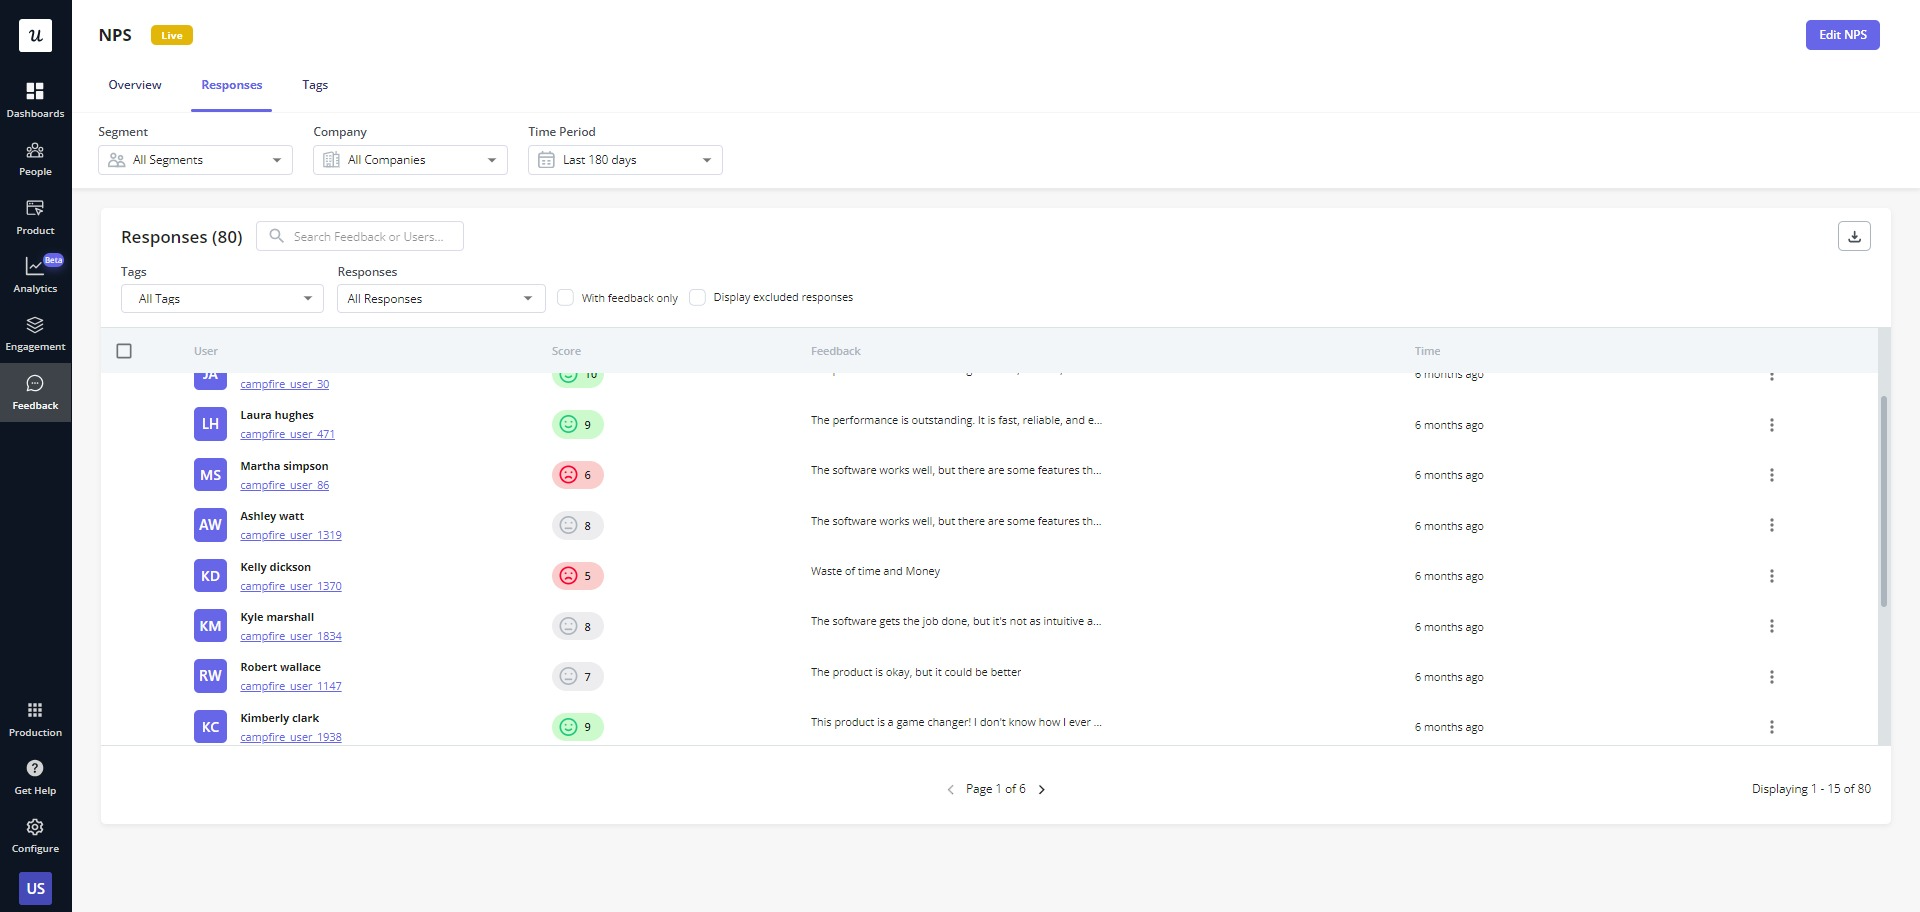
Analyze NPS responses using tags
You can create and apply tags to individual NPS responses to help filter and analyze the received customer feedback. You can use tags to split responses into different categories and quickly identify recurring patterns.
One of the main benefits of tagging NPS responses is that you can identify issues that directly correlate with a low NPS score. If many customers are complaining about the same thing, it’s an indication that there is a problem that needs to be fixed as soon as possible otherwise customer churn is inevitable.
On the other hand, response tagging can also help you figure out what satisfies customers.
Identify feedback trends using AI
AI-powered customer feedback analysis tools can categorize feedback automatically by adding tags after you feed it with data. It’s similar to what you would do manually for NPS response tagging but with improved accuracy and efficiency because of advanced algorithms.
After data categorization, machine learning can help you predict changes and future behavior based on historical data. This predictive customer analysis will allow you to provide the best customer experience and stay ahead of the competition.
Analyze mentions using an NLP tool
Natural language processing (NLP) is one of the most effective tools for analyzing customer feedback. It is a branch of artificial intelligence focusing on the interaction between computers and human languages.
NPL tools enable computers to understand and interpret the structure and meaning of human language. While doing so, they analyze various aspects of human language, like syntax, semantics, pragmatics, and morphology.
You can use NLP to measure the volume of brand mentions across different online platforms and set periods. Then, you can analyze the share of your brand mentions across platforms and compare it with others’ performances. It provides insight into your product’s popularity and monitors customer sentiment.
Moreover, NLP tools can do sentiment analysis to identify the emotional tone of a piece of text. It can help you understand how your customers feel about your products.
3 best tools to automate customer feedback analysis and act on the data
Searching for the optimal customer feedback tool can be challenging. So let’s walk you through the 3 best tools to automate customer feedback analysis.
Userpilot – for creating fully customizable in-app surveys and analyzing them
Userpilot is a powerful code-free feedback analysis tool with many features to help you collect and analyze customer feedback data. It can help build customizable in-app surveys, segment feedback, and perform advanced feedback analytics.
Here is a summary of what Userpilot offers:
- Enables you to build different types of microsurveys, including NPS, CSAT, CES, etc. You can customize these survey templates based on your specific needs while having full control over the surveys’ frequency and timing or create ones from scratch.
- Its advanced features, like behavioral targeting and customer segmentation, allow you to show surveys to selected customers at specific times. It ensures you get feedback from the right customers at the right time. You can use this data to take action to increase customer retention by eliminating the weaknesses.
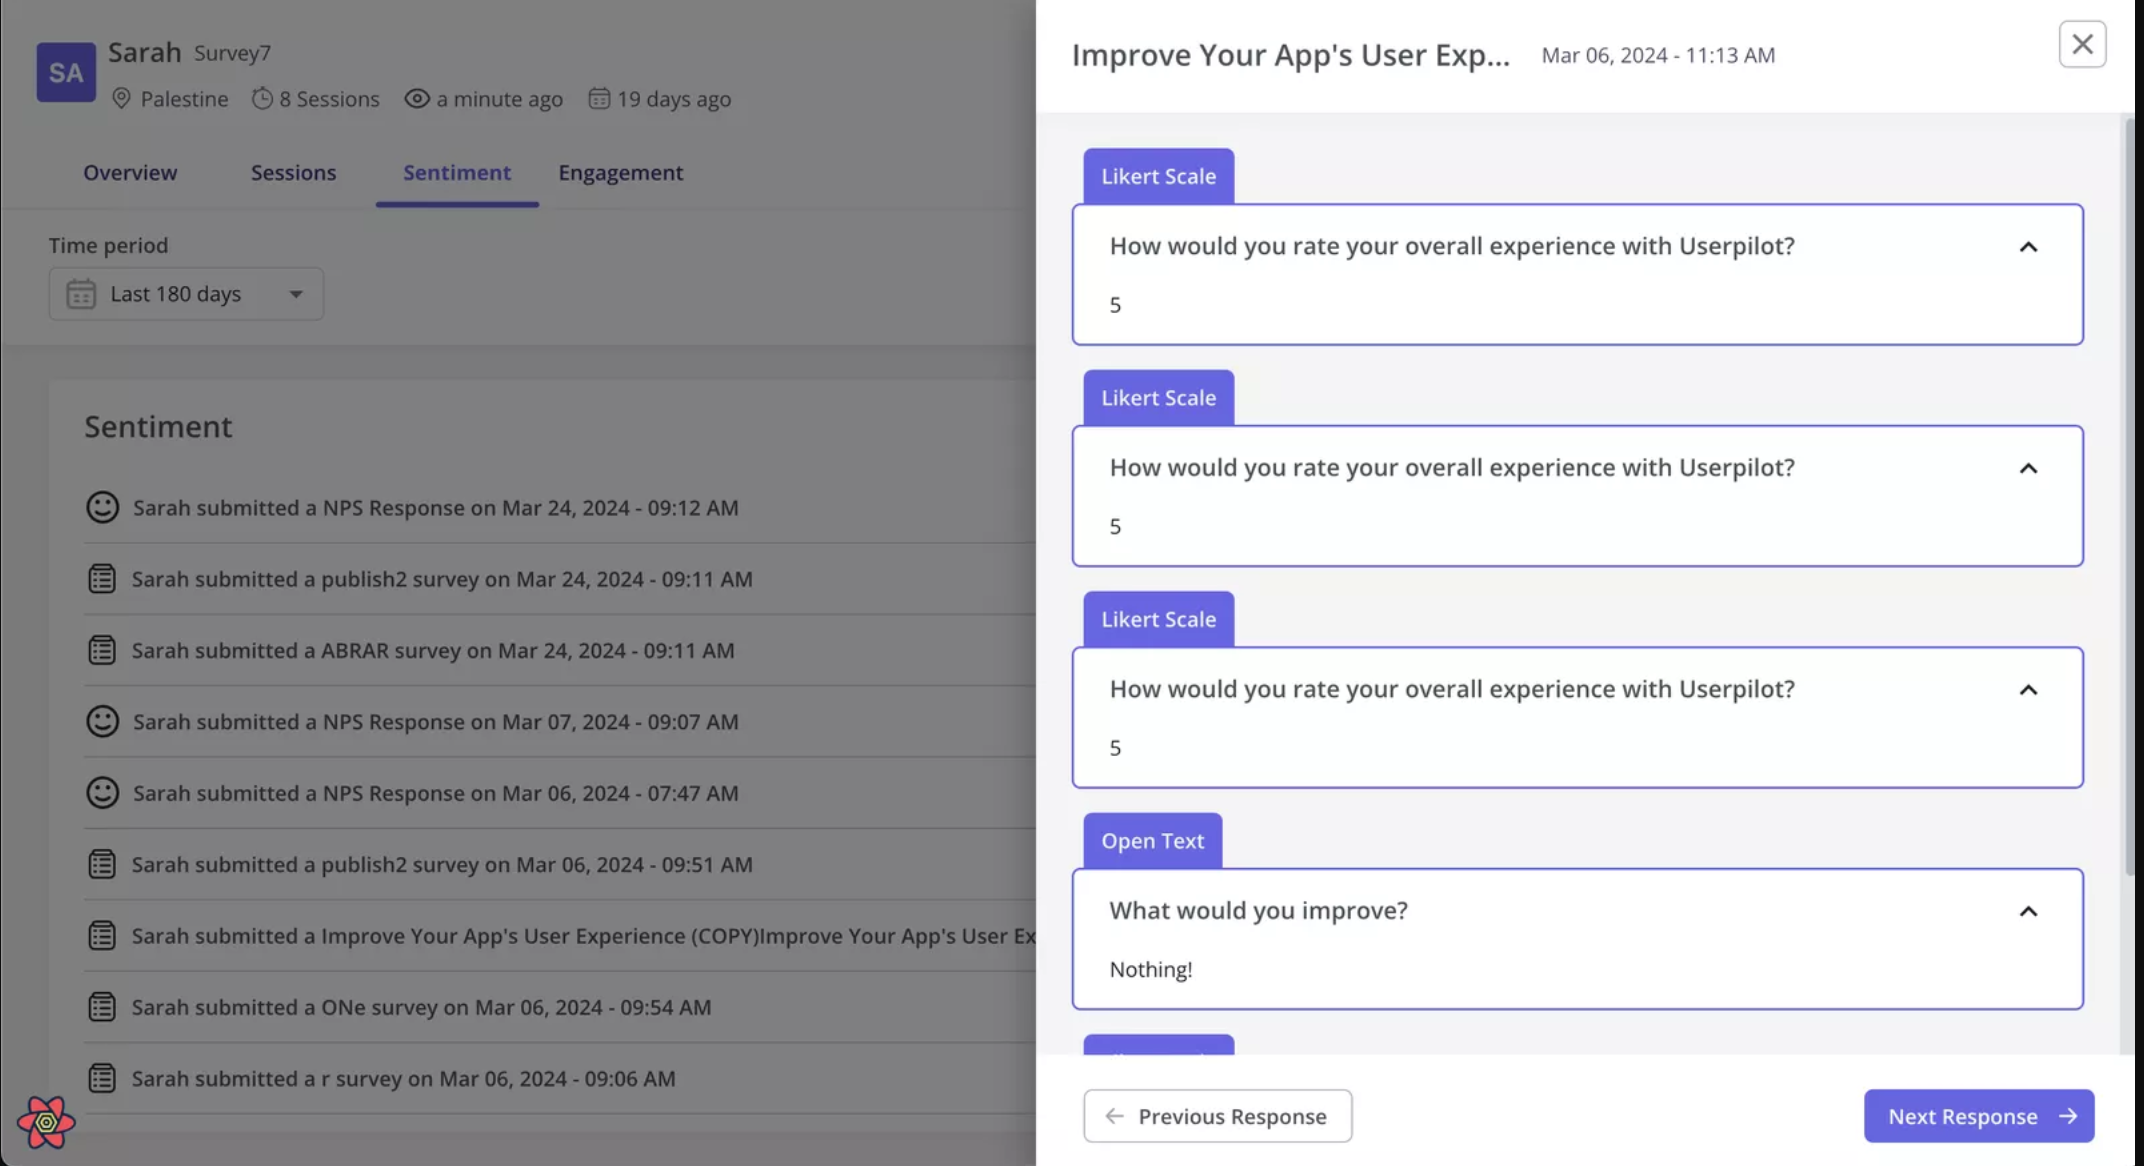
- Provides advanced survey analytics to help you interpret and act on customer feedback. You can tag NPS responses to organize them into different themes. It also lets you note feature requests from the follow-up questions of in-app surveys.
- Userpilot’s individual sentiment dashboards allow you to get granular with user or company data and observe how their feelings about your business change over time. With Userpilot’s user and company profile feature, you can track each user’s feedback across all your in-app surveys. This kind of sentiment analysis is especially useful for high-profile customers. When you notice a usually positive power user suddenly starts showing negative sentiment, you can quickly reach out, address their problems, and prevent potential churn.
Userpilot offers 3 pricing tiers: Starter, Growth, and Enterprise. The plans start at $299 per month, billed annually. You can also book a free demo to see Userpilot in action.
Brand24 – for analyzing mentions
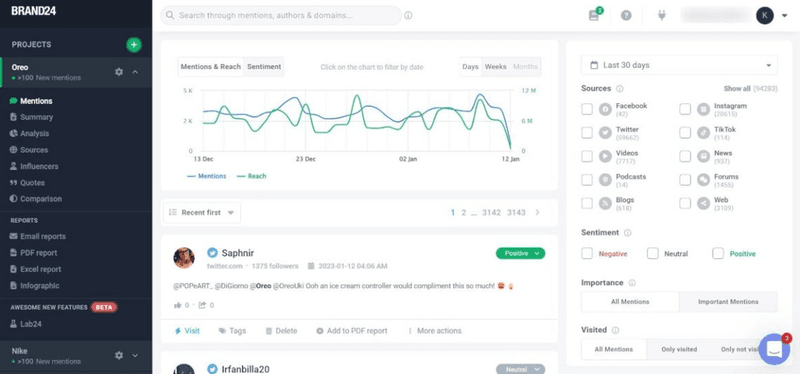
Brand24 is a reputation management tool that helps track and analyze your online mentions.
You can monitor online mentions across various social media platforms, news and review sites, blogs, forums, and podcasts. Moreover, Brand24’s functionality extends to online reviews posted on App Store, Google Play, Trustpilot, etc.
It also has a Reputation Score metric that lets you measure your product’s reputation on online platforms. You can then comprehensively assess your product’s online reputation and make actionable strategies.
Brand24 offers a free trial for 14 days with 4 premium plans: Individual, Team, Pro, and Enterprise. The pricing ranges from $79 to $399 per month for an annual plan.
MonkeyLearn – for visualizing customer feedback with AI
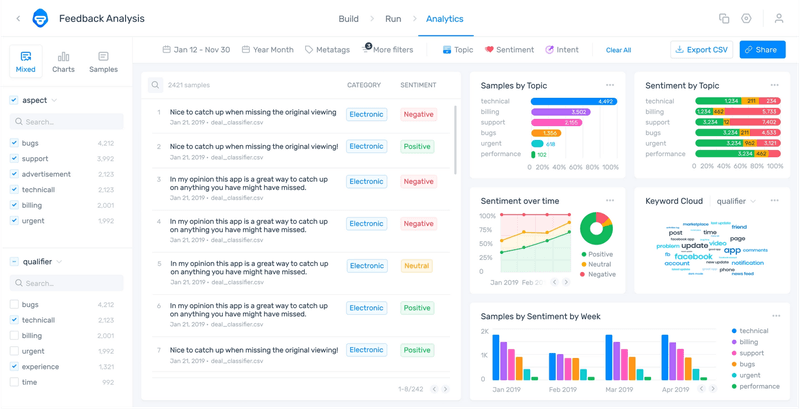
MonkeyLearn is a powerful text analysis tool that lets you easily clean, label, and visualize customer feedback data without coding expertise. This feedback analysis tool utilizes advanced AI to provide valuable insights and analytics through an easy-to-use platform.
One of MonkeyLearn’s standout features is its ability to provide instant data visualizations and detailed insights. You can also dig deeper into your data, create charts and visualizations, and filter by dates and custom fields.
MonkeyLearn offers an impressive collection of pre-built machine-learning models, including classifiers and extractors. It also allows you to build and train custom models, like sentiment analysis and topic classifiers.
MonkeyLearn offers a 14-day free trial, with pricing starting at $299 per month for the Team plan.
Conclusion
Feedback analysis gives you the data to make informed decisions about improving your product. Using it properly can lead to a goldmine of opportunities to increase customer retention and drive growth.
Want to perform feedback analysis and increase customer satisfaction code-free? Book a demo call with our team and get started!
About the author