Feature Adoption Metrics: How to Diagnose Why a Feature Isn’t Getting Used


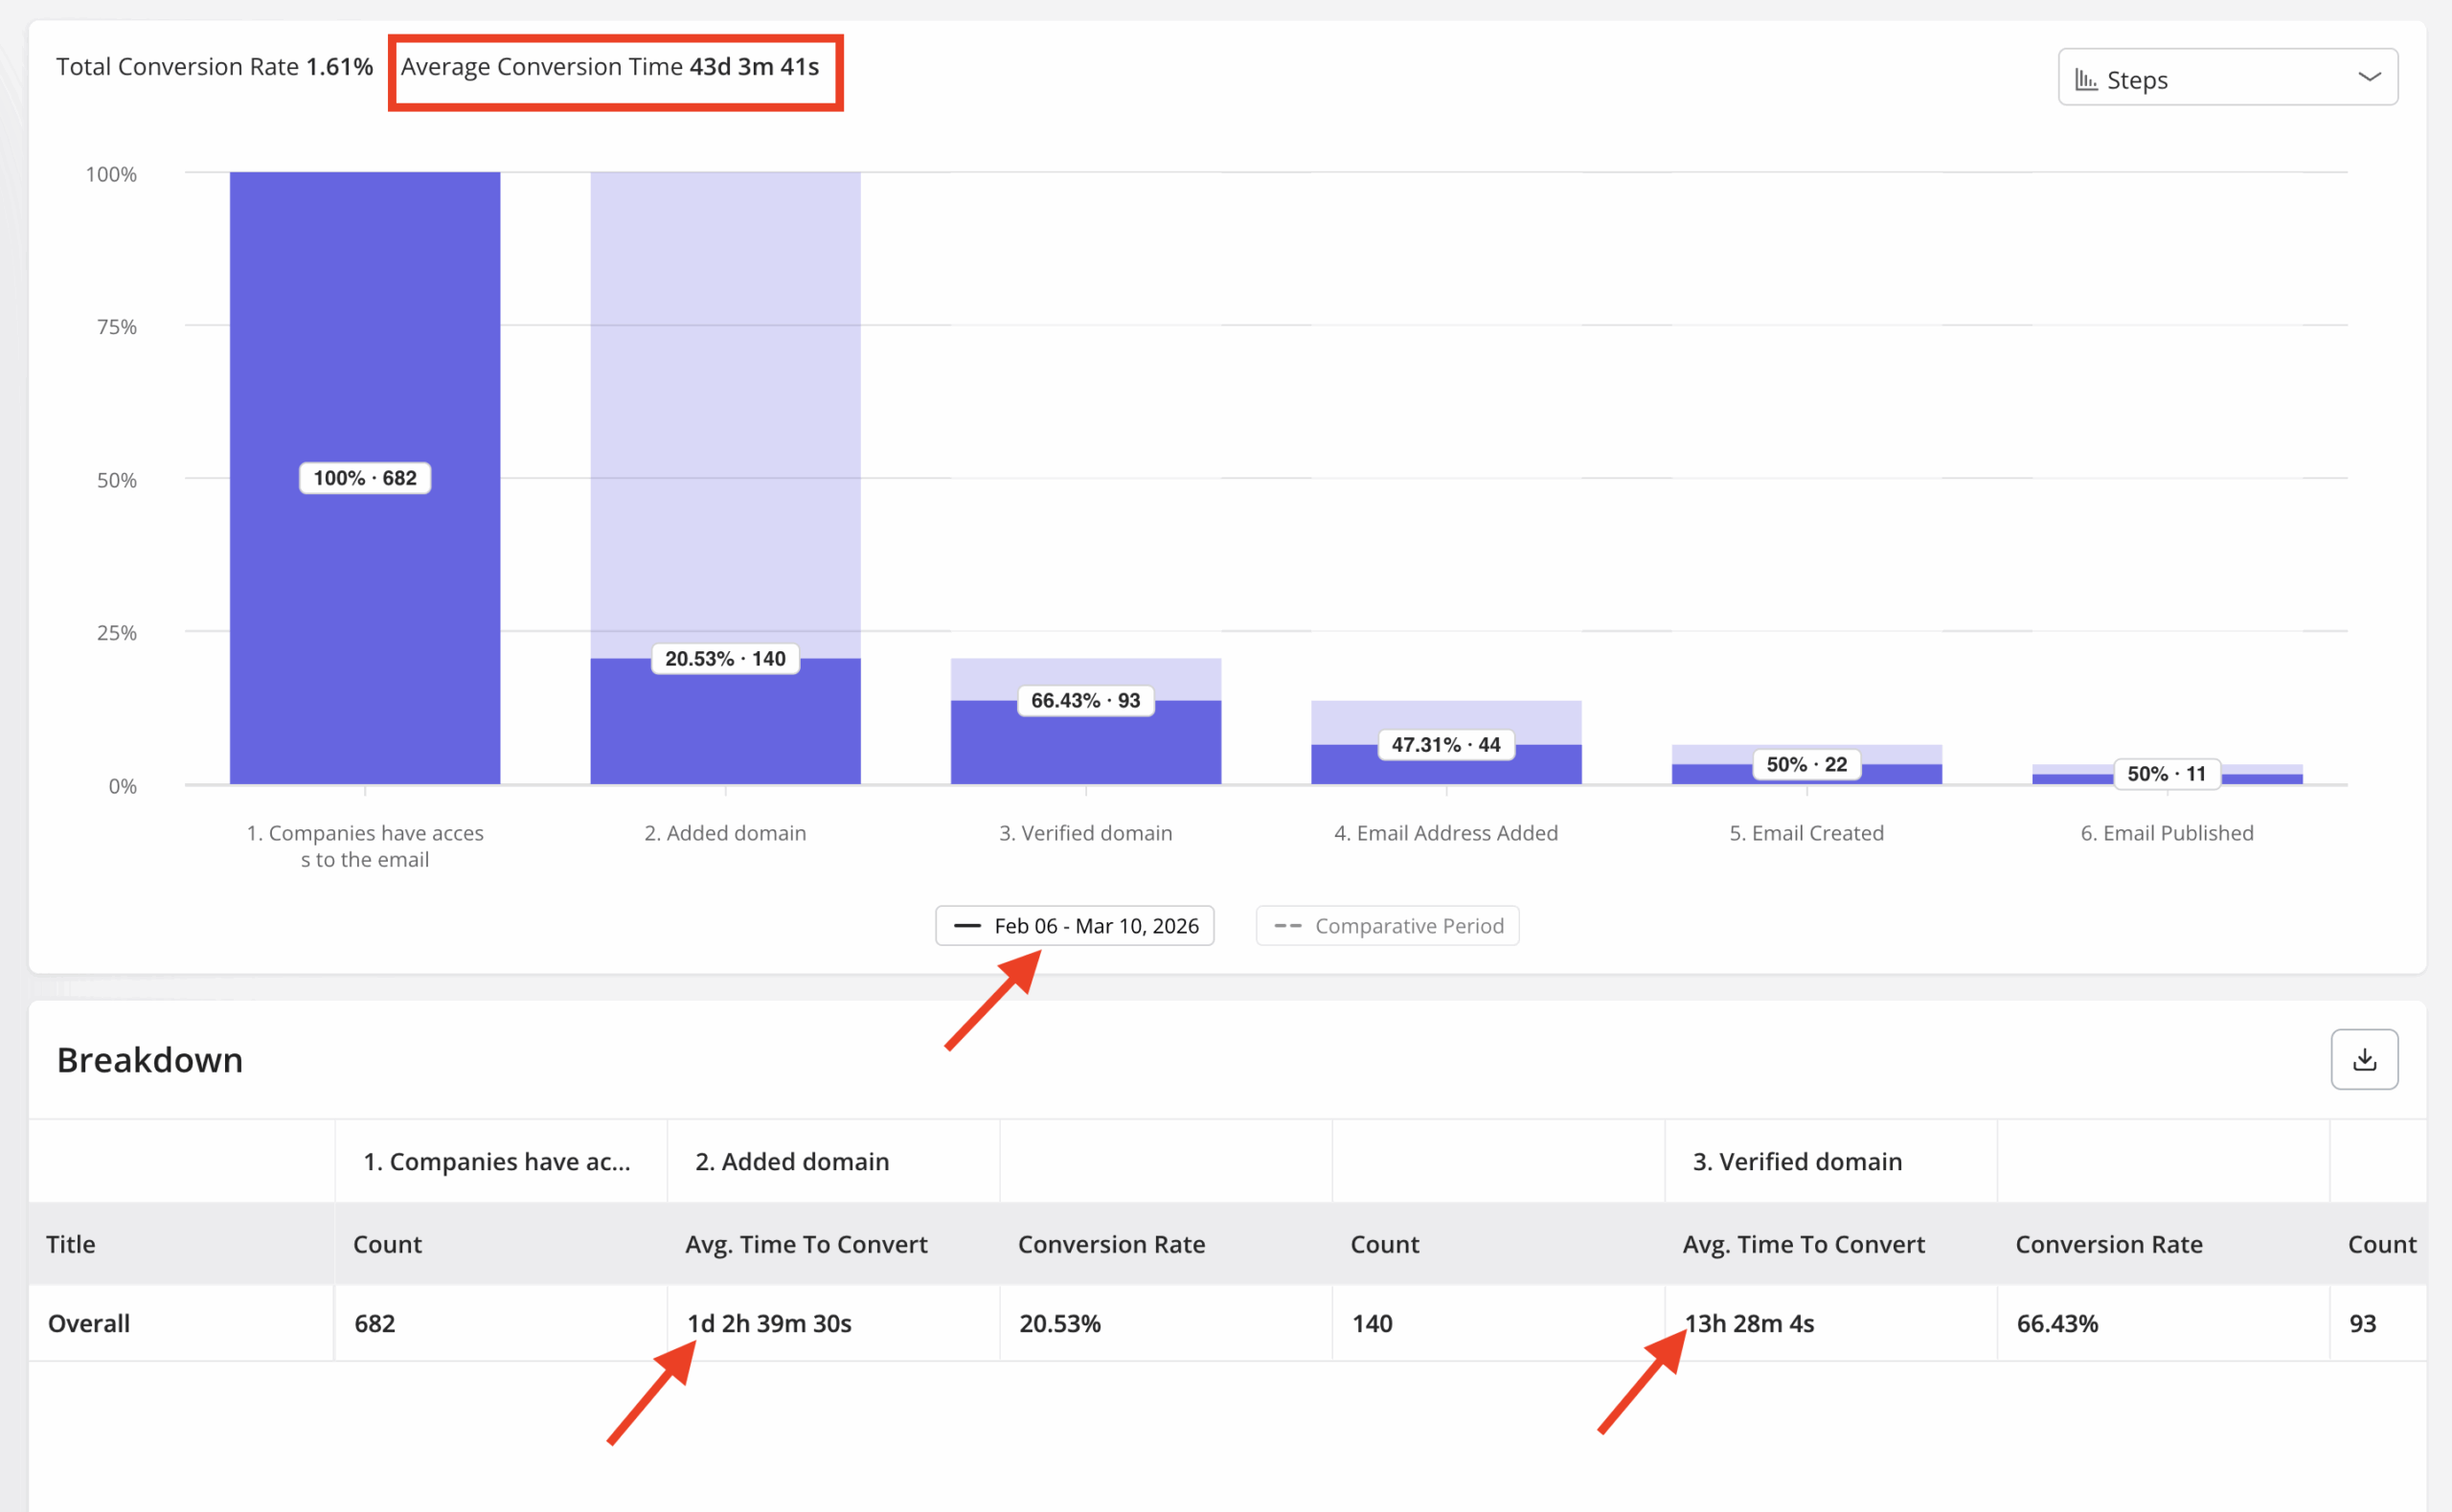
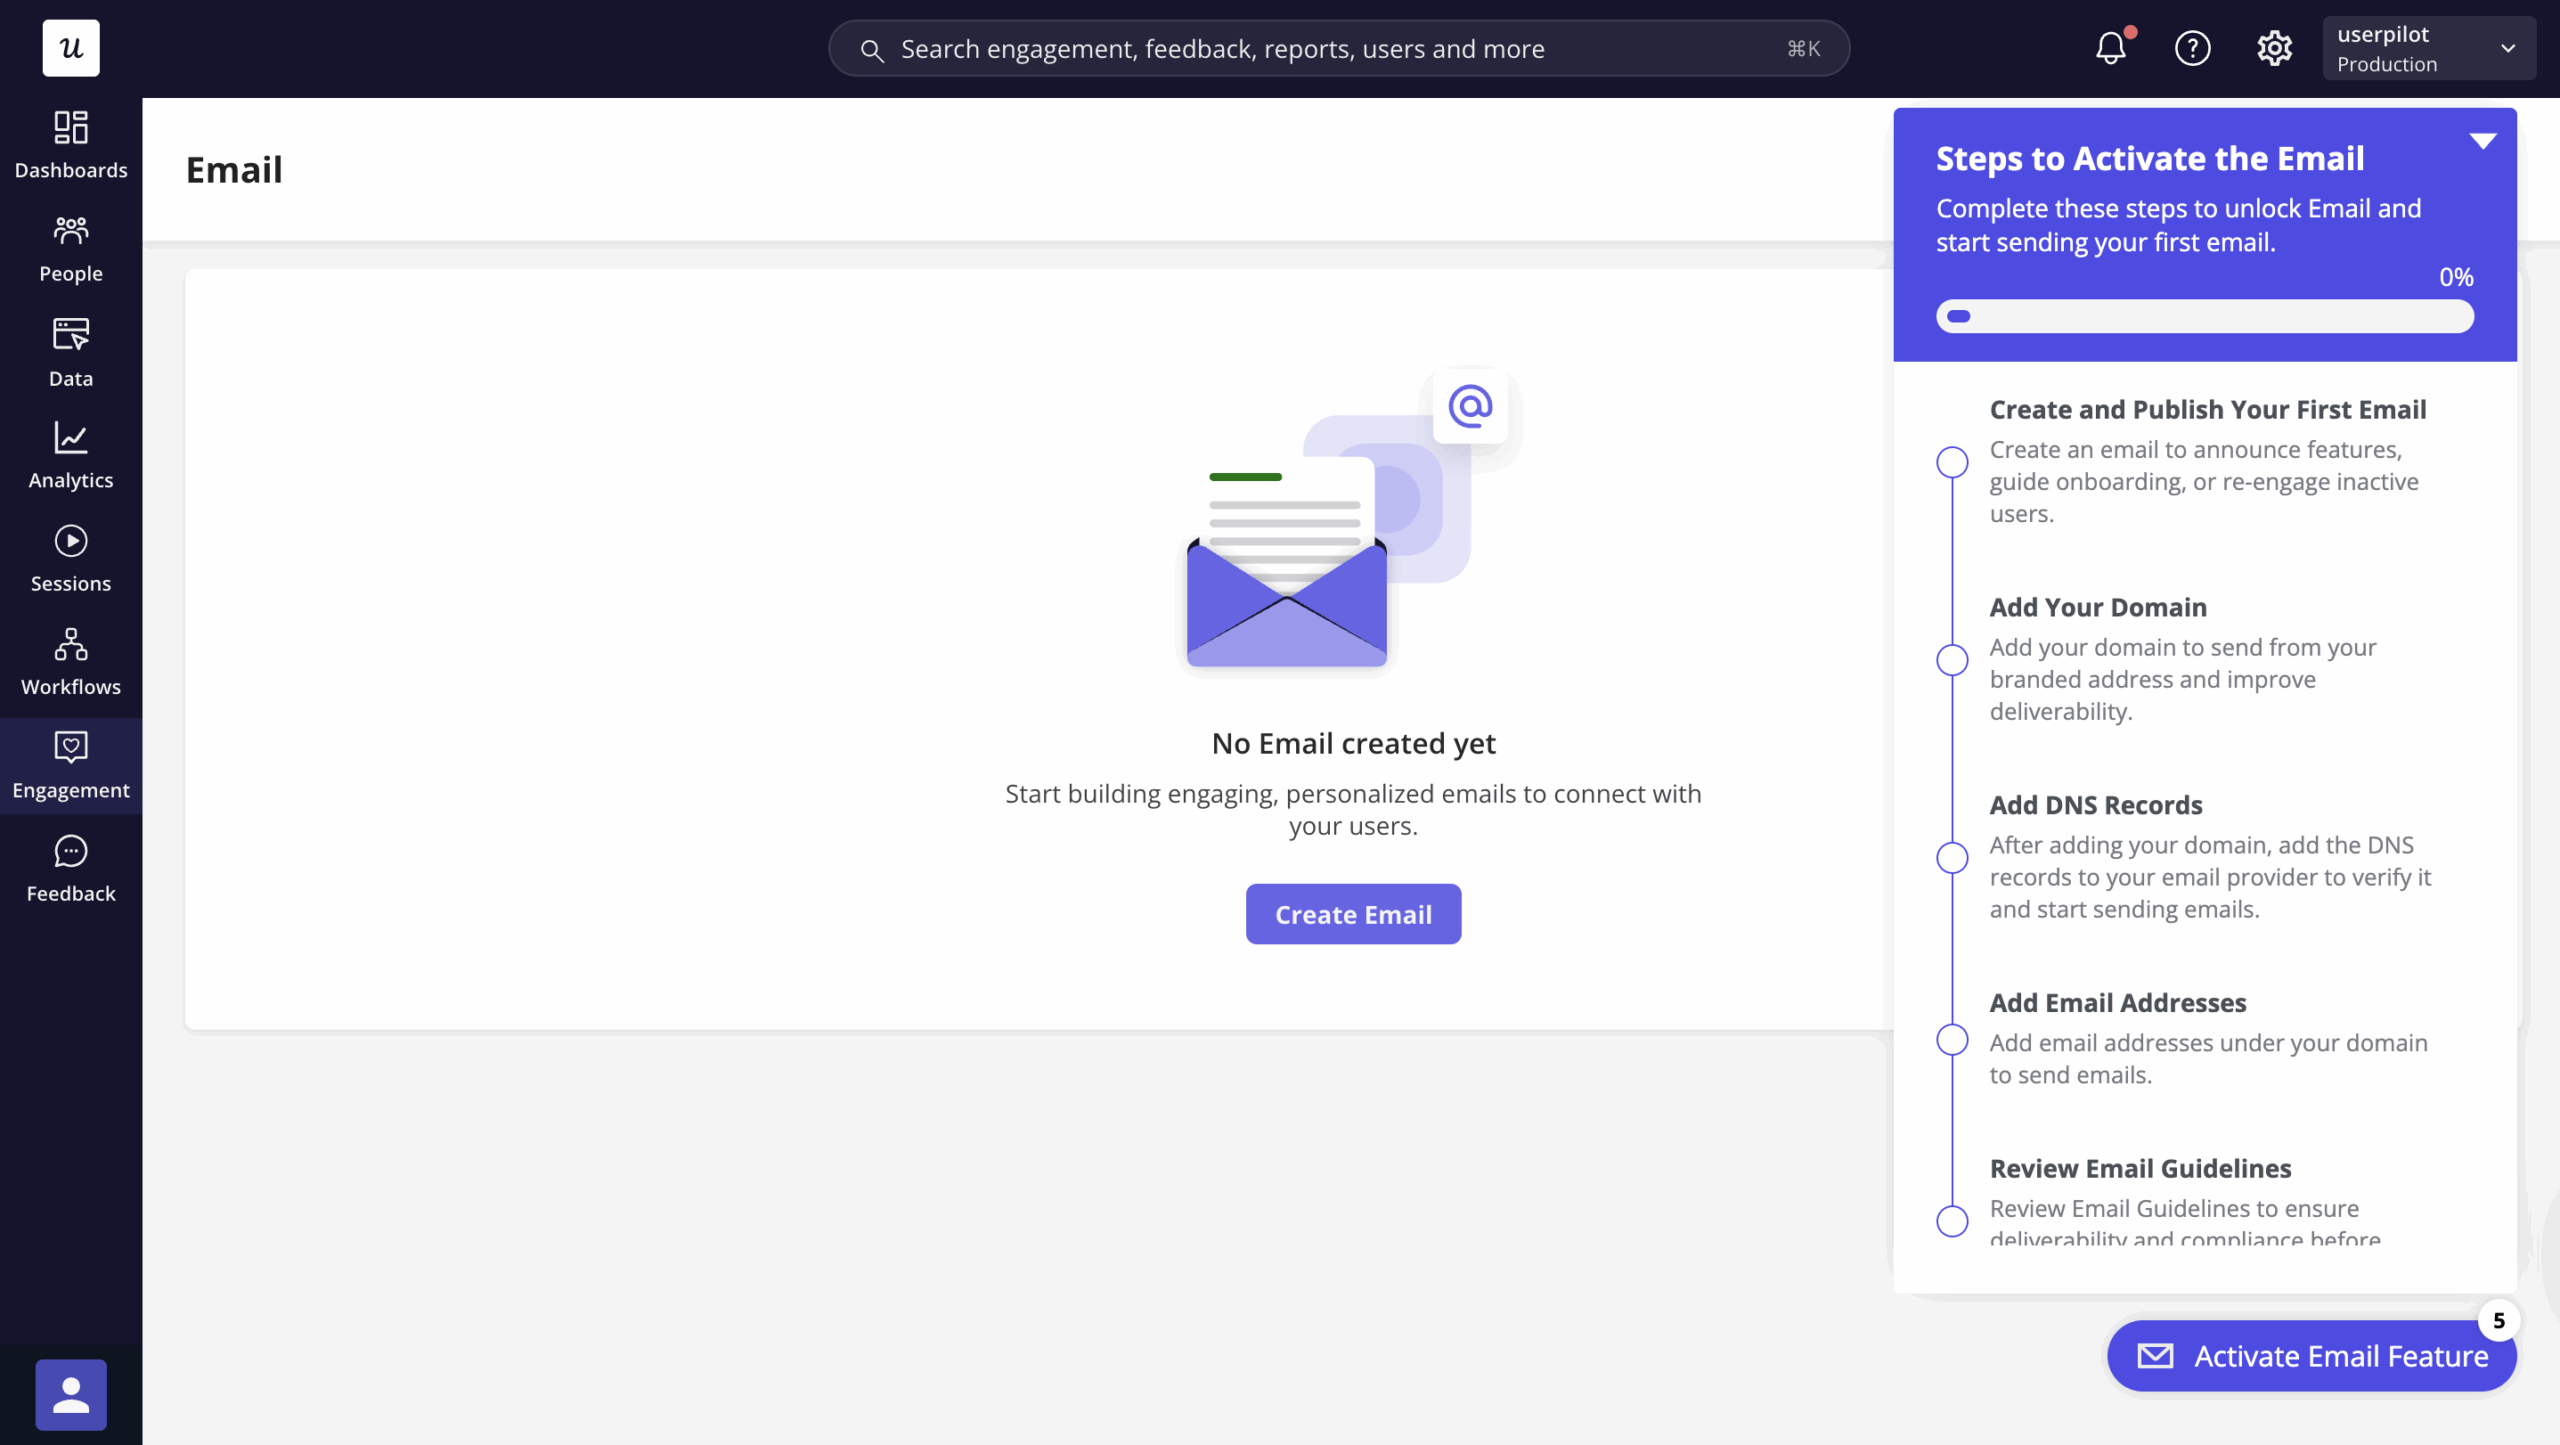
I’m Abrar Abutouq, a product manager at Userpilot, and feature adoption metrics told me exactly what was wrong with one of our most important launches before any user complained. When we shipped Userpilot’s email feature, the funnel showed a huge drop-off across the first two setup steps: users could access the feature but weren’t activating their domain, the step you have to complete before any of the email functionality unlocks.
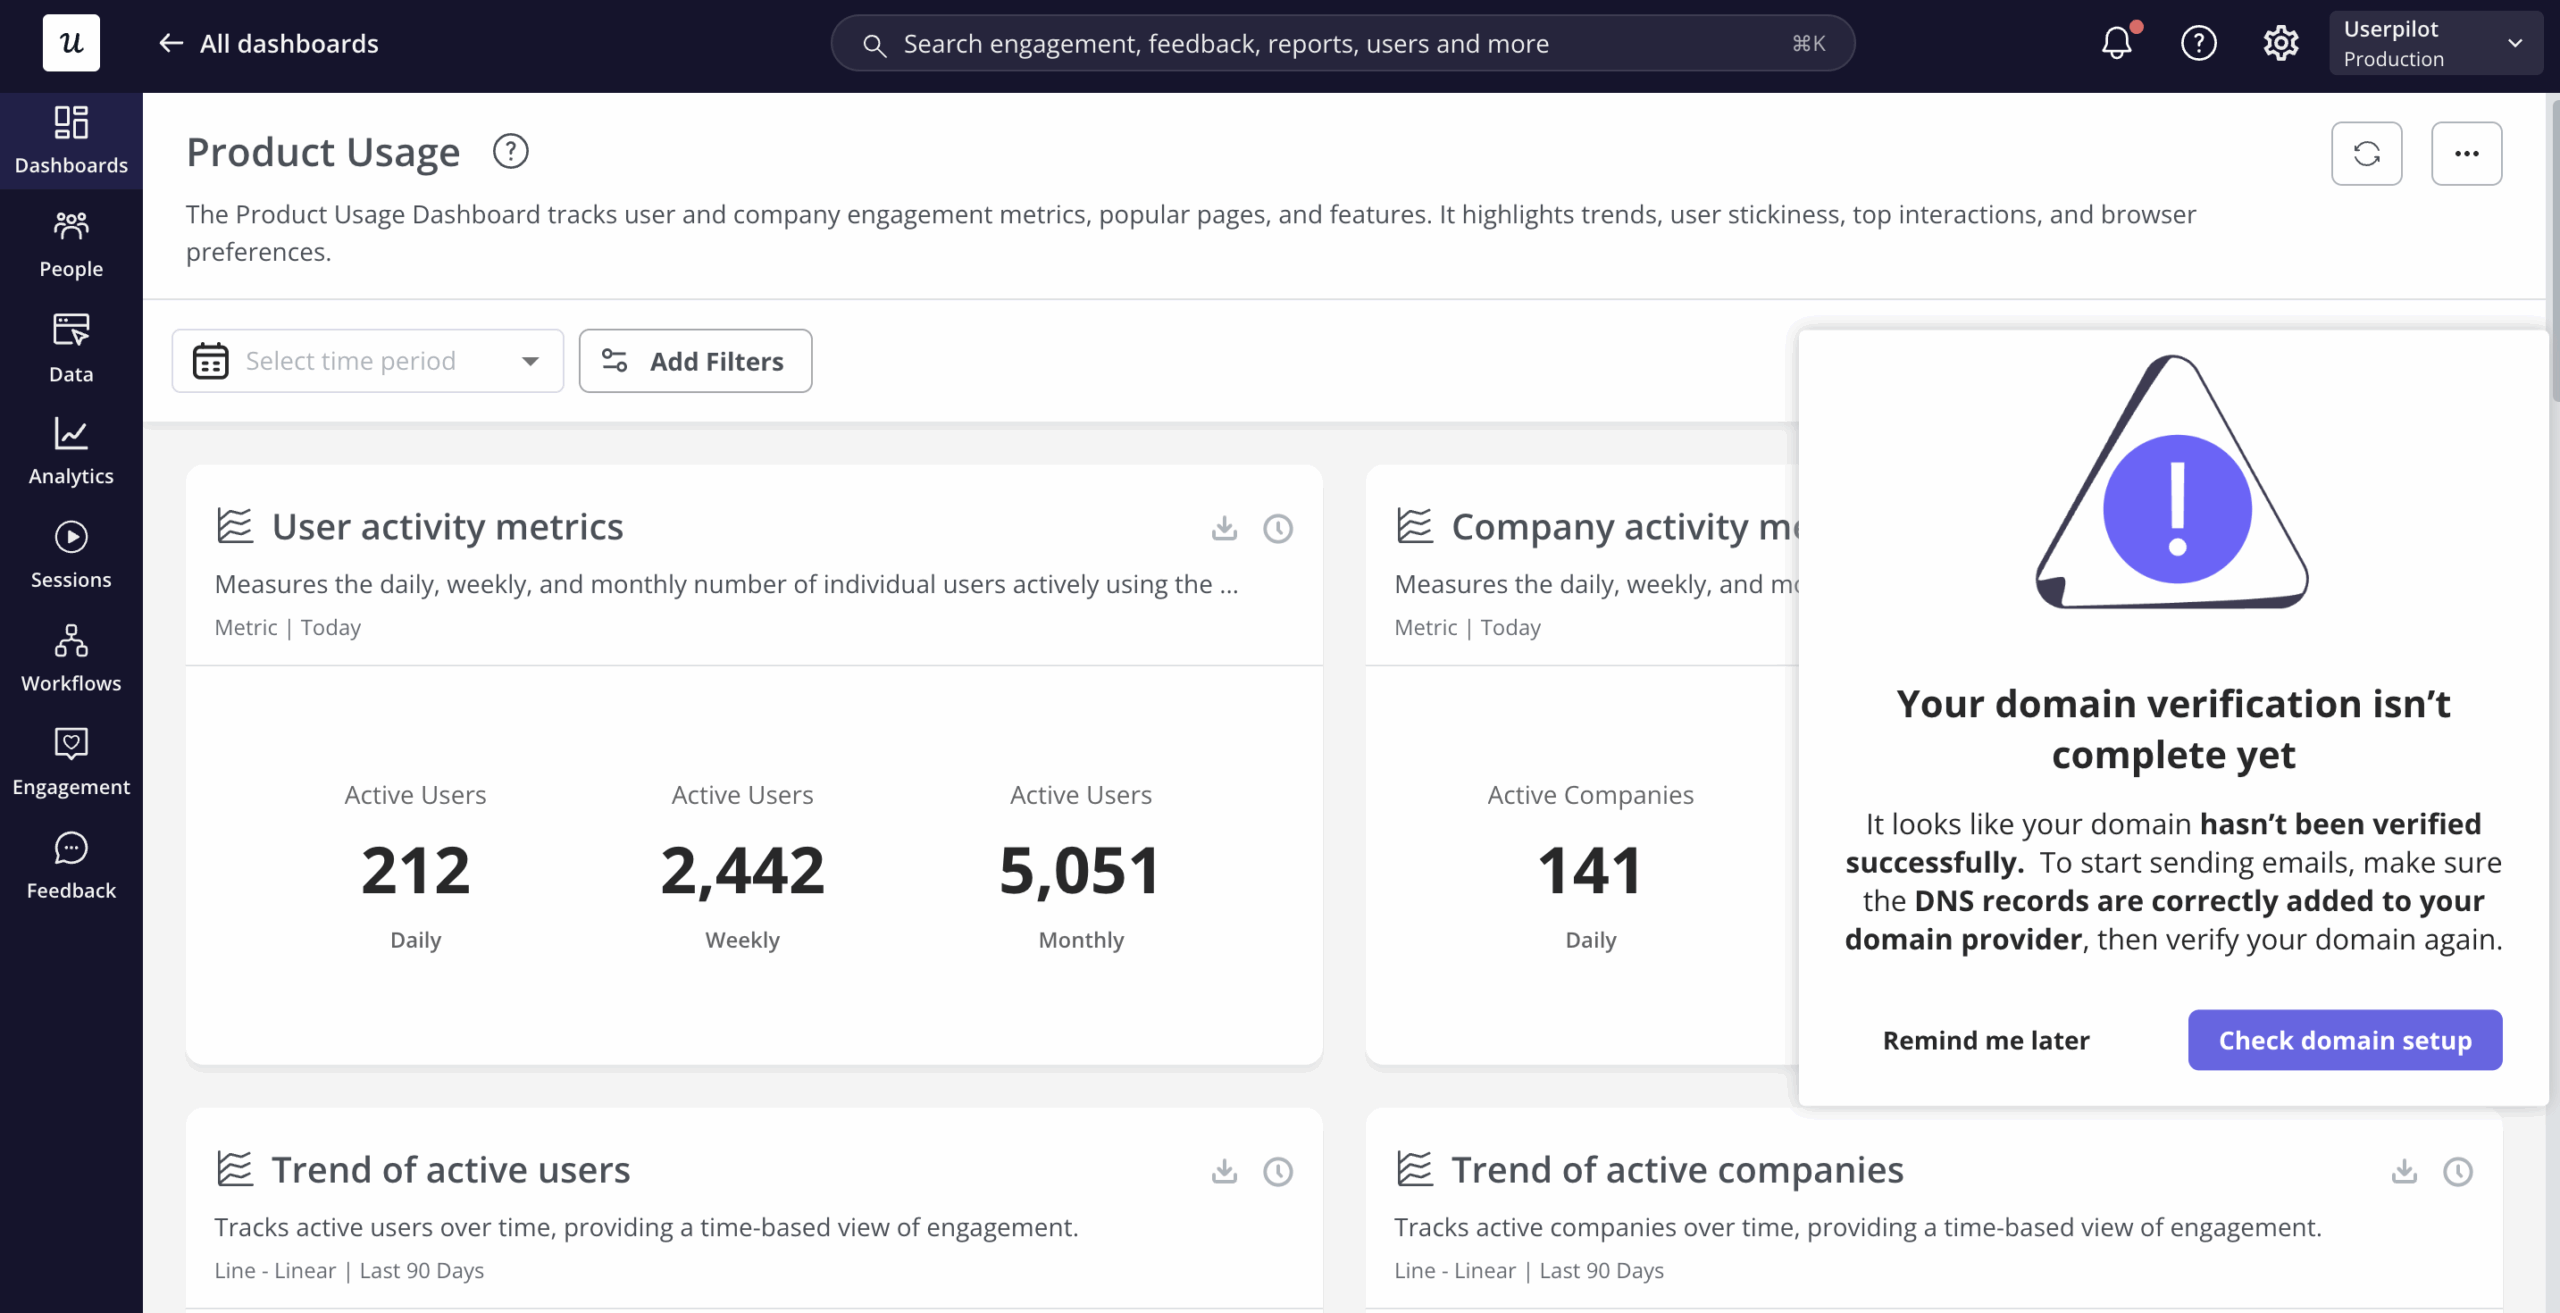
I checked the reports, understood exactly where users were getting stuck, and built a checklist and in-app guidance inside Userpilot within a few hours, without involving the dev team.
Most teams treat feature adoption metrics as a scoreboard. A low adoption rate triggers a post-mortem; a high one triggers a celebration. But a low number is a directional signal that narrows the problem to a specific part of the adoption funnel, and your job is to find which part.
It covers the feature adoption funnel, six metrics mapped to the failure modes they diagnose, and the interventions that follow from each. If you’ve shipped a feature and the numbers are lower than expected, start here.

What feature adoption metrics are (and what they’re not)
Feature adoption metrics are KPIs that measure how well users are embracing a specific feature in your product. That textbook definition is accurate as far as it goes. What it leaves out is that each metric maps to a different stage of the user journey and points to a different class of problem.
The distinction matters because a single adoption rate number can look identical whether users aren’t discovering the feature, are discovering it but abandoning it on first use, or are using it once and never coming back. Those are three different problems with three different fixes. The metrics pull them apart.
Feature adoption metrics are also not one-size-fits-all benchmarks. A 15% adoption rate for a complex, optional power feature is probably healthy; the same rate for a core workflow users need to succeed is a critical signal, and no industry average resolves that distinction. See the broader context of feature adoption if you want the fuller picture before diving into the diagnostic metrics.
The feature adoption funnel: Four stages, four places where users can drop
Every feature adoption metric maps to one of four stages in the feature adoption funnel. Understanding which stage a metric belongs to is what makes the diagnostic work: when a number is low, you know exactly which part of the user journey to investigate.
The four stages are:
- Exposed: The user has encountered the feature, through an in-app announcement, a tooltip, or organic discovery during normal product use.
- Activated: The user has taken their first meaningful action within the feature, demonstrating they’ve found it and started using it.
- Used: The user is engaging with the feature on a regular basis, integrating it into their standard workflow.
- Used again: The user keeps returning over time, signaling that habit has genuinely formed.
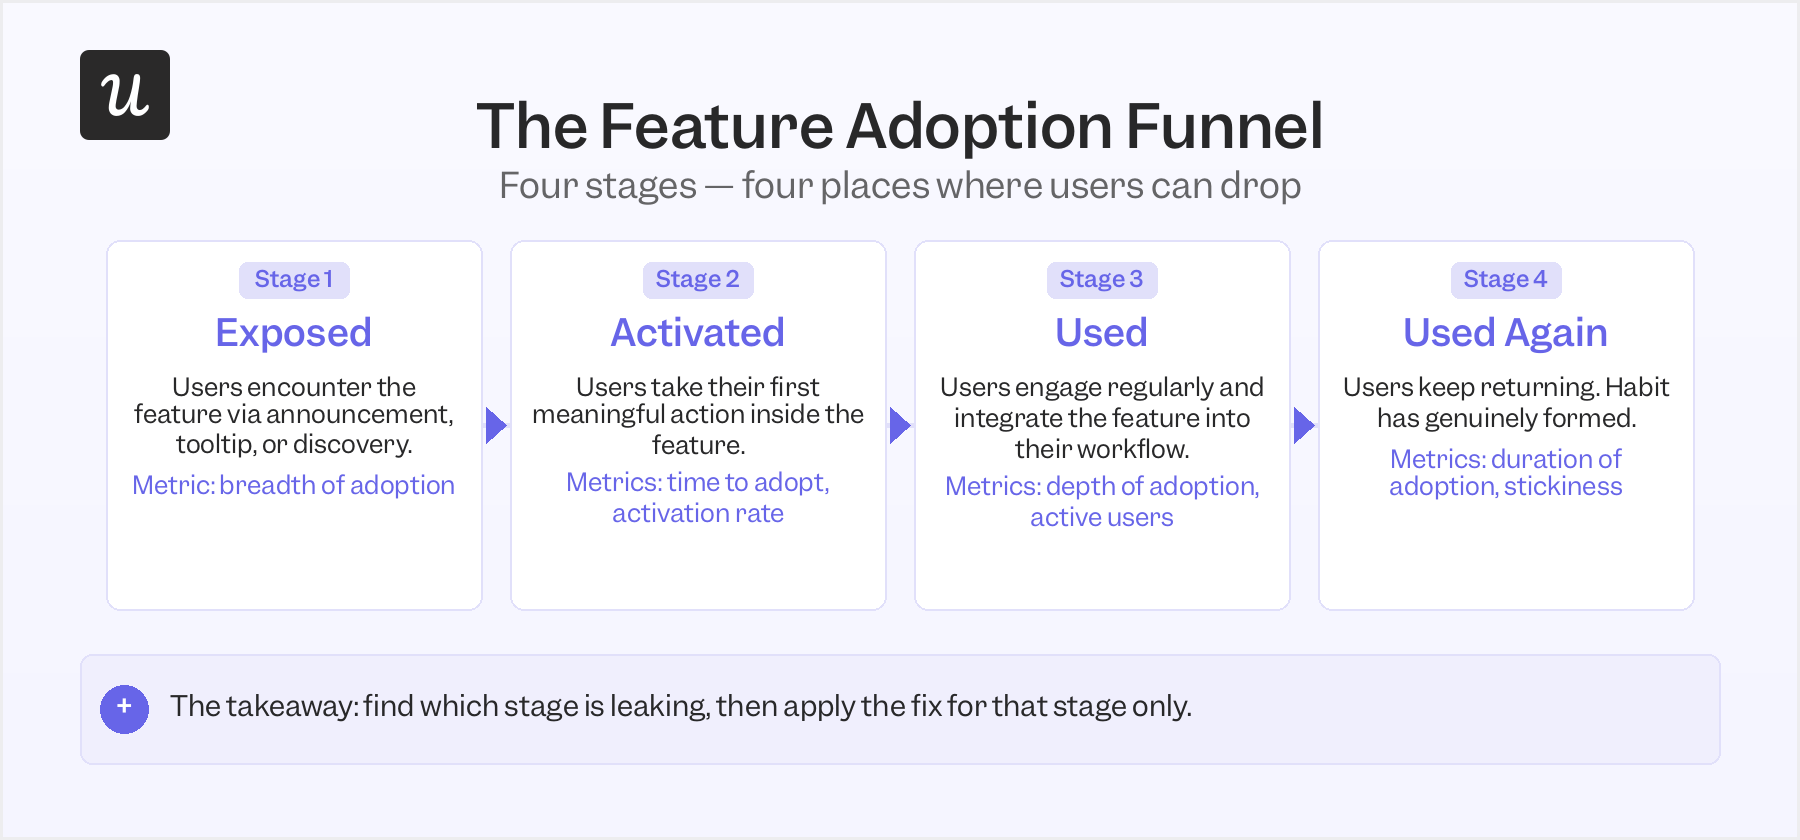
Breadth and exposure metrics sit at stage one. Activation rate and time to adopt belong to stage two, where the user either completes their first meaningful use of the feature or drops off. Depth of adoption, active user count, duration, and stickiness all measure stages three and four, where the question shifts from first use to habit formation.
The email feature case I mentioned in the intro leaked at stage two, between exposed and activated. Most users who reached the relevant part of Userpilot were encountering the feature (breadth was healthy). The problem was that they were dropping off at domain verification before completing their first meaningful action, which pointed to a time-to-adopt problem and told me exactly what to investigate.
Feature adoption rate: Your baseline
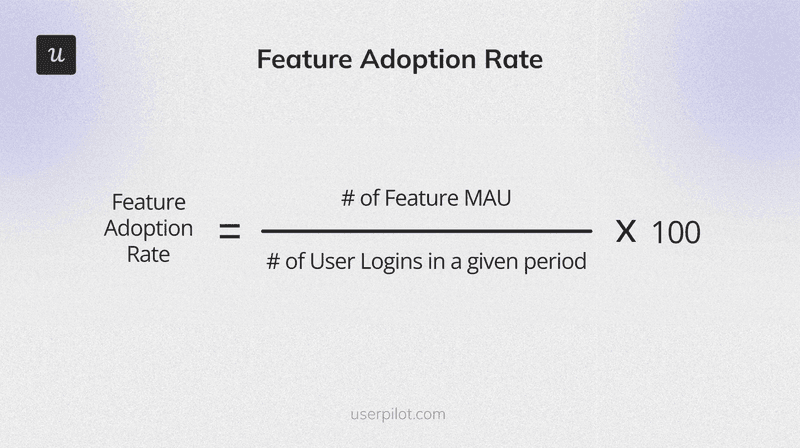
The feature adoption rate is the percentage of active users who interact with a specific feature over a given period. It’s the first feature adoption metric to check when a launch feels underperforming, and it’s also the one that tells you almost nothing on its own about what to fix.
The formula: divide the number of users who adopted the feature by the total number of active users in the same period, then multiply by 100. If 200 out of 500 monthly active users used your new analytics dashboard, your monthly feature adoption rate is 40%.
Our benchmark data puts the average core feature adoption rate for SaaS products at 24.5%. That average hides real variation by feature type: core features tend to see higher rates, while advanced or optional features will naturally sit lower. The number that matters is your rate relative to what you defined as success when you scoped the feature, not the industry average.
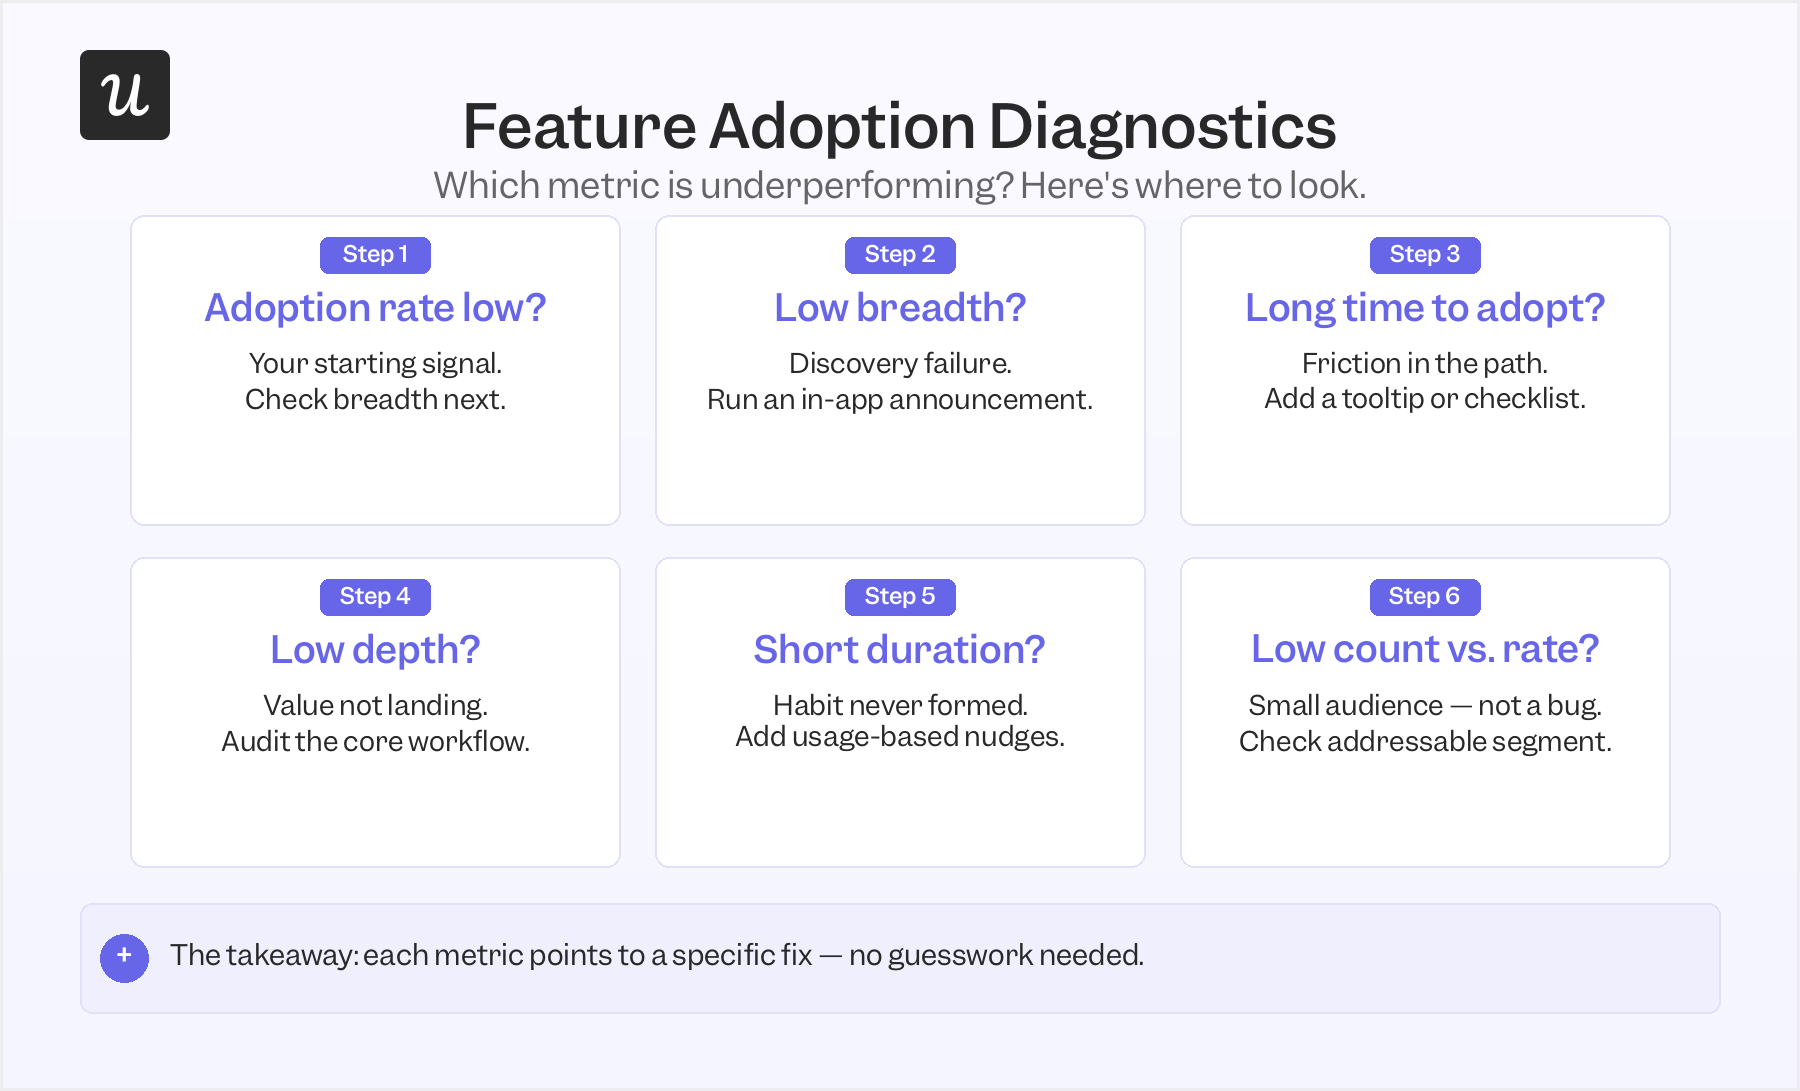
When the feature adoption rate is low, treat it as a prompt to run the diagnostic. Start with breadth: if that’s also low, the feature isn’t being discovered and everything downstream will suffer. Healthy breadth paired with low adoption means the problem lives somewhere between first exposure and consistent use.
Breadth of adoption: Diagnosing a discovery failure
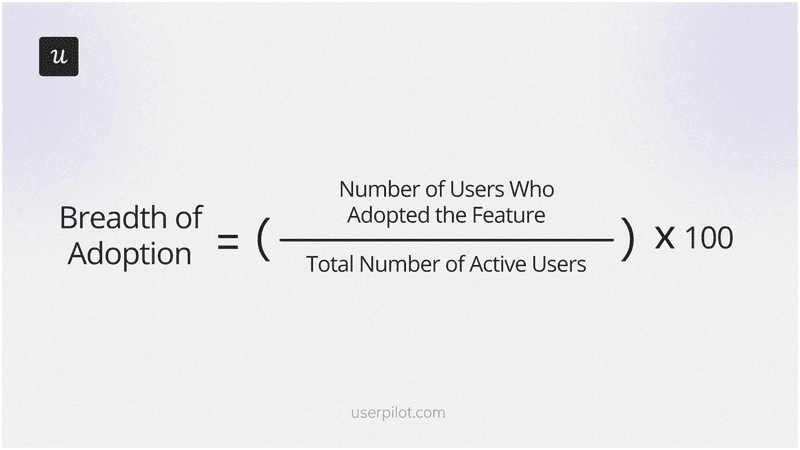
Breadth of adoption tracks what percentage of your active users have tried the feature at all. In the context of feature adoption metrics, it answers the earliest question in the funnel: does this feature exist for your users, or is it effectively invisible?
The formula: divide the number of users who have adopted the feature by the total number of active users in the period, then multiply by 100. Low breadth (materially below what you’d expect given the feature’s positioning) almost always points to a discovery failure rather than a value problem. Users who haven’t found the feature can’t tell you it doesn’t work for them.
The fix for a discovery failure is in-app messaging, not product redesign. A targeted feature announcement, a tooltip at the point in the product where the feature would be most relevant, or a secondary onboarding flow for users who haven’t yet encountered it will usually move breadth within a few weeks.
The key step most teams skip: segment by which users haven’t adopted yet before you run the announcement. Broadcasting to your whole user base creates noise for people already using the feature and dilutes the message for the people who actually need it.
When we looked at Userpilot’s email feature, breadth wasn’t the problem. Most users who reached the relevant part of the product were encountering the feature. The drop-off was happening further down the funnel, which shifted the diagnosis from a discovery problem to a friction problem.
Time to adopt: Diagnosing friction in the path to the feature
Time to adopt measures how long it takes a user to go from first exposure to a feature to their first meaningful use of it. Among all the feature adoption metrics in this guide, it’s the most precise indicator of friction in the path between awareness and activation.
To calculate it: subtract the timestamp of a user’s first exposure event from the timestamp of their first meaningful use. You’ll need to define “first exposure” concretely before you track it: an in-app announcement view, a tooltip interaction, or first navigation to the feature’s screen are all reasonable choices. Average the individual gaps across all users in the cohort to get your time-to-adopt metric.
Two related concepts worth keeping separate: Time to First Action (TTFA) measures how long it takes a user to interact with the feature at all after it becomes available. Time to Value (TTV) is the time to their first genuinely useful outcome. Adopting a feature in the diagnostic sense falls between these two: the focus isn’t just the first click, but the completion of meaningful use that signals the feature has genuinely landed.
A long average time-to-adopt tells you something between awareness and activation is creating unnecessary drag. That’s what the email feature funnel showed. The data pinpointed domain verification as the chokepoint: users were abandoning setup right there, not because the step was inherently complex, but because they didn’t have enough context to get through it confidently.
The fix was a step-by-step checklist and a targeting modal, both built inside Userpilot in a few hours. I walked users through each setup step and added in-app guidance that highlighted the correct path at domain verification. No engineering ticket, no sprint planning required.
Depth of adoption: Diagnosing a value delivery failure
Depth of adoption measures how intensively users engage with a feature once they’re using it. Where other feature adoption metrics like breadth tell you how many users reached the feature, depth tells you what they did when they got there.
There’s no universal formula for depth because the right measure depends on the feature. A reporting dashboard might use custom reports created per session as its signal; a collaboration feature would look at teammates invited or shared workflows built instead. The right measure is whatever action best signals that the user has integrated the feature into their actual workflow, not just visited it once.
Low depth is a value delivery problem. Users found the feature and tried it, but the core workflow didn’t give them enough to keep going. Before running any interventions, review the feature’s flow: is the value front-loaded and accessible on the first or second use, or buried behind configuration steps that most users won’t complete?
Depth also matters when diagnosing how product usage translates to retention. Users who adopt a feature superficially (opening it regularly but only ever interacting with the same surface-level function) show up as active in your adoption rate but aren’t getting the compounding value that drives renewal. Depth is what separates retained users from users who will churn at the next renewal cycle.
Duration of adoption: Diagnosing a habit failure
Duration of adoption measures how long users keep engaging with a feature after their initial adoption. In the feature adoption metrics stack, it’s the clearest signal of whether a feature formed a genuine habit or just captured a moment of curiosity.
To calculate it: record the timestamp of each user’s first meaningful use and compare it to their most recent use within the measurement window. Average across users. Short average durations (most users stopping within days or weeks of first adopting) tell you the novelty effect is real but habit formation isn’t following it.
The intervention for short duration is different from the fix for low breadth or low depth. Once users have tried the feature and understood it, they need contextual reminders that bring them back at the right moment in their workflow. Usage-based nudges triggered when a user completes a related action but skips the feature, progress indicators, and secondary onboarding flows designed for users who adopted once and went quiet are the most effective levers.
Short duration often signals that the feature’s value isn’t obvious enough after first use to pull users back on their own. That’s sometimes a UX problem, but just as often it’s a communication gap. An in-app message showing users what they can do next, triggered a few days after their first use, can meaningfully extend duration without any changes to the feature itself.
Active users per feature: When the rate isn’t the whole story
Active users per feature is the absolute count of unique users who engage with a specific feature within a defined period. Most feature adoption metrics express adoption as a rate or percentage. The absolute count is what tells you whether a low rate reflects a product problem or simply a small addressable audience.
Standard calculation: track unique users who performed the defined “active engagement” action for that feature within your timeframe: daily, weekly, or monthly depending on the expected usage pattern. An increasing active user count is a positive signal even when the adoption rate holds steady. A declining count, even if the rate stays flat, is usually a leading indicator that your broader active user base is also declining.
Active users per feature also gives you the denominator check. A feature designed for a specific segment will naturally show a low adoption rate across the whole user base, but the absolute count of active users might be exactly where you’d expect it given the target audience. Checking that count against your expected addressable audience tells you whether the low rate is a signal to act on or simply a feature of the product’s design.
How to act on what your feature adoption metrics tell you
The point of tracking feature adoption metrics is to get to the right intervention quickly, not to generate a report. My standard process after a feature ships: create a report, track meaningful events, and look for where drop-off happens and at which step users get stuck. Once you know which metric is underperforming, you know which funnel stage is leaking, and the fix usually follows.
The decision sequence I use:
- Check feature adoption rate: If it’s materially below your target, run the full diagnostic. If it’s on track, check depth and duration to make sure engagement is substantive, not superficial.
- Check breadth: If breadth is low, the problem is discovery. Run a targeted in-app onboarding flow or feature announcement for users who haven’t encountered the feature yet.
- Check time to adopt: If breadth is healthy but adoption is low, look for friction between first exposure and first use. Run a funnel analysis to find the specific drop-off step, then add targeted guidance at that point.
- Check depth: If users are activating but not going deeper, review the core workflow. Check whether the value payoff is accessible on the first or second use or buried behind too many steps.
- Check duration: If users activate and engage initially but then go quiet, the feature has a habit-formation gap. Build secondary onboarding or usage-based triggers that bring users back at the right moment.
- Check active user count vs. addressable audience: If the rate looks low but the absolute count matches your expected audience size, the feature is working for the users it was designed for.
Most of the time, the fix isn’t an engineering ticket. In my experience, it’s an in-app message, a contextual tooltip, or a secondary onboarding flow that addresses the specific point where users stopped moving forward. That’s the operational value of having a diagnostic framework rather than just a list of metrics to report on.
How to track feature adoption metrics in Userpilot
Tracking feature adoption metrics well requires tagging the right events and building the right reports. In Userpilot, the starting point is feature tagging: define which user actions constitute meaningful engagement with each feature and tag them directly in the product without writing code. That event data becomes the foundation for every adoption metric in this guide.
From there, the core reports are:
- Funnel analysis: Map the adoption path from exposure to consistent use, and shows exactly where users drop off between stages. This is how I identified the email feature bottleneck and knew precisely where to add guidance.
- Feature engagement dashboard: Track active users, adoption rate, and usage frequency across your product in one view, useful for the regular health check after a launch.
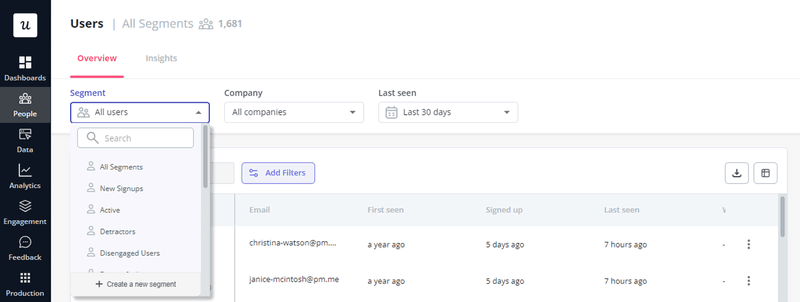
- User segmentation: Filter adoption data by user attributes (plan, tenure, persona) so you can see whether a low rate is a broad product problem or concentrated in a specific segment.
- A/B testing: Test an in-app intervention (a new tooltip, a different onboarding flow, a feature announcement variant) against an adoption outcome, so you’re measuring the actual impact of each fix rather than guessing.
- Agent analytics: See whether agents drive activation and adoption — or silently fail users at critical moments.
The full diagnostic picture comes from combining quantitative adoption data with qualitative signals. Triggering in-app surveys at key moments (right after a user’s first use of a feature, or after they abandon a workflow mid-step) surfaces the “why” behind the numbers. That combination of quantitative and qualitative is what makes adoption data actionable rather than just descriptive.
Start diagnosing, not just reporting
Feature adoption metrics are useful only when they tell you what to fix. If you’ve shipped a feature and the numbers aren’t where you want them, the framework in this guide is your starting point: check the rate, then check breadth, then check time to adopt, then check depth and duration. Each metric narrows the problem to a specific part of the adoption funnel.
Userpilot gives you the tools to run this diagnostic, build the interventions, and measure whether they worked, all without writing code. Book a demo to see how the funnel analysis, feature tagging, and in-app messaging work together in practice.
About the author