Balancing Numbers and Narratives: The Power of Combining Quantitative and Qualitative Insights in Product Decisions

A reader recently asked whether their answer to my “data vs intuition” WMT interview question passed my sniff test. I’m copying/pasting the original question and rationale below:
“Walk me through a product trade-off where the data in your hands vs the intuition in your head didn’t jive, and how you made sense of it”
From this, I can learn:
- What level of trade-offs you have made.
- If you use data and to what degree.
- Do you over-rely on data to guide.
- How do you build/refine product instinct.
- If you follow curiosity or index on delivery.
The reader’s answer was sometimes you see a data point that seems too good to be true, and talking to customers can provide the context to gauge whether it is or isn’t. I ask this question during phone screens fairly regularly, and it’s pretty common to hear an example where the internal metrics dashboard and the external customer voice are the source of the tension.
In product development, the balance between data and intuition often becomes a defining factor; the classic ‘data vs intuition’ conundrum made me reflect on how important it is for PMs to straddle the spectrum.
One of the reasons I like this question is I’m always looking to learn new ways to blend quantitative and qualitative insights, which I think is the real magic of product building.
Try Userpilot Now
See Why 1,000+ Teams Choose Userpilot
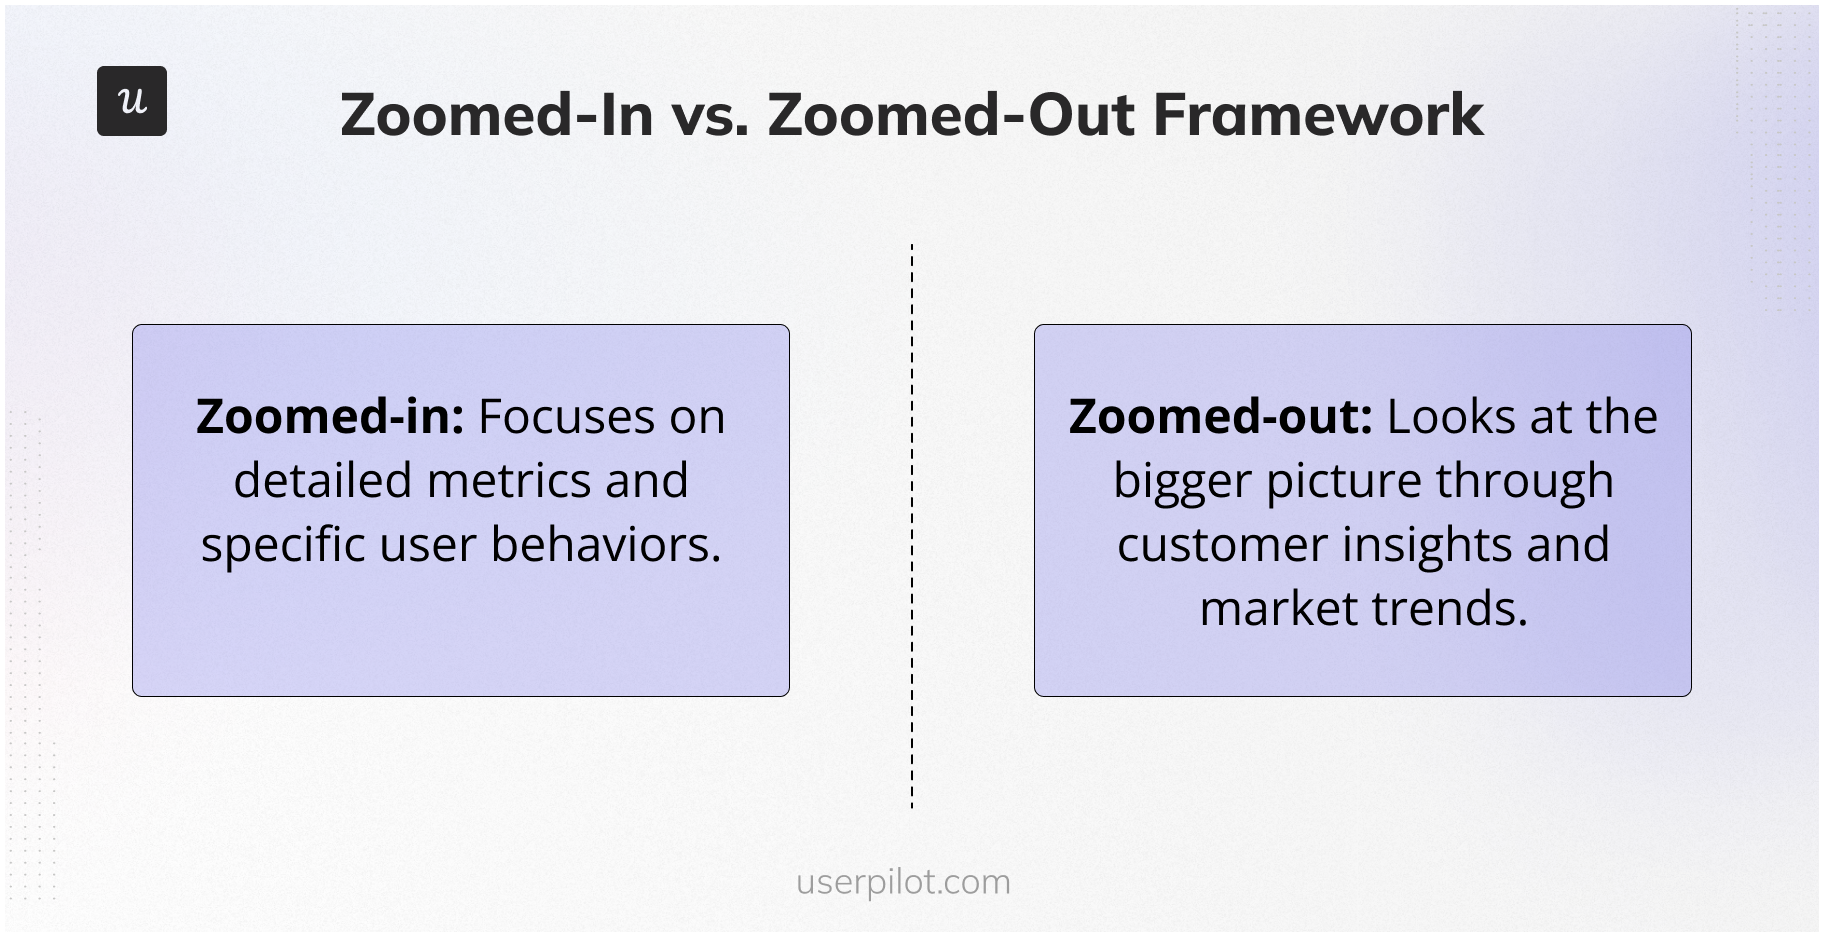
The zoomed-in vs. zoomed-out framework
But this reader’s response led me to another realization – one way to connect quantitative and qualitative insights is to think of them as 2 ends of a shared view, zoomed-out at one end and zoomed-in on the other end. For example, in the situation the reader shared, the data insight was a zoomed-in view, but the customer conversation layered on the zoomed-out view.
Here are some concrete examples:
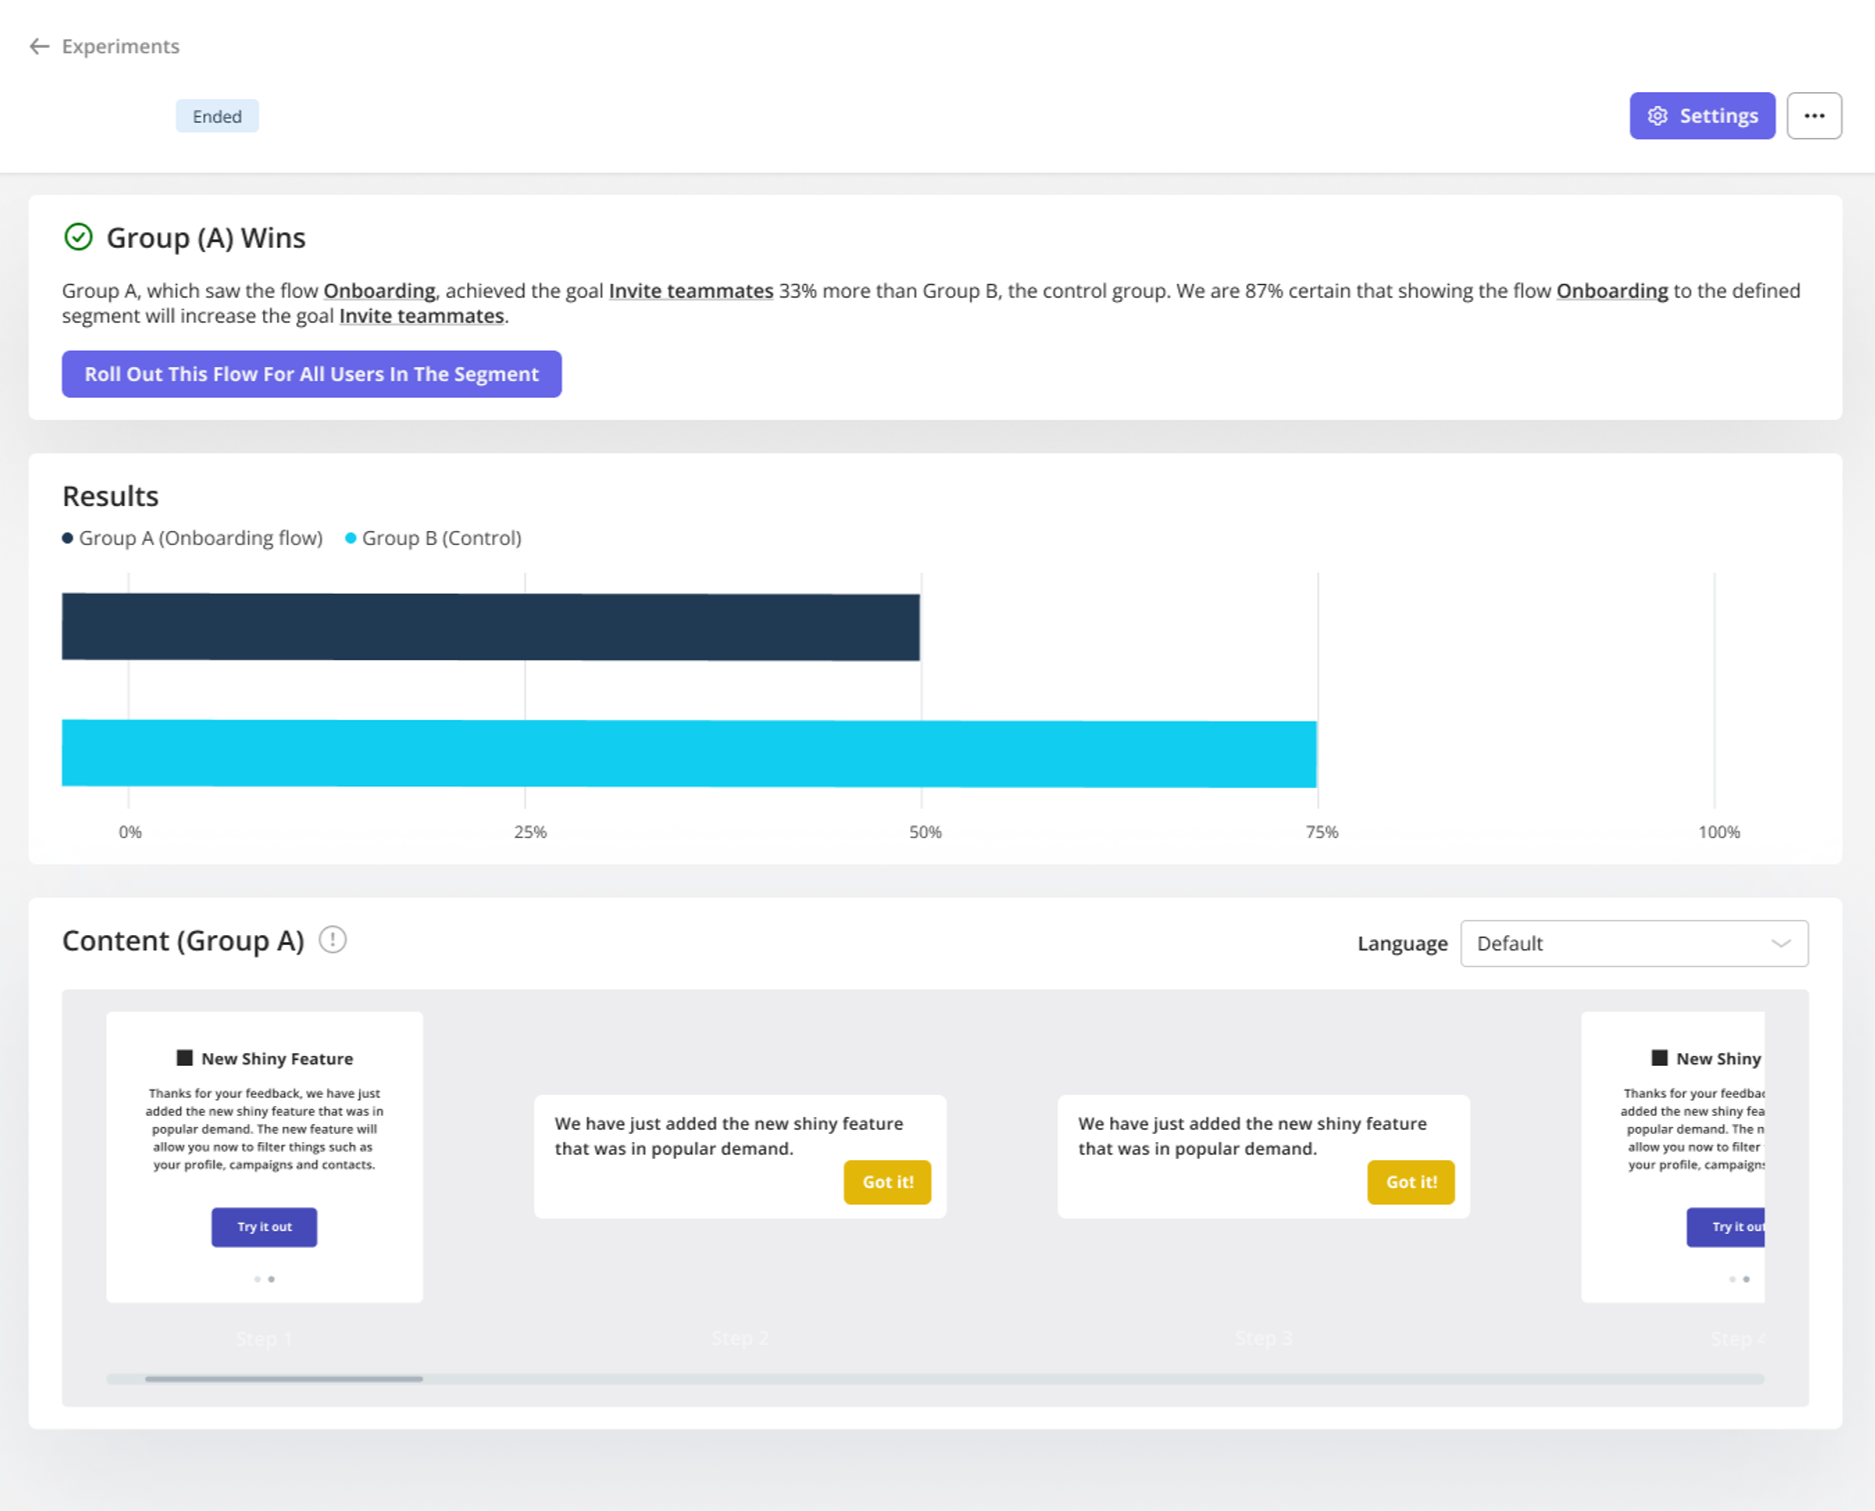
- Interviewing a set of users with a common profile can help you shortlist 1 shared problem to scope and solve for them (zoomed-out/qualitative), but running an A/B test with different UX variations can help identify the optimal solution path to take (zoomed-in/quantitative).
- Looking at a category’s TAM can determine whether your company should invest in the space (zoomed-out/quantitative), but talking to analysts who cover the domain can shape the differentiated solution you build (zoomed-in qualitative).
- When you zoom in on A/B test results, you’re seeing the impact of a very specific change, but zooming out with user interviews allows you to understand the broader context—the ‘why’ behind the behaviors you’re seeing.
The need to blend qual and quant when making product decisions is not a new discovery, but being aware of whether you’re zoomed out or zoomed in and knowing what altitude to bridge things is useful.
![]()
Get both zoomed-in & zoomed-out views in one tool – with Product Analytics, Session Recording, User Surveys & Onboarding in one!

When data and intuition clash: How to bridge the gap
To go back to the original WMT question, I think the best examples of data vs intuition conundrums are when the zoomed-out and zoomed-in views don’t reconcile:
- We built a feature that we heard a legitimate need for, but now no one is using it.
- We optimized a painful user workflow, but the user survey reactions were meh.
- We knew the adoption curve of our product followed a particular pattern, but that turned out not to be true when we entered a new geographic region.
- The intended usage of our product was X, but then users kept using it for Y.
As 2025 gets underway, we are seeing more and more avenues for PMs to balance numbers and narratives; many insights platforms now offer ways to combine quantitative and qualitative learning.
When both sides of the story are brought together, you either get more confidence in your product decisions through consistency OR there is a dimension to further dig into and reconcile, which ultimately paves the way for incremental exploration.
There are a variety of methods to both zoom in and out when exploring user behavior, but 2 techniques that I consistently use are session replays and user cohorts.
- With session replay, which is a reconstruction of the user clickstream with recording-like fidelity, you have the opportunity to zoom into a metric shift at an individual user level to tease out why the behavior doesn’t mirror historical usage patterns.
- And with user cohorts, which allow you to slice your audience using concrete dimensions, you can segment your population in ways where you can see trends in aggregate when you zoom out.
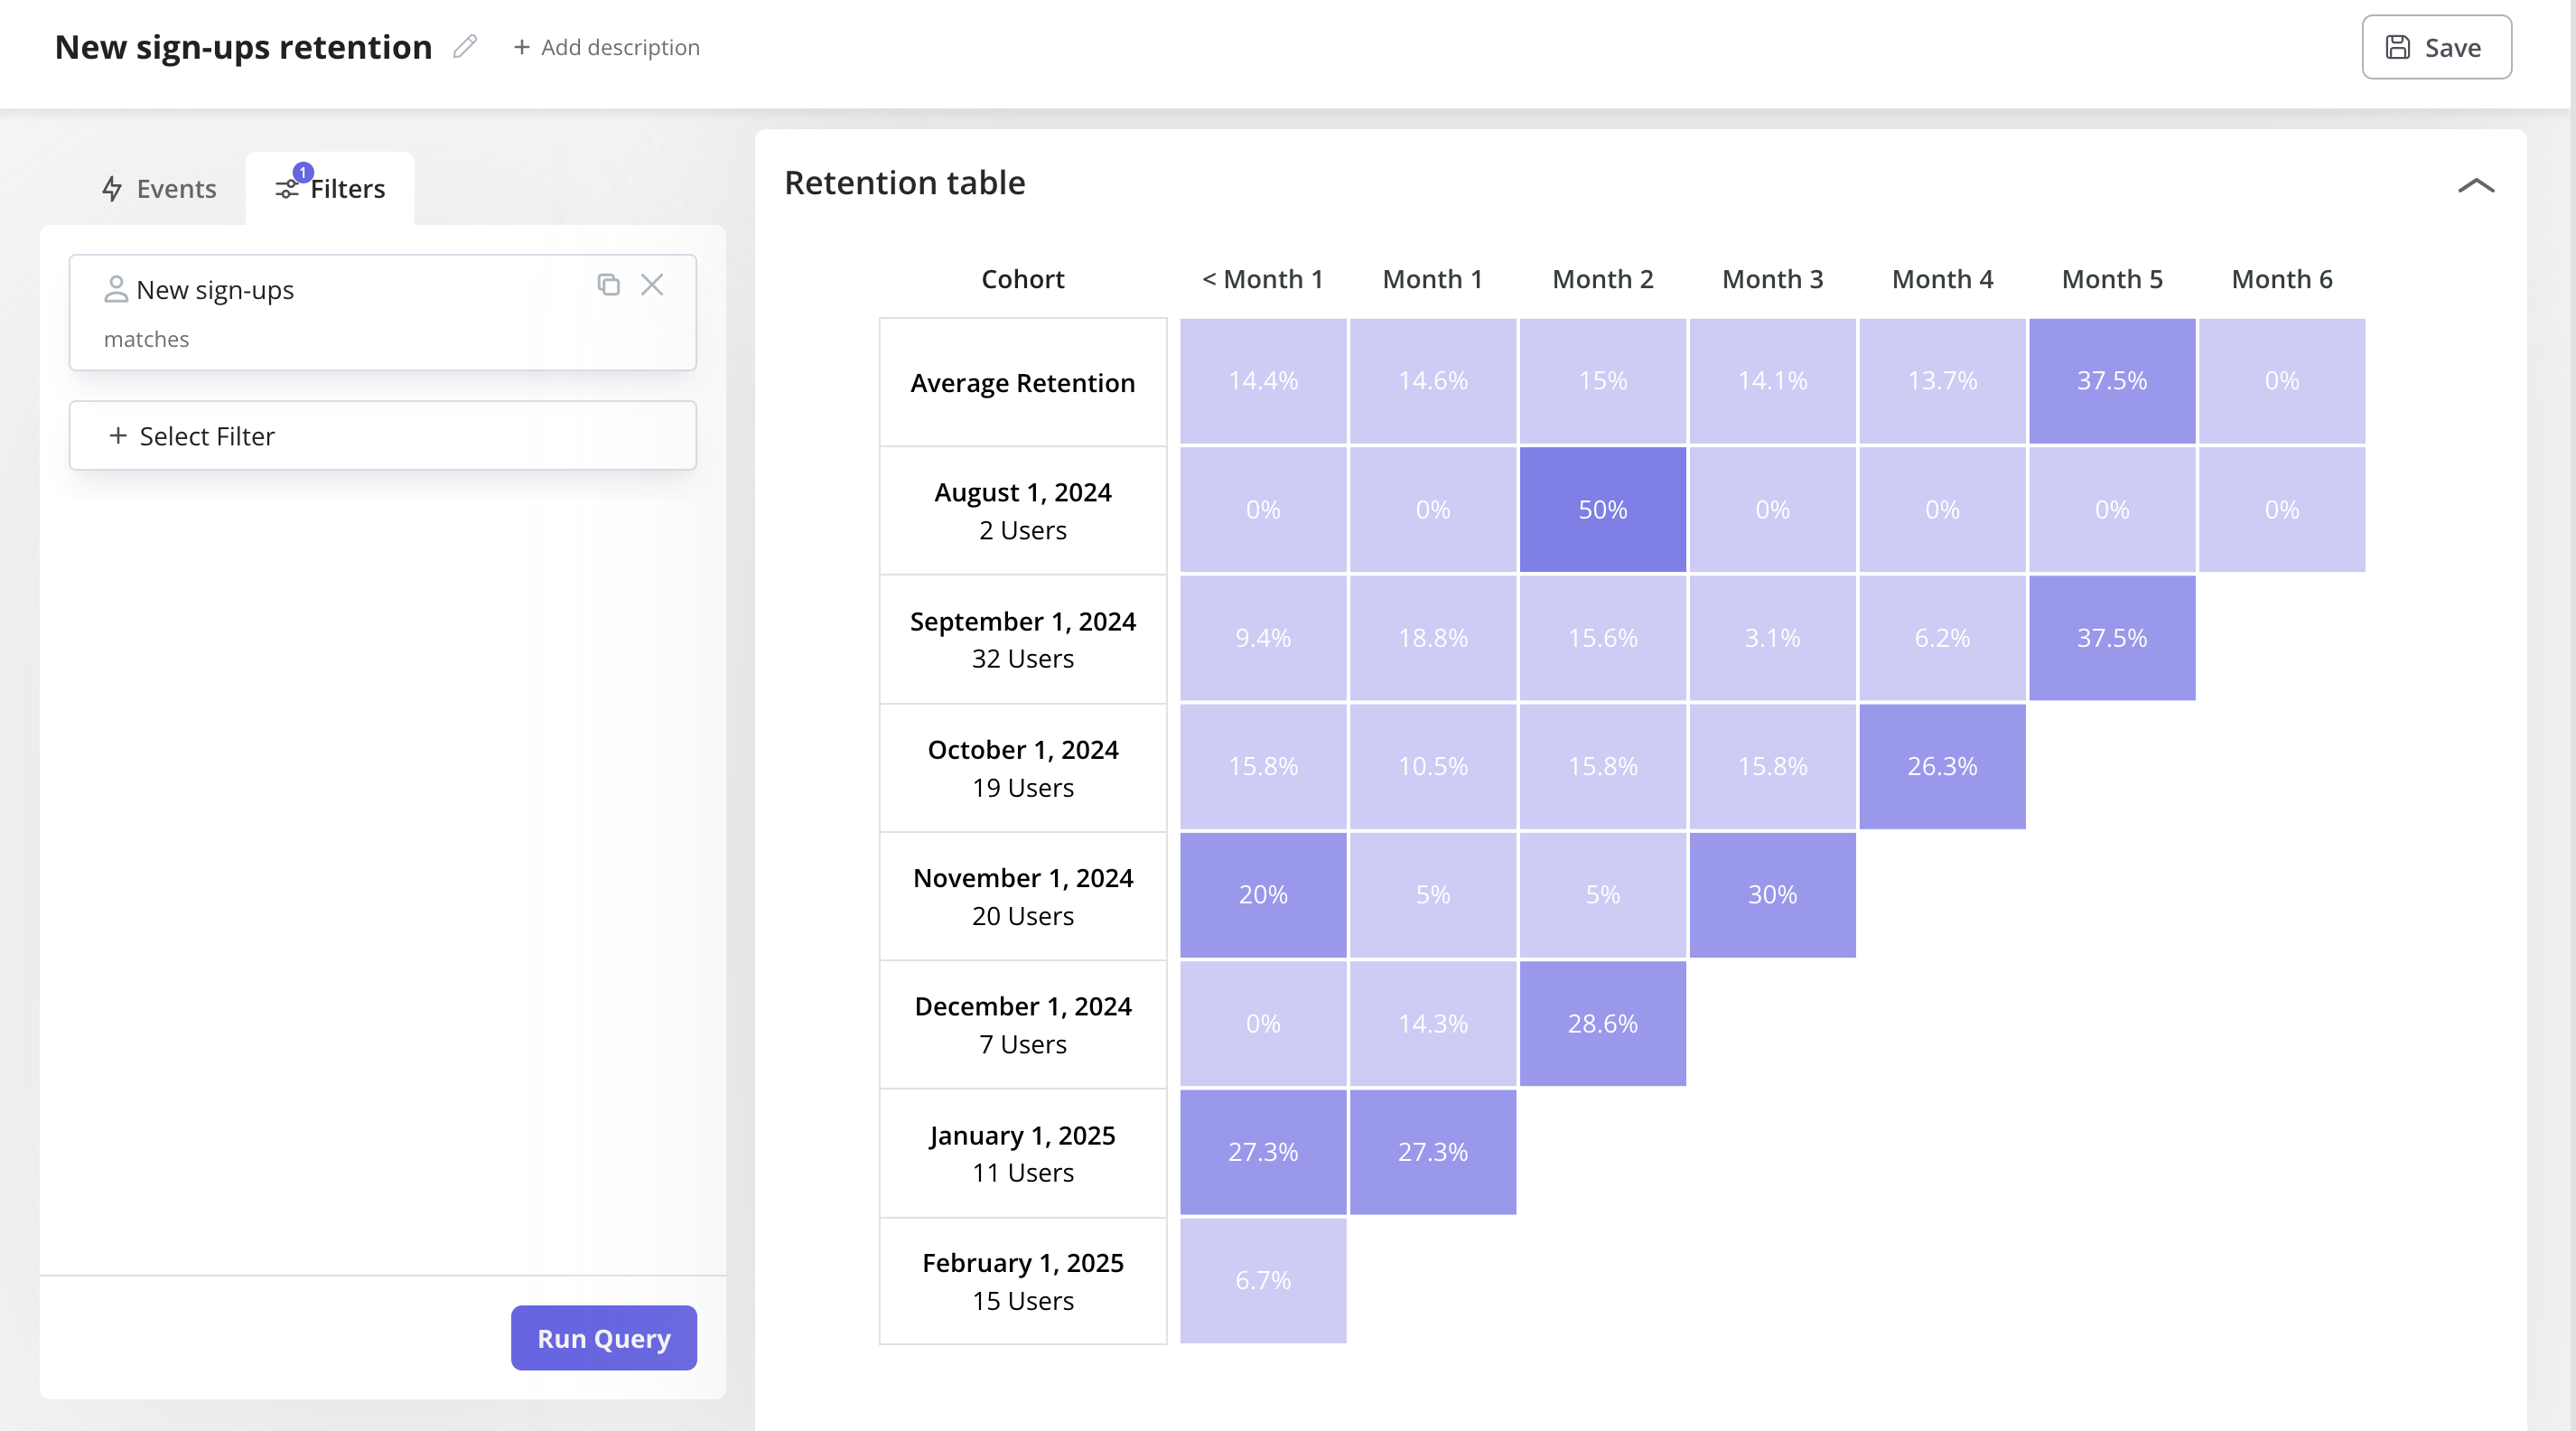
With both these capabilities, you have the option to zoom the other way; session replays can be aggregated for a birds-eye view, and user cohorts can provide a ground truth when your user base gets very heterogeneous. Any insights platform that doesn’t provide these capabilities out of the box in a well-integrated way is soon to become obsolete.
Learn More from the Interview with Ibrahim Bashir

How tools are evolving to blend data and intuition
On the quantitative end, tools that were historically used to track and report product metrics can now help PMs with guided exploration using historical trends, external benchmarks, and learned heuristics.
One aspect of human data scientists that tools have struggled to replace is the intuition honed over time on how to slice data, how to segment users, and where to double click – but with rapid advances in AI models, we are not far off from agents serving as analytics co-pilots.
For example, having owned the North Star metric for the flagship product at a public company, I understand the desire to connect any blip to a product release or a marketing campaign.
And when I first took over managing the metric, I spent many cycles chasing theories and attempting narratives, but over time, in partnership with product analysts and data scientists, I learned that most big jumps and dips were either simple seasonality or pipeline errors. An analytics agent that has the equivalent learning of multiple quarters (or even years) of metrics deep dives is a tremendous asset.
And on the qualitative side, customer anecdotes can now be more easily and reliably synthesized than ever before, and layered into taxonomies that make it easier to reason about user behavior and product journeys.
Whether it’s research notes, feature requests, session recordings, or support tickets, AI models can now create structure out of unstructured datasets at a speed and scale that allows product builders to weave in qualitative feedback from users nearly instantaneously.
When I served as the GM of a business unit, I ran a Monday morning meeting where every bit of customer feedback was summarized and presented as a series of themes; this was an operationally expensive exercise because there were so many different channels to reconcile across.
But it was necessary because looking at just win notes or support tickets or incident notes gives you a biased perspective on how the product is being deployed and how it is (or isn’t) delightful.
With advanced ML models, stitching together a universal taxonomy across all the tools each department (Sales, Support, Engineering, Marketing, Product) utilizes is no longer a manual effort for operations teams, leaving not only more space to interpret but also shortening the time to identify meaningful trends.
Focusing on a unified approach
Ultimately, as the analytics and actioning toolchain used by PMs matures to allow mixing data AND intuition instead of treating decisions as data OR intuition, the speed and quality of product calls will increase and improve.
By seamlessly combining both quantitative and qualitative insights, PMs can make more confident, well-rounded choices. And the net result will be better products for users created with less effort by builders.
Don’t Miss Out on Expert Knowledge That Keeps You Ahead.