User retention measures how many users continue to use your product over time — but the real question for SaaS teams isn’t just how many users stay, it’s what that retention is worth.
In this guide, we break down how to calculate user retention, explain the most common retention formulas, and show how retention connects directly to revenue, growth, and long-term business value. You’ll also learn when different retention calculations matter, how to avoid common mistakes, and how to interpret retention beyond a single percentage.
Try Userpilot Now
See Why 1,000+ Teams Choose Userpilot

How to calculate user retention
You’ll need to consider a few things before calculating user retention. Firstly, you’ll need to understand exactly what behavior counts as “using your product.” This can vary depending on your product, ranging from product purchases to feature updates.
The next thing you need to consider is the time frame on which you want to base your calculation. Again, this varies from product to product. If your product has a low frequency of usage, you might consider using a longer time frame, as that will help you avoid errors in measuring churn.
Retention value formula: how retention translates into revenue
A retention rate on its own doesn’t tell you how valuable retention actually is to your business. To understand retention value, you need to connect retained users to revenue over time.
A simple way to think about retention value is:
- Retention value = Retained users × Average revenue per user × Retention period
This formula shifts the focus from how many users stay to how much revenue those users generate while they stay.
Why higher retention compounds revenue
Retention has a compounding effect because retained users continue generating revenue without requiring additional acquisition spend. Each extra month a customer stays active increases lifetime revenue while spreading acquisition costs over a longer period.
This is why even small improvements in retention can have an outsized impact on growth:
- Longer retention extends customer lifetime value (LTV).
- Higher LTV improves payback periods and unit economics.
- Improved unit economics make scaling acquisition more sustainable.
In other words, retention doesn’t just preserve revenue; it amplifies it over time.
Why the same retention rate doesn’t equal the same value
Two companies can have identical retention rates and wildly different retention value.
For example:
Retaining a user on a $20/month plan for 12 months creates far less value than retaining an enterprise customer on a $500/month plan for the same period.
Likewise, retaining a customer who expands their usage over time contributes more value than retaining a flat, low-usage account.
That’s why retention should be evaluated alongside revenue metrics like ARPU, MRR retention, and customer lifetime value, not as a standalone percentage.
To calculate the underlying retention percentage itself, see our guide on how to calculate customer retention rate.
User retention calculation formula – 3 ways to calculate it
There is more than one way of calculating the user retention rate. We can outline the basic principle behind the calculation using the following formula:
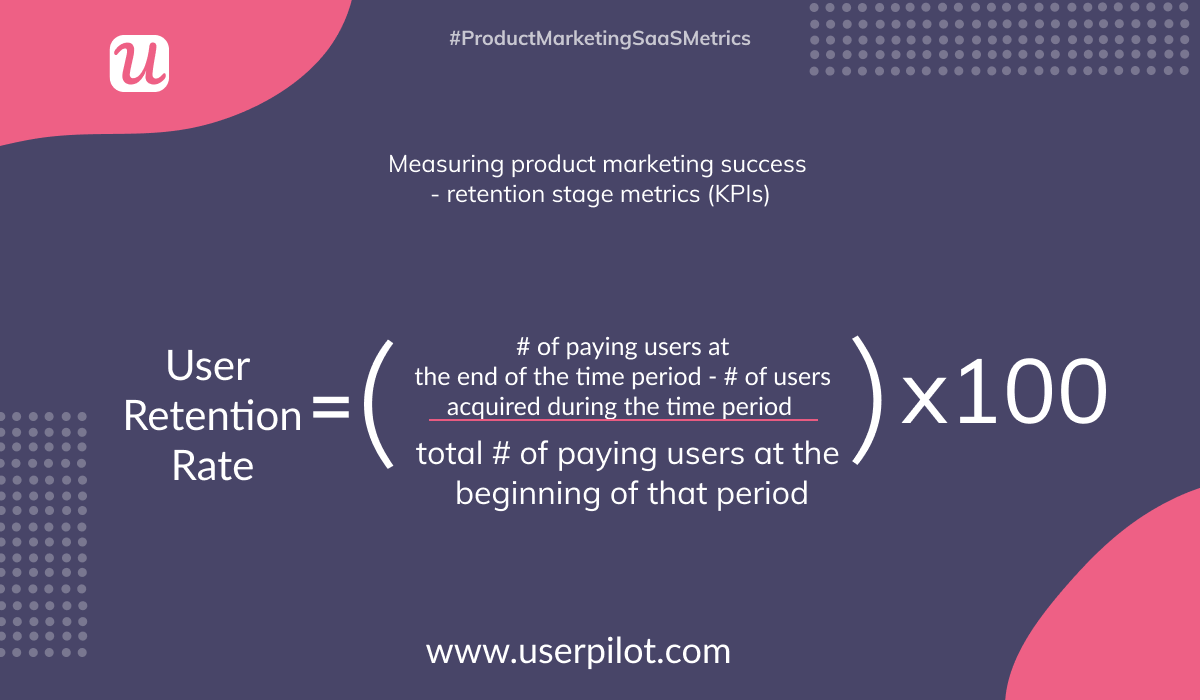
As we mentioned earlier, what counts as product usage varies according to the product. So using a basic retention rate formula might be too simplistic for some businesses. In that case, you can use one of three popular methods of calculating user retention:
- Classic retention
- Range retention
- Rolling retention
Let’s look at each of these in turn.
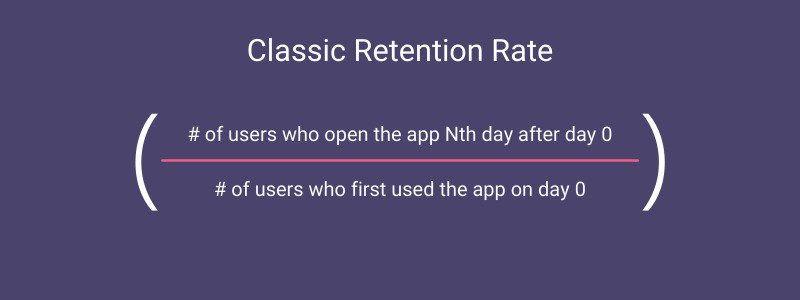
1. Classic Retention
When calculating classic retention, the first day on which your customers use your app is considered “Day 0”.
Any day after Day 0 is considered Day N, where “N” is the number of days after Day 0. For example, when calculating retention for 4 days after Day 0, the value of N is 4.
Classic retention rate is calculated by dividing the number of users who used your app on Day N by the number of users who used your app on Day 0.
Here’s a scenario to help you better understand the classic retention calculation.
Let’s say 100 users used your app on Day 0. On the seventh day after day 0, 20 people came back. Later, 38 users returned on the 30th day.
According to the classic retention model, your retention rates for Day 7 and Day 30 are 20% and 38% respectively.
Classic retention is easy to calculate if you have day-to-day user activity data. However, it can often give a misplaced idea of user activity due to outliers on one or two days.
For example, suppose you are averaging the retention rates of multiple days to understand your day-to-day retention. In that case, these outliers can significantly increase or reduce the average value of that time period.
2. Range Retention
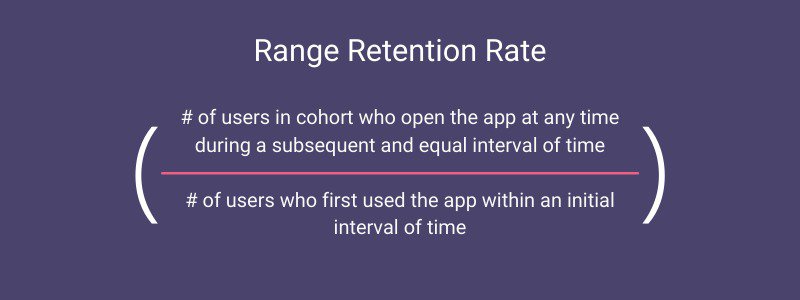
Range retention works similar to classic retention, except it involves a time frame spanning multiple days rather than a single day.
Most SaaS businesses calculating range retention rates use a 7-day or 30-day range.
After selecting a specific interval, range retention is calculated by dividing the number of customers who use the product during a time frame of that interval by the number of users who first used the app within an initial time frame of the same interval.
This might seem a bit confusing at first. Here’s a scenario to help you understand the calculation better.
Suppose you are using a 7-day interval, and users first opened your app on June 1. A total of 100 users use your app between June 1 – June 7. Then, between June 14 and June 21, a total of 55 users opened your app. Notice that both time frames have a 7-day interval.
Your range retention rate for June 14-21 is calculated as (55/100) = 55%.
Using the range retention rate makes it easier to find patterns over a longer period. It also smoothens the impact of day-to-day outliers. The key consideration here is to select the ideal range for your product and business model.
3. Rolling Retention
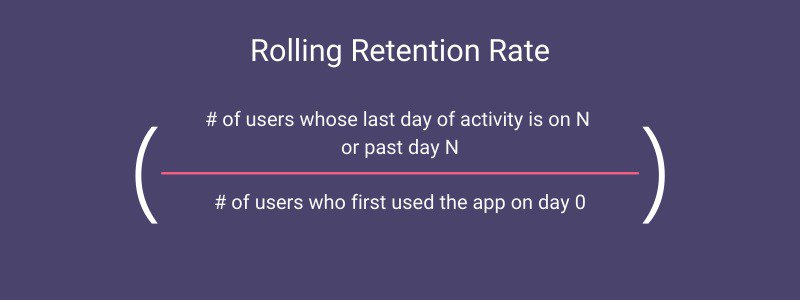
Rolling retention considers the retention of users on or after a specific day.
It’s therefore useful for gauging the long-term retention of your users.
Remember how we previously called the nth day after Day 0 Day N?
You can calculate rolling retention by dividing the number of users whose last day of activity is on or after Day N by the number of users who first used the app on Day 0.
Rolling retention is especially useful for estimating long-term retention value, as it captures whether users return at any point beyond a given milestone.
Keep in mind that each user will be counted only once, even if they come back multiple times after the Nth day.
Rolling retention rate helps you account for long-term retention based on only two data points. But it’s important to update this metric periodically as user activity grows.
Rolling retention can be quite limiting if used on its own, as it applies the same weight to the most and least active users.
Let’s go back to the scenario of having 100 users use your app on Day 0. Following Day 0, 5 users use your app on the 7th day, and 30 more users use your app in the next 10 days.
If you consider Day 7 as your Nth day, the rolling retention rate will be = (5+30)/100 or 35%.
Keep in mind that each user will be counted only once, even if they come back multiple times after the Nth day.
Rolling retention rate helps you account for long-term retention based on only two data points. But it’s important to update this metric periodically as user activity grows.
Rolling retention can be quite limiting if used on its own, as it applies the same weight to the most and least active users.
Common mistakes in calculating user retention in SaaS
Ignoring MRR retention
Monthly recurring revenue (MRR) is the monthly revenue from subscription payments. Thus, MRR retention is the revenue retained from existing customers.
User retention and MRR retention are two different but highly interrelated metrics.
While user retention gives you an idea of how many customers you retained over a specific time period, MRR retention tells you how much revenue you retained from those users.
Only calculating user retention might not be an accurate reflection of profitability from retaining users. For example, if your product is expensive, the same retention rate will generate higher profits for you compared to less expensive products.
By combining both user retention and MRR retention, you can gauge the sustainability of your business in the long run.
Assuming that canceled customers are churned customers
Canceled customers are the users who are about to stop paying you from the next payment date, and churned customers are the ones who have already stopped paying you.
It’s easy to conflate these two groups of customers. But counting canceled customers as churned customers can be a costly mistake for your SaaS business.
You are losing your opportunity to win back a possibly dissatisfied customer if you already consider a canceled customer to be a churned one. While most canceled customers have the intention of churning, others might have canceled due to reasons such as bad user experience.
It’s crucial to communicate with your canceled customers and identify the reasons for cancellation. This provides you with valuable feedback, which you can work on to create a better experience for your users and possibly bring back the canceled customer.
Bringing back one or two canceled customers a month might not sound very appealing to you. But if neglected, these numbers can add up quickly over time and prove to be very damaging for your business.
Calculating retention without considering account age
A customer who has been using your product for a month is less likely to be retained than a customer using it for more than a year. And losing that long-term customer will do more damage to your business than losing the new one.
It, therefore, doesn’t make sense to put equal weight on all customers when benchmarking retention rates.
Instead, you can segment your customers based on their account age and set different benchmarks for each of them.
Setting different benchmarks will help you adopt tailored strategies for each cohort. This is essential as customers in different stages churn for different reasons.
Measuring retention rates separately for each customer group or cohort will also help you identify the reasons behind the increase or decrease in churn rates.
Suppose you recently introduced a new onboarding process that didn’t sit well with a particular group of customers and thus increased the churn rates among new users.
Your overall retention rate will go down. But if you measured retention rates for all users at once, it would be hard for you to find the exact reason for the sudden spike in churn rates.
Calculating retention rates without considering subscription plans
Customers using different tiers of your product are likely to have different churn rates. Calculating retention rates based on the subscription tier helps you understand the cost of losing these customers.
You might experience lower churn rates for customers who use expensive plans such as the “Enterprise” tier. These plans are purchased by organizations rather than individuals and generate the highest revenue for your business. Calculating retention rates by combining enterprise users with the rest of your users can provide misleading results.
Similar to segmenting users based on customer lifetime, grouping customers based on subscription tiers will help you craft better retention strategies for all groups of customers. For example, users of low-cost tiers may not have a significant concern about data security compared to the users of enterprise tiers.
So improving your security features may help you lower churn rates for enterprise users, but it will have little to no effect on other users.
Why is calculating user retention important?
It stands to reason that companies that retain their users for longer tend to have higher rates of customer satisfaction.
But improving retention also has a tangible effect on the bottom line.
Studies have found that user acquisition will cost you 5 -25x more than user retention. If you get a mere 5% boost in user retention rates, your business can experience a boost in revenue by 25-95%.
Let’s look at an example to illustrate the value of retention. Let’s assume that:
- You spend a total of $1500 to acquire each customer.
- Your MRR is $250
In this instance, it would take 6 months to recoup the cost of acquiring the customer.
But if you can only retain your customer for 3 months, then you’ll make a net loss of $750 from that customer account.
The relationship between user retention rate and growth in SaaS
SaaS companies with low retention rates essentially deal with a leaky bucket. They pour in huge sums of money to acquire customers, and then those customers churn before the company can recover the acquisition cost.
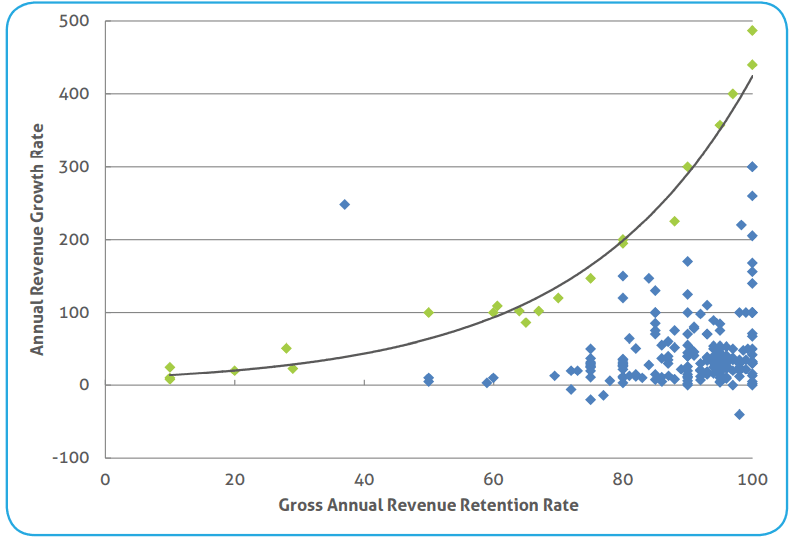
Research by SaaS Capital found a clear relationship between user retention and growth. The study established a strong link between a company’s retention rate and its ability to grow top-line revenue.
Other key takeaways from the study include:
- The relationship between retention and growth is one of causation, not just correlation.
- The great thing about growing through retention is that the effect of hanging onto customers compounds financially over time.
Of course, this doesn’t mean you need to stop acquiring new users. After all, who will you retain if you don’t have users in the first place?
The study rather calls for a greater emphasis on customer retention instead of obsessing over acquisition to achieve growth.
Final Thoughts On Retention Calculation
You can only solve a problem once you know that it exists. So your journey to improving retention rate begins with acknowledging that retention is important. Once you’ve understood that, take some time to calculate the retention rate and seek to continually improve it.
To help you streamline your retention efforts, you can find a number of all-in-one solutions on the market. One of those is Userpilot. Explore how you can improve the retention in your mobile app with Userpilot’s brand new mobile features. Get a demo and see for yourself!

