Mobile App Tracking: How to Analyze User Behavior In-App


What separates a good app from a great one? It’s not just the design, features, or marketing. It’s what you do with the behavior data your app collects.
And by behavior data, I don’t mean installs (that’s the easy part). I mean what happens after the download: how users navigate, what features they engage with, and where they drop off. All questions you can only answer with: Mobile app tracking.
This article breaks down what mobile app tracking is, why it matters, and methods to do it well. So you can better analyze in-app behavior, whether you’re an app developer, product manager, or part of a growth team looking to optimize every tap, swipe, and session.
What is mobile app tracking?
Mobile app tracking captures data on how users interact with your app, including actions such as screen views, button taps, session length, and feature usage.
For example, say a user opens your app, skips the onboarding tutorial, and heads straight to the dashboard. Only to lose interest and leave without using any key feature. With app tracking, you can see that drop-off and know exactly where and why user engagement decreased.
Why track in-app user behavior?
According to research, apps that track user behavior for data-driven insights see up to a 20% increase in conversion rates.
That kind of improvement comes from analyzing the data to see what’s happening inside your app, helping you answer critical questions like:
- Where are users dropping off or getting stuck?
- What features drive repeat usage?
- Which in-app behaviors correlate with long-term user retention?
Gathering all this information directly leads to better product decisions. Because now, you can:
- Improve onboarding by identifying friction points.
- Prioritize product updates, uncovering which features users value.
- Spot early signs of churn by identifying patterns in disengaged users.
Lastly, you can build more personalized experiences by segmenting mobile app analytics by persona or use case.
For instance, a casual user might only open the app once a week. Whereas a power user is active daily. Understanding these differences in how each segment interacts, whether it’s how often they use the app or which features they rely on, helps you tailor the in-app experience to meet each user’s needs.
What to track: Core in-app user behavior events
Not all user interactions are equally useful. So, for valuable insights, you need to track events that uncover user engagement, intent, and friction. Here’s a breakdown of such key in-app behaviors worth tracking, how to capture them, and what they tell you:
| What to track? | How to track it? | What to use it for? |
|---|---|---|
| Conversion actions | Sign-ups, purchases, form completions, plan upgrades | Evaluate the performance of monetization and activation funnels |
| Feature adoption | Feature discovery, usage frequency, milestones achieved (e.g., report generated) | Identify which features provide value and encourage repeat usage |
| Onboarding completion | Onboarding flows completed, tutorial dismissals, skipped steps | Improve time-to-value and reduce early drop-off |
| Session activity | Session frequency, duration, active days per week | Measure user stickiness and identify usage patterns |
| Navigation flows | Screen views, navigation paths, drop-off points | Spot confusing UX paths or bottlenecks in the user journey |
| Friction points | Failed actions, form/task abandons, rage clicks, repeated backtracks, app crashes | Uncover usage pain points causing user frustration or drop-offs |
5 Practical mobile app tracking methods for improved app performance
Random data points don’t explain user behavior. To actually improve your app, you need structured tracking methods that connect actions to outcomes. These five approaches help you do exactly that.
1. Map key events in the user journey
Mapping key events means identifying and tracking the specific in-app user actions that matter. Such as signing up, completing onboarding, using a core feature for the first time, or upgrading a plan.
How it helps:
Mapping structures your mobile app analytics. So you’re not tracking every tap or scroll, and instead focusing on the events that drive engagement and revenue.
Plus, with mapping, you can discover popular (and unpopular) navigation paths, inefficient flows, or unexpected journeys that predefined funnels might miss. For instance, you might see users skipping your “Import Data” flow and jumping straight to manual entry, suggesting confusion or low perceived value in the import feature.
How to use it:
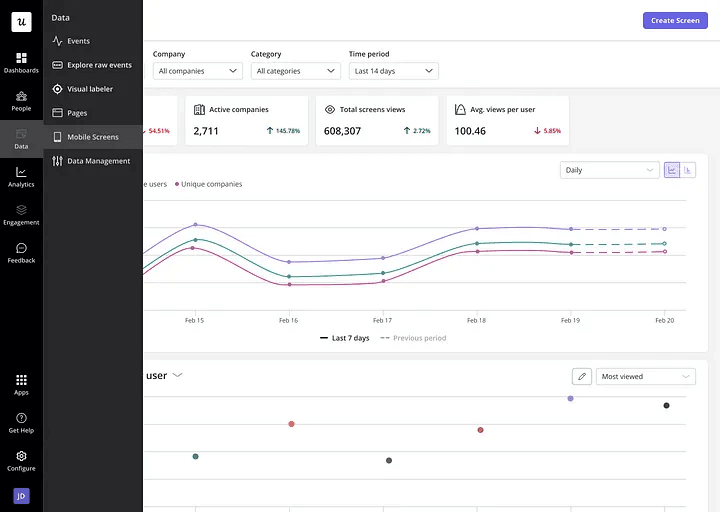
Break the complete user journey into stages: Acquisition, Onboarding, Activation, and Retention. Assign trackable events to each stage, such as “Account Created,” during the acquisition stage.
Next, use a product analytics tool to tag these events, capture event data, and visualize how many users move or drop off between each stage.
For example:
Asana, a project management tool, might track events like “Project Created” and “Project Shared.” Now, suppose a large number of users create a project but never share it. That’s a clue to revisit the sharing feature or the path leading up to it.
2. Use session replays for qualitative insights
Session replays are anonymous replays of individual user interactions with your app. So you get to see exactly what users clicked, hovered over, or hesitated on.
How it helps:
Session replays help you understand the exact user struggles that lead to frustration and drop-off.
How to use them:
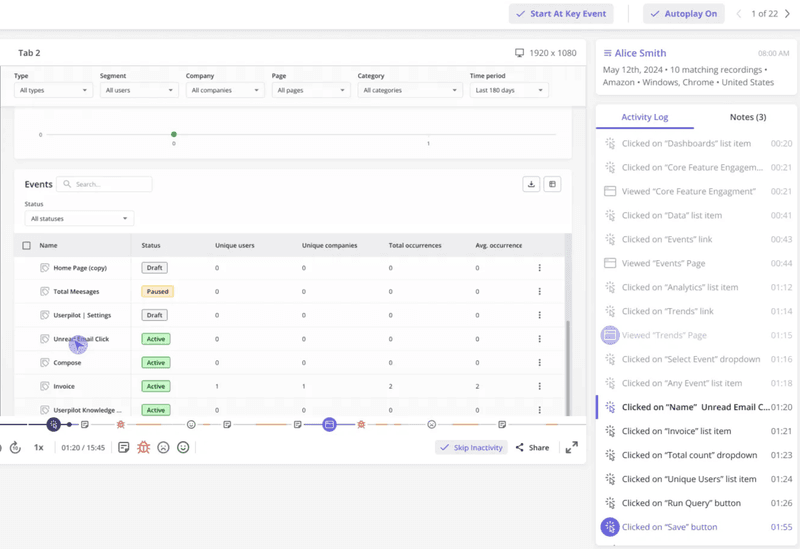
Rewatching session replays is only possible with specific platforms that offer this feature. These tools let you filter sessions by key segments, skip inactivity and jump to key moments, add notes, flag issues, and tag relevant teammates for quicker collaboration.
For example:
Suppose users are dropping off before finishing their dashboard setup. Session replays reveal they repeatedly open the setup page but don’t save their actions. Additionally, the heatmap shows low interaction with the “Save” button.
What does that tell you?
That the “Save” button isn’t visible enough, or it’s hidden away in a confusing layout.
3. Analyze funnels to identify drop-offs
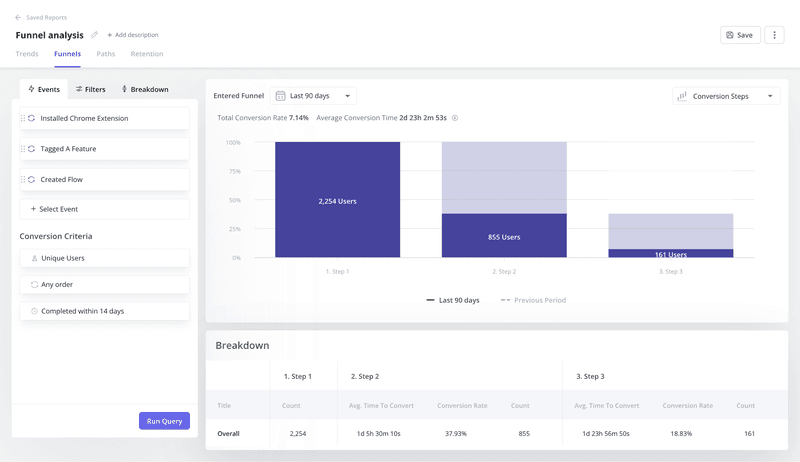
Funnels show the steps users take to complete a key action, such as onboarding, checkout, level completion, etc.
Each step is visualized with conversion and drop-off rates, helping you see where users fall off.
How it helps:
Funnels pinpoint exactly where users are leaving during critical flows. So, instead of guessing what’s wrong, you act on behavioral patterns.
How to use it:
- Pick a user flow to analyze: For example, trial-to-paid conversion.
- Set up the funnel: Define each funnel step as a specific in-app event.
- Identify main drop-off point: See which step has the biggest drop-off.
- Revisit previous steps: Analyze the steps before the drop-off stage to understand potential friction points, such as confusing UI, technical errors, or too many steps.
For example:
In a B2B SaaS mobile app, you might analyze the funnel from:
“Sign Up for Trial” → “Complete Onboarding Task 1” → “Invite Team Member” → “Upgrade to Paid Plan.”
A high drop-off rate after “Invite Team Member” might suggest the value proposition isn’t clear enough after initial engagement, or the pricing/upgrade path is confusing.
4. Use cohort analysis to track different user groups over time
Cohort analysis groups users based on shared traits and tracks their behavior and retention over time.
How it helps:
Cohort analysis shows how specific groups engage with your app. So you can measure retention, feature adoption, or conversion rates across time and compare how different user segments respond to in-app changes.
How to use it:
- Define your cohorts: Such as a group of users who signed up in January 2025 or customers who started their free trial this week.
- Track behavior over time: Measure retention for each group to see how behavior changes with time.
- Compare cohorts: This will tell you if recent app updates improved engagement or if one segment consistently performed better than others.
For example:
Suppose you rolled out a new onboarding experience in March. You compare the March cohort’s 30-day retention with the February cohort’s. If the March group shows higher retention and more feature usage after Day 7, it’s a sign that the new onboarding is working. If not, you revisit what changed and why the new experience didn’t land.
5. Segment users for targeted insights
User segmentation means dividing your user base into distinct groups based on user demographics, behavior, technology, or acquisition source.
| Segmentation criteria | Examples |
|---|---|
| Demographics | Age, location, language |
| Behavior | Power users, inactive users, feature adopters |
| Technology | Device type, operating system |
| Acquisition source | Organic search, paid ads, referrals |
How it helps:
Instead of looking at overall averages, segmentation offers more precise insights into how specific user groups interact, where they lose interest, and what features they use most.
How to use it:
Create segments based on attributes from the table above.
Once segmented, compare app performance metrics like engagement, retention, or feature usage across groups. Then, put these insights to work, personalizing in-app messages and experiences for each group.
For example:
You notice that users on Android mobile devices engage less with a new feature compared to iOS users. So you segment by operating system and discover the Android UI has layout inconsistencies. Fixing those with some tailored improvements is all you need to do to improve feature adoption.
👉 IMPORTANT: Handle mobile app tracking with privacy in mind
43% of users are unclear about what mobile app tracking involves, leading to misunderstandings and privacy concerns.
So, always disclose what you track and why. And make sure your tracking practices align with GDPR, CCPA, and Apple’s ATT framework (ATT).
How to tailor mobile app tracking analysis for different use cases and personas
Mobile apps vary in purpose. And users vary in behavior. That means the way you track and analyze data should change depending on what your app does and who it’s for, aka the app’s use case and user persona.
1. Adapt your analysis based on the app use case
Different app use cases include subscription services, on-demand platforms, social apps, marketplaces, and productivity tools. Each use case calls for a different mobile app tracking method.
For example, for an ecommerce app, the use case demands that you focus on cart additions, checkout steps, and purchase completions.
However, the same wouldn’t make sense for subscription-based apps like SaaS or media platforms. For those, you’ll monitor trial-to-paid conversion funnels to identify friction points, churn by cohort to understand retention trends, engagement with premium features to gauge perceived value, and LTV to evaluate user profitability over time.
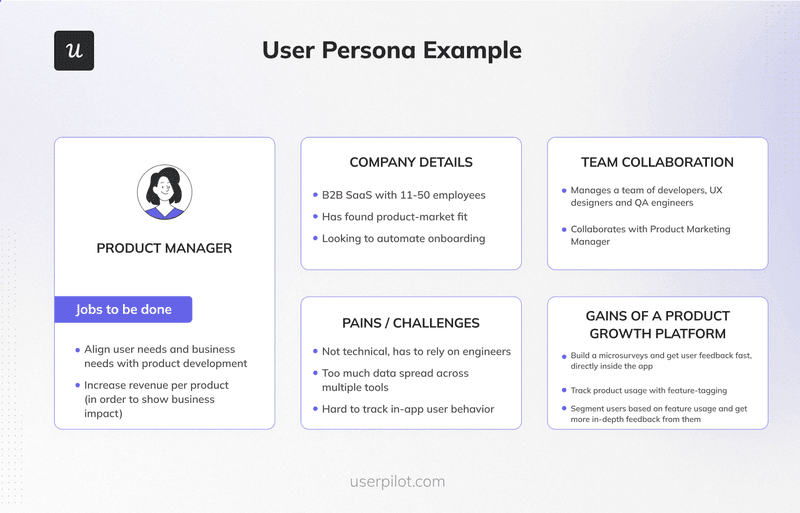
2. Adapt your analysis based on user persona
User personas represent different user goals, behaviors, challenges, and experience levels. That means each group uses your app differently, so looking at generalized metrics alone can hide important patterns.
Instead, analyze individually how each persona engages with your product to uncover more targeted insights.
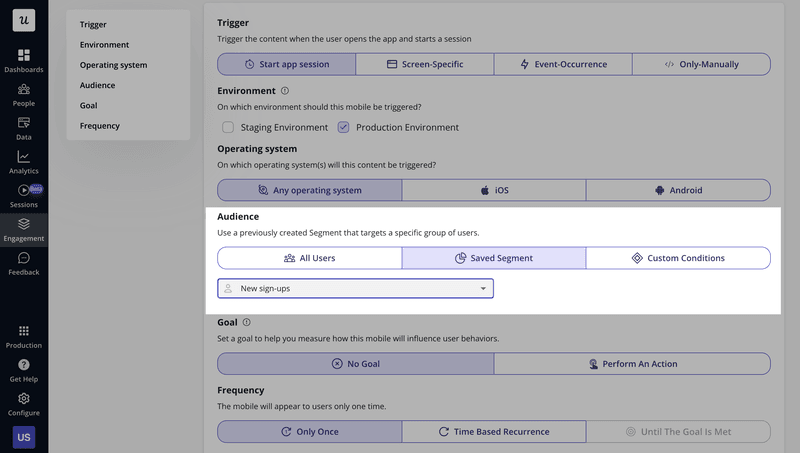
Analyze segments
For example, to build an “Active Users” segment, you can combine multiple conditions to filter for exactly the right audience. These criteria might include when the user was last seen in-app and whether they’ve completed key actions, like “Created Invoice” or “Submitted NPS.”

Compare user behavior
Next, compare behavior across segments to uncover differences in adoption rates, usage patterns, likes, dislikes, and pain points.
For instance, how does the “Power User” navigate the mobile app compared to the “New User”? Which features does each persona engage with most? Where do different personas drop off in key funnels?
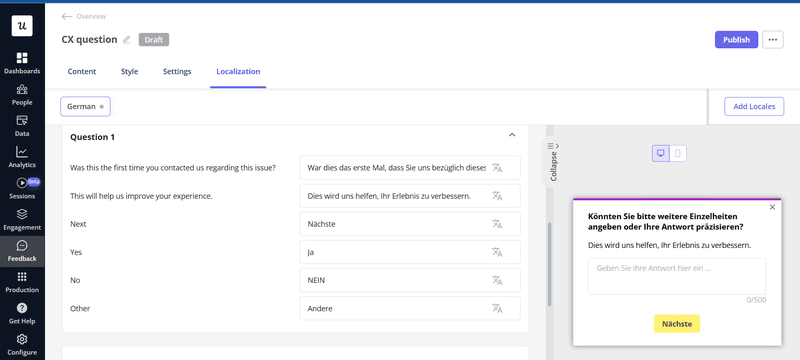
Tailor the user experience
Finally, use the above insights to personalize onboarding for new users, offer advanced features to power users, or create targeted re-engagement campaigns for lapsing personas. Additionally, take the personalization a step further by localizing for a truly native mobile app experience.
FAQ
How do apps track users?
Both iOS and Android apps track users by:
- Capturing in-app events and user interactions: Includes clicks, form submissions, in-app purchases, frequency of specific actions, etc.
- Recording session flows: Includes navigation flows between screens and user paths to identify behavior patterns, bottlenecks, and friction areas.
- Tagging users with unique IDs or attributes: Assigns users identifiers like user IDs or device IDs, and tags them with attributes based on their demographics or behavior.
Can I track anonymous users in my mobile app?
Yes, most analytics tools let you track anonymous users by assigning a unique session or device ID. This lets you monitor behavior before signup or login, without collecting personal information.
What’s the difference between event tracking and session tracking?
Event tracking captures specific user actions on your website or app. Examples include “button clicked” or “purchase completed”.
In contrast, session tracking shows the entire path a user takes during a visit, including the starting point, sequence of actions taken, time spent, and exit point.
The two shouldn’t be confused with screen tracking, which only logs which screens or pages users viewed.
About the author