Try Userpilot Now
See Why 1,000+ Teams Choose Userpilot

What are no-code analytics tools?
A no-code analytics solution refers to a platform that lets you collect, process, and analyze data without writing any code. Such tools usually offer a user-friendly visual interface with drag-and-drop functionality without the complexity of tools like Google Sheets. It helps users leverage data effectively without any coding knowledge.
They also come with pre-built templates and workflows to help you extract actionable insights from quantitative data. Additionally, modern no-code tools use machine learning algorithms to process qualitative raw data.
Best no-code data analytics tools for valuable insights
The best no-code analytics platforms have a few things in common. They come with user-friendly drag-and-drop interfaces, easy event tracking, and customizable dashboards. Most of them also let you segment your user base into different groups.
It’s now time for us to take a closer look at our picks for the best no-code data analytics solutions.
Userpilot for in-app SaaS analytics
Userpilot is an all-in-one no-code product growth platform with robust engagement and analytics capabilities.
Besides audience engagement features, Userpilot also lets you monitor and analyze in-app user behavior data. You can even track feature and product engagement data. The best part is that you can do all this without any technical know-how.
With Userpilot, you get the following no-code data analytics features:
- Event tracking – Userpilot lets you monitor user activity and engagement by creating custom events and tracking the relevant data. You can easily define various events using the drag-and-drop interface or write custom code for this purpose.
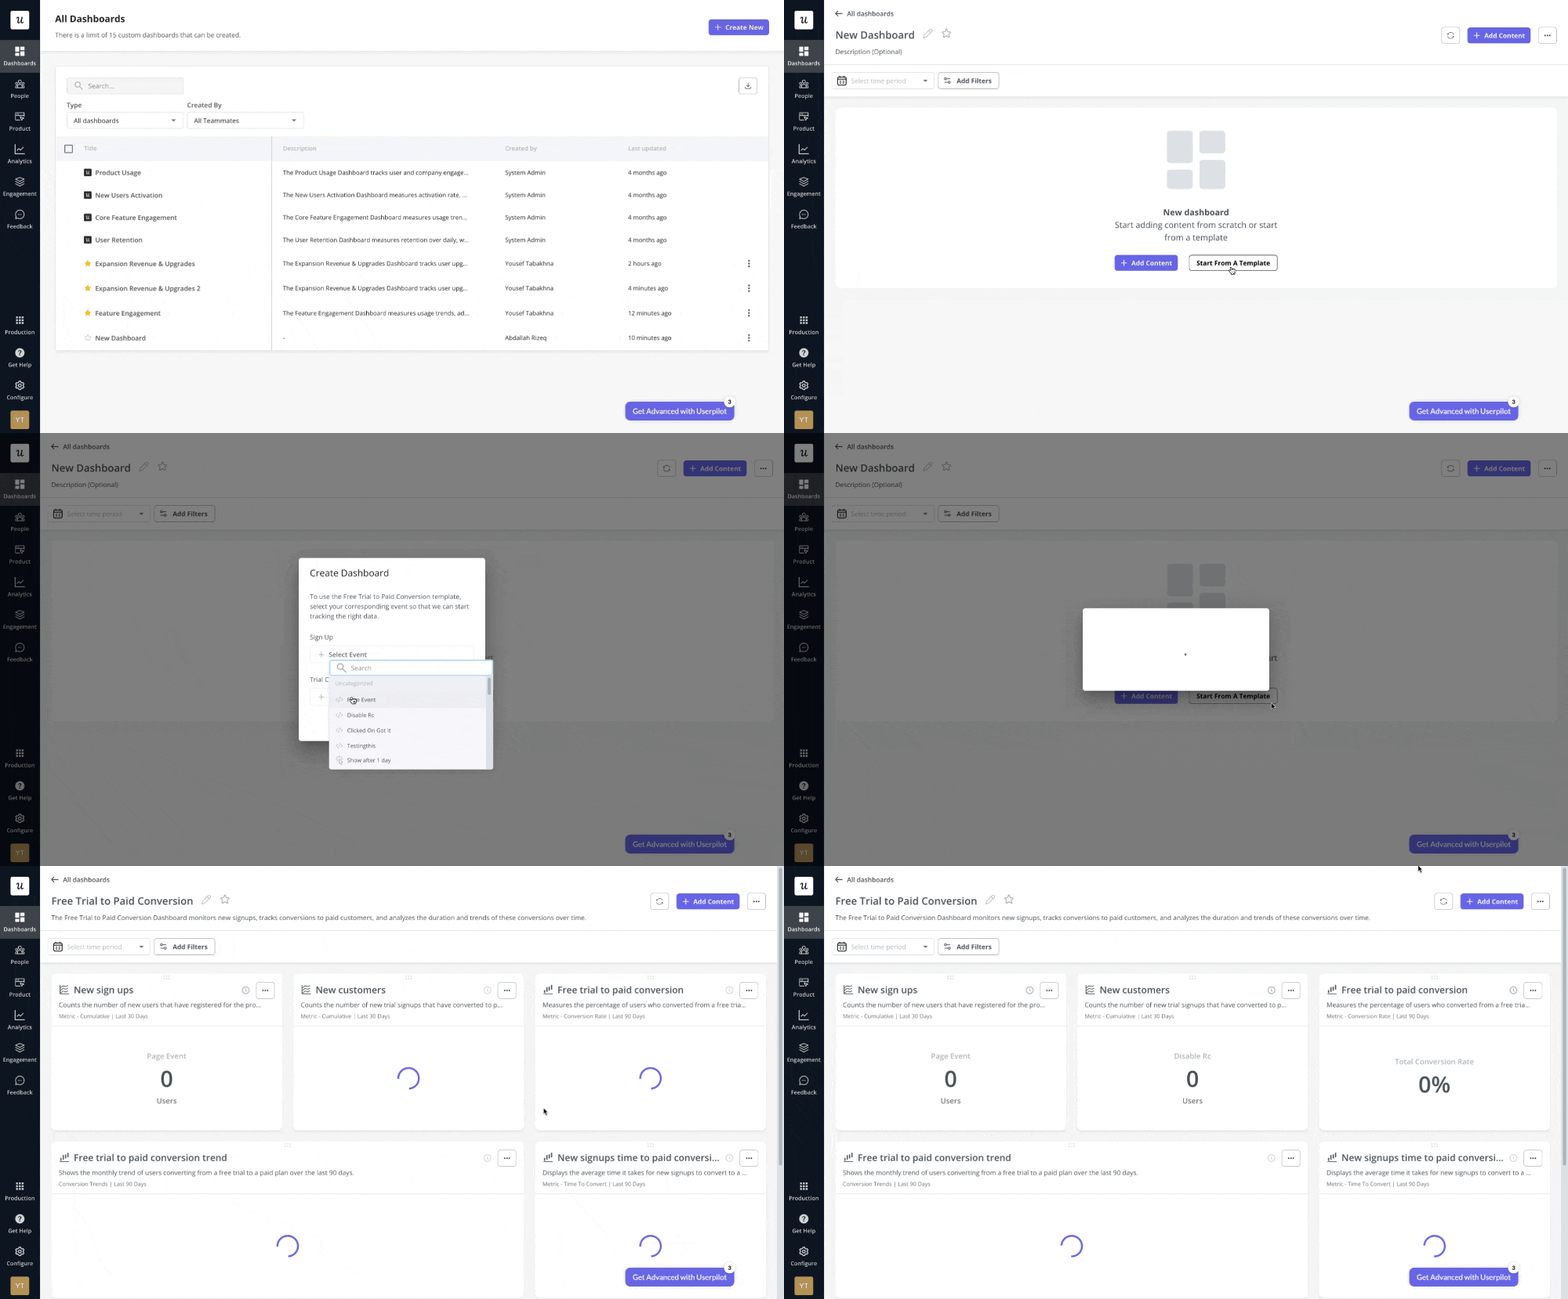
- Analytics dashboards – Userpilot provides a no-code custom analytics dashboard, which you can use to track core metrics, such as activation, adoption, retention, and conversion. You can even use various filters to refine the data on its interactive dashboards.
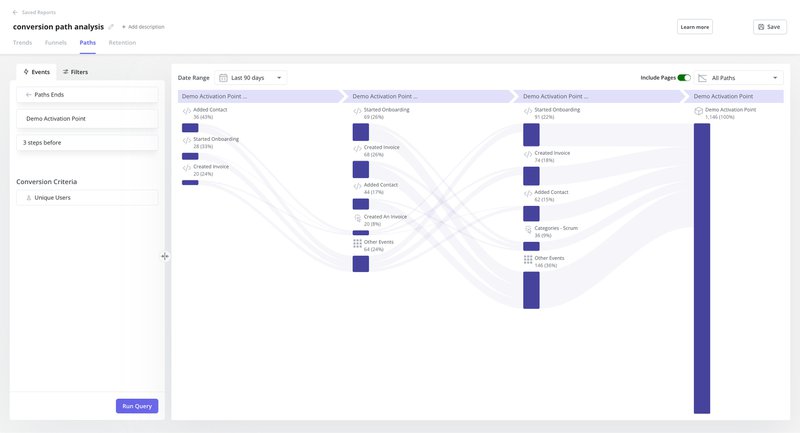
- Reports – You get several types of reports to visualize data and dig deeper into user behavior and engagement. These include funnel analysis, trend analysis, and retention tables. Also, you can use path analysis reports for a granular view of user navigation.
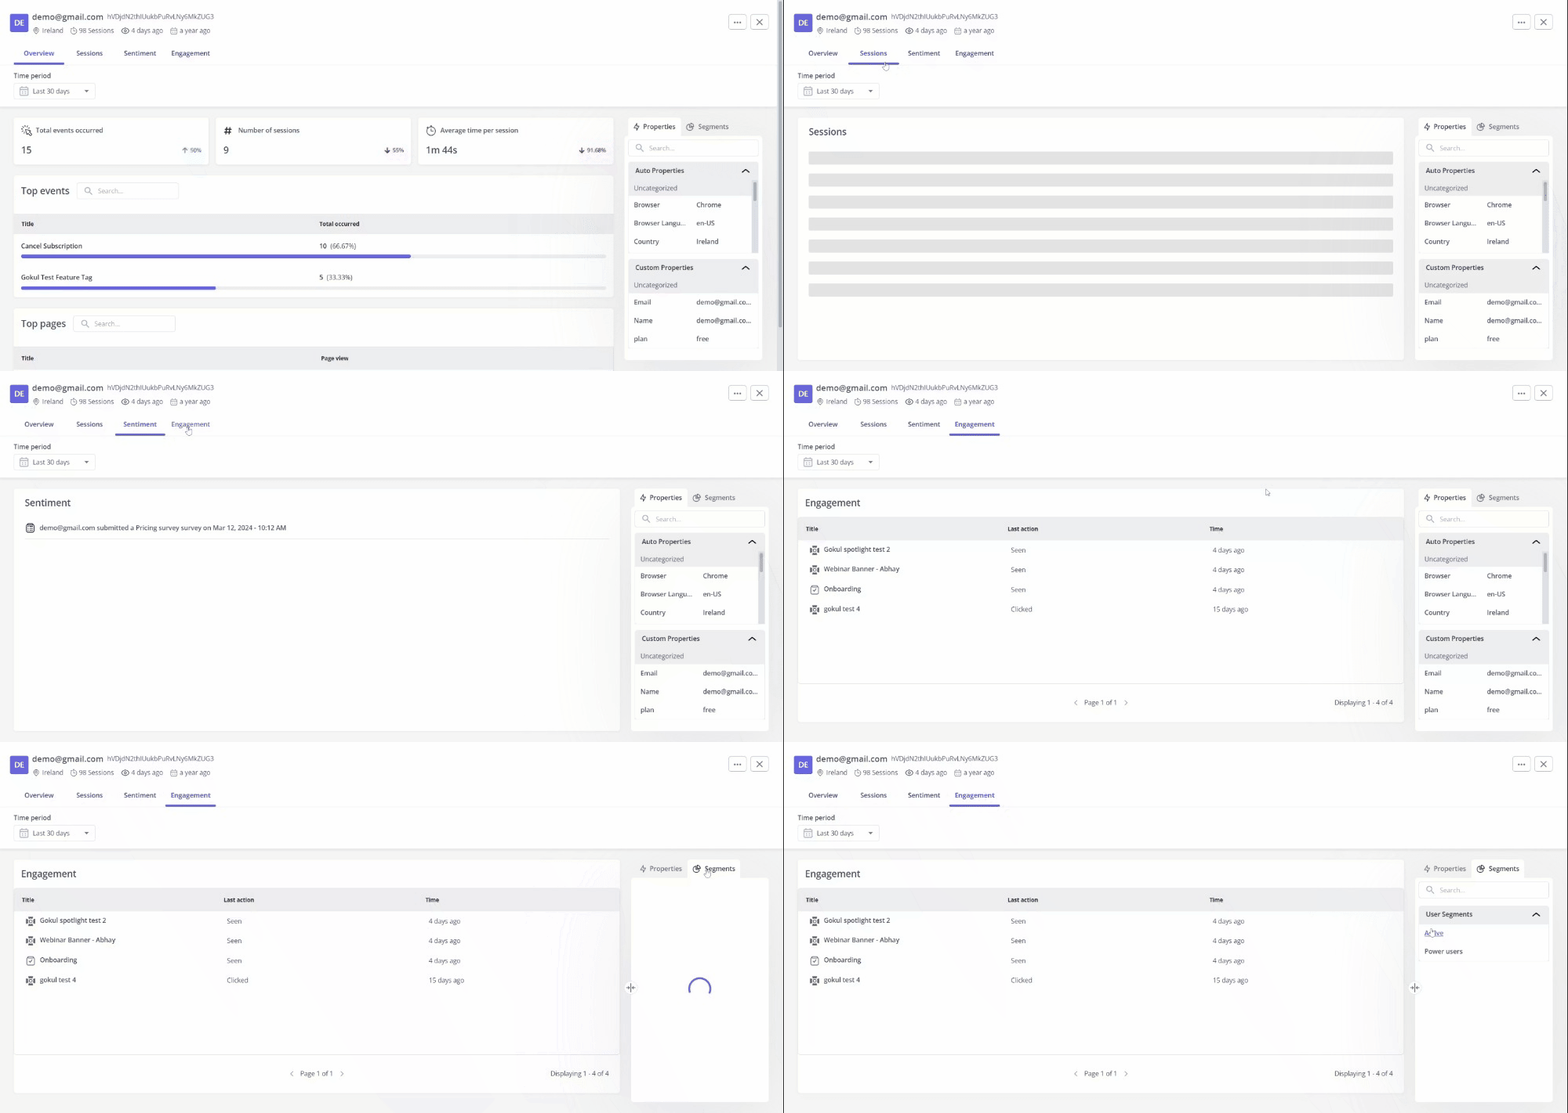
- User and company profiles – These help you drill down into user understanding at a granular level. With dedicated profiles, you can identify the most popular events, sessions, and sentiments of a specific user or company.
- Built-in analytics capabilities for other engagement features – From in-app flows and surveys to onboarding checklists, each engagement tool comes with built-in data analytics and helps visualize data. That means you can monitor how users interact with various in-app experiences and identify areas of improvement.
Pricing of Userpilot
Userpilot offers a 14-day free trial and three paid plans. These include:
- Starter – Pricing starts at $299 per month (billed annually) and allows up to 2,000 monthly active users. It includes basic data analytics features, along with user segmentation, no-code feature tags, and reporting.
- Growth – Pricing is customized and comes with advanced analytics features, including unlimited product analytics and feature tags.
- Enterprise – Pricing is available on request.
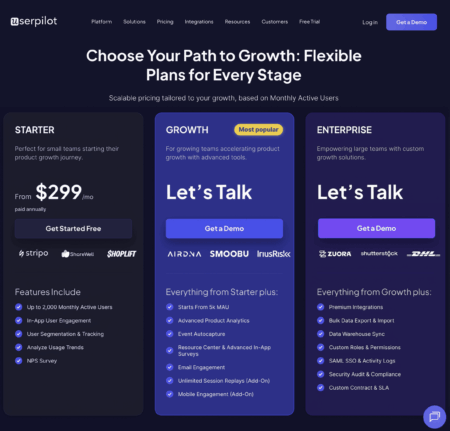
Tableau for advanced data analysis
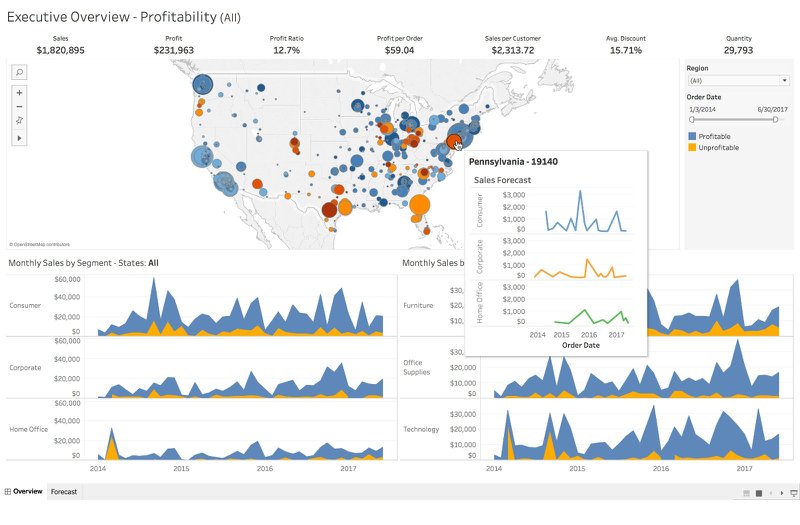
When it comes to advanced data analytics and visualization platforms, Tableau is one of the market leaders. The no-code user tracking software caters to a broad spectrum of users, from marketers and product developers to data scientists.
Tableau uses the patented VizQL technology to convert drag-and-drop actions into data queries. That makes data analysis a breeze for non-technical users.
Besides its intuitive drag-and-drop interface, Tableau offers the following no-code features:
- Smart analytics capabilities, such as instant geocoding and suggested table joins.
- A mobile app for on-the-go access.
- Several data visualization options.
- Integrates with a wide array of data sources.
- Embedded analytics for convenience and speed.
- Predictive analytics.
- Comprehensive learning resources.
Pricing of Tableau
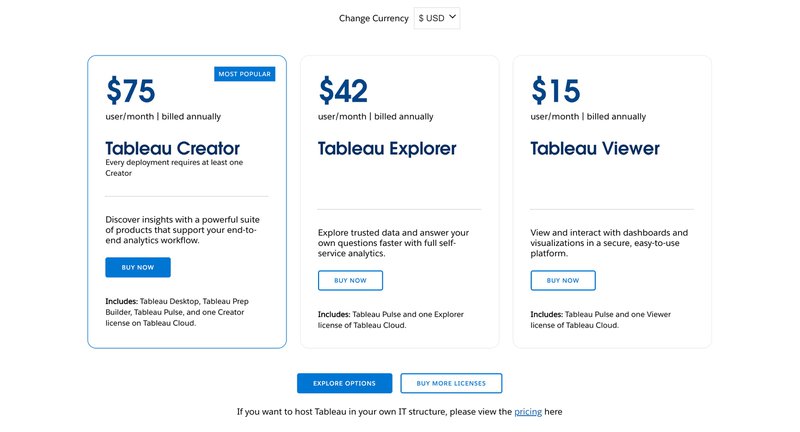
With Tableau, you get a 14-day free trial. Additionally, the data analysis platform offers three paid plans, starting at $15 per user per month and going up to $75 per user per month (billed annually). Pricing scales with the number of licenses you need.
Microsoft Power BI for data science
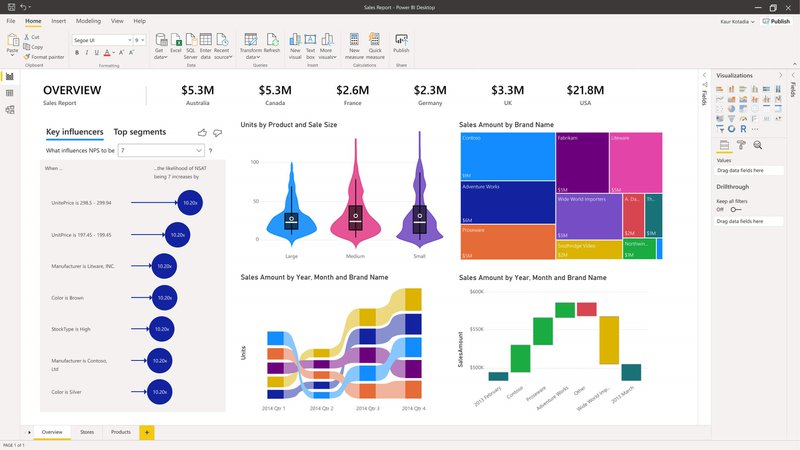
It’s a sophisticated no-code analytics and business intelligence platform that comes with a user-friendly report-creation tool and AI functionalities. It lets you collect data from multiple sources and add them to a OneLake data hub, making it a single source of truth.
The best part is that the platform integrates with the Microsoft 365 suite. That means you can seamlessly transfer insights from Power BI to these apps and make smarter, data-driven decisions.
Other distinguishing features include:
- Self-service analytics.
- Report templates and AI-generated reports.
- Free training resources.
Pricing of Microsoft Power BI
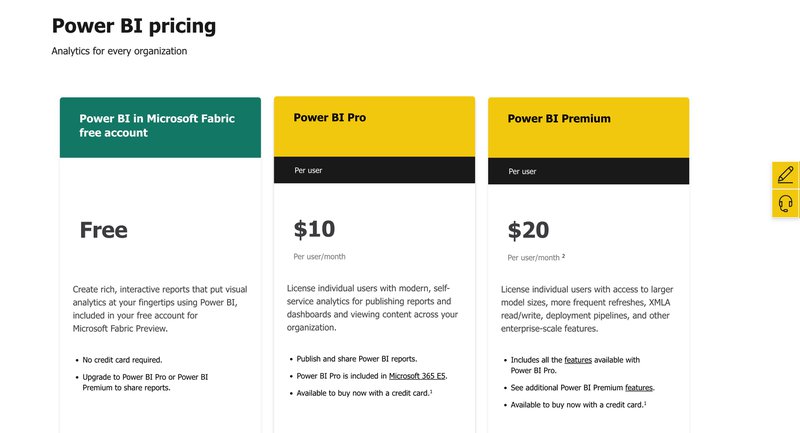
If you have a Microsoft Fabric Preview account, you can use Power BI for free to create interactive reports. Also, you can upgrade to one of the paid plans to access advanced features like self-service analytics and sharable reports.
Paid plans include:
- Power BI Pro – Pricing starts at $10 per user per month, suitable for small businesses that need basic data analytics.
- Power BI Premium – Pricing starts at $20 per user per month; suitable mid-sized and larger enterprises with complex analytics needs.
Amplitude for predictive analytics
Amplitude offers everything you’d expect from a leading no-code product analytics platform. This includes A/B testing, automated reports, custom dashboards, event tracking, and feature flags. You also get helpful behavioral analytics features, such as retention analysis, segmentation, and user journey mapping.
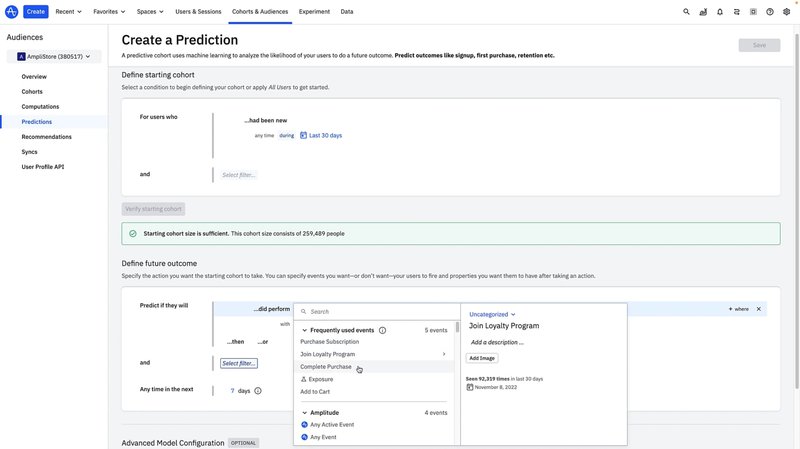
However, what sets the platform apart is its predictive analytics feature. Amplitude uses machine learning models to help you predict user actions and behavior trends. You can even group users into different cohorts based on their likelihood of completing a specific action.
With Amplitude’s predictive analytics and insights, you can personalize various aspects of your product, including content and pricing.
Pricing of Amplitude
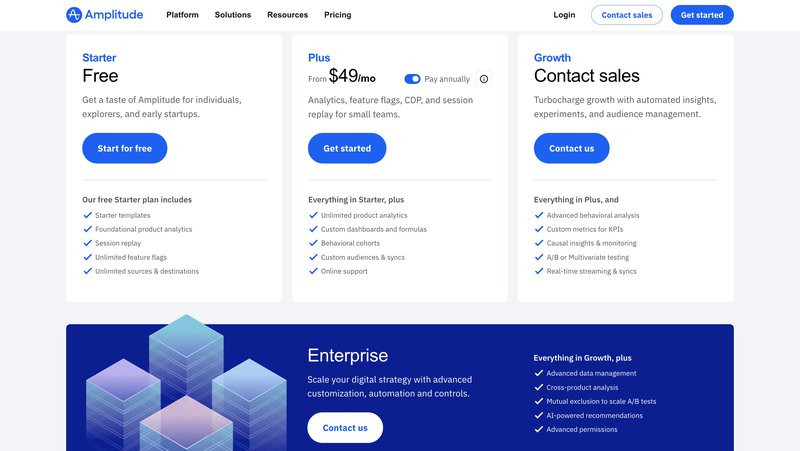
Amplitude offers a forever-free plan, which is suitable for individual users and early-stage startups. Additionally, the platform offers three paid plans, with pricing starting at $49 per month (billed annually). Pricing for the Growth and Enterprise plans is available on request.
FullStory for behavioral analytics
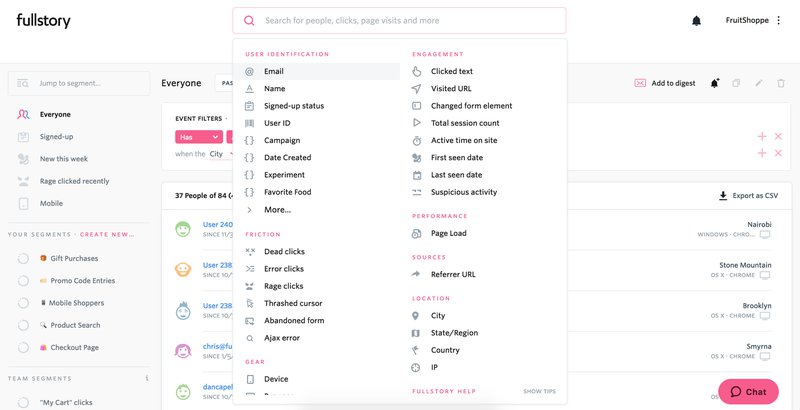
If you’re looking for a no-code data analytics tool that helps you understand the why behind user behavior, FullStory is an excellent choice. The AI-powered platform records user sessions, including clicks, page views, and other metrics, and recreates them through session replays.
That, in turn, allows you to drill down into user sentiment and understand what led to specific user actions. For instance, you can track “rage clicks,” meaning when a user clicks the mouse incessantly out of frustration.
Key no-code features include:
- Customizable dashboards with automatic notifications.
- User journey mapping.
- Retention charting.
- Conversion funnel data analysis.
- Integration with various workplace productivity tools, including Slack.
Pricing of FullStory
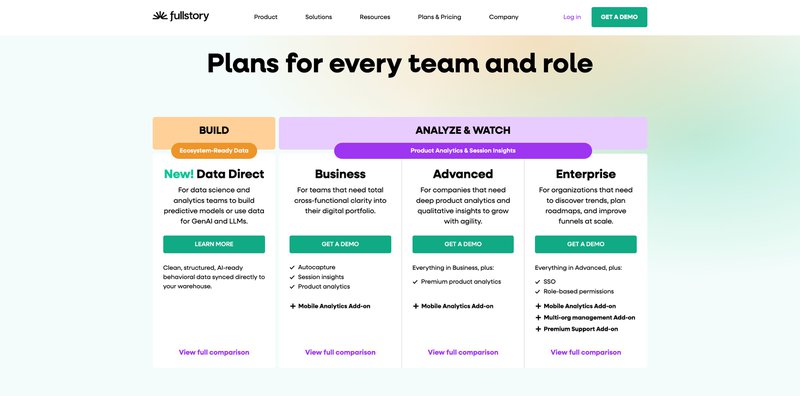
FullStory offers a 14-day free trial, which allows up to 5,000 sessions. The analytics platform comes with three paid tiers – Business, Advanced, and Enterprise. The pricing isn’t publicly available, but it’ll likely depend on the number of seats, sessions, and the duration of data history you need.
Google Analytics for traffic and engagement analytics
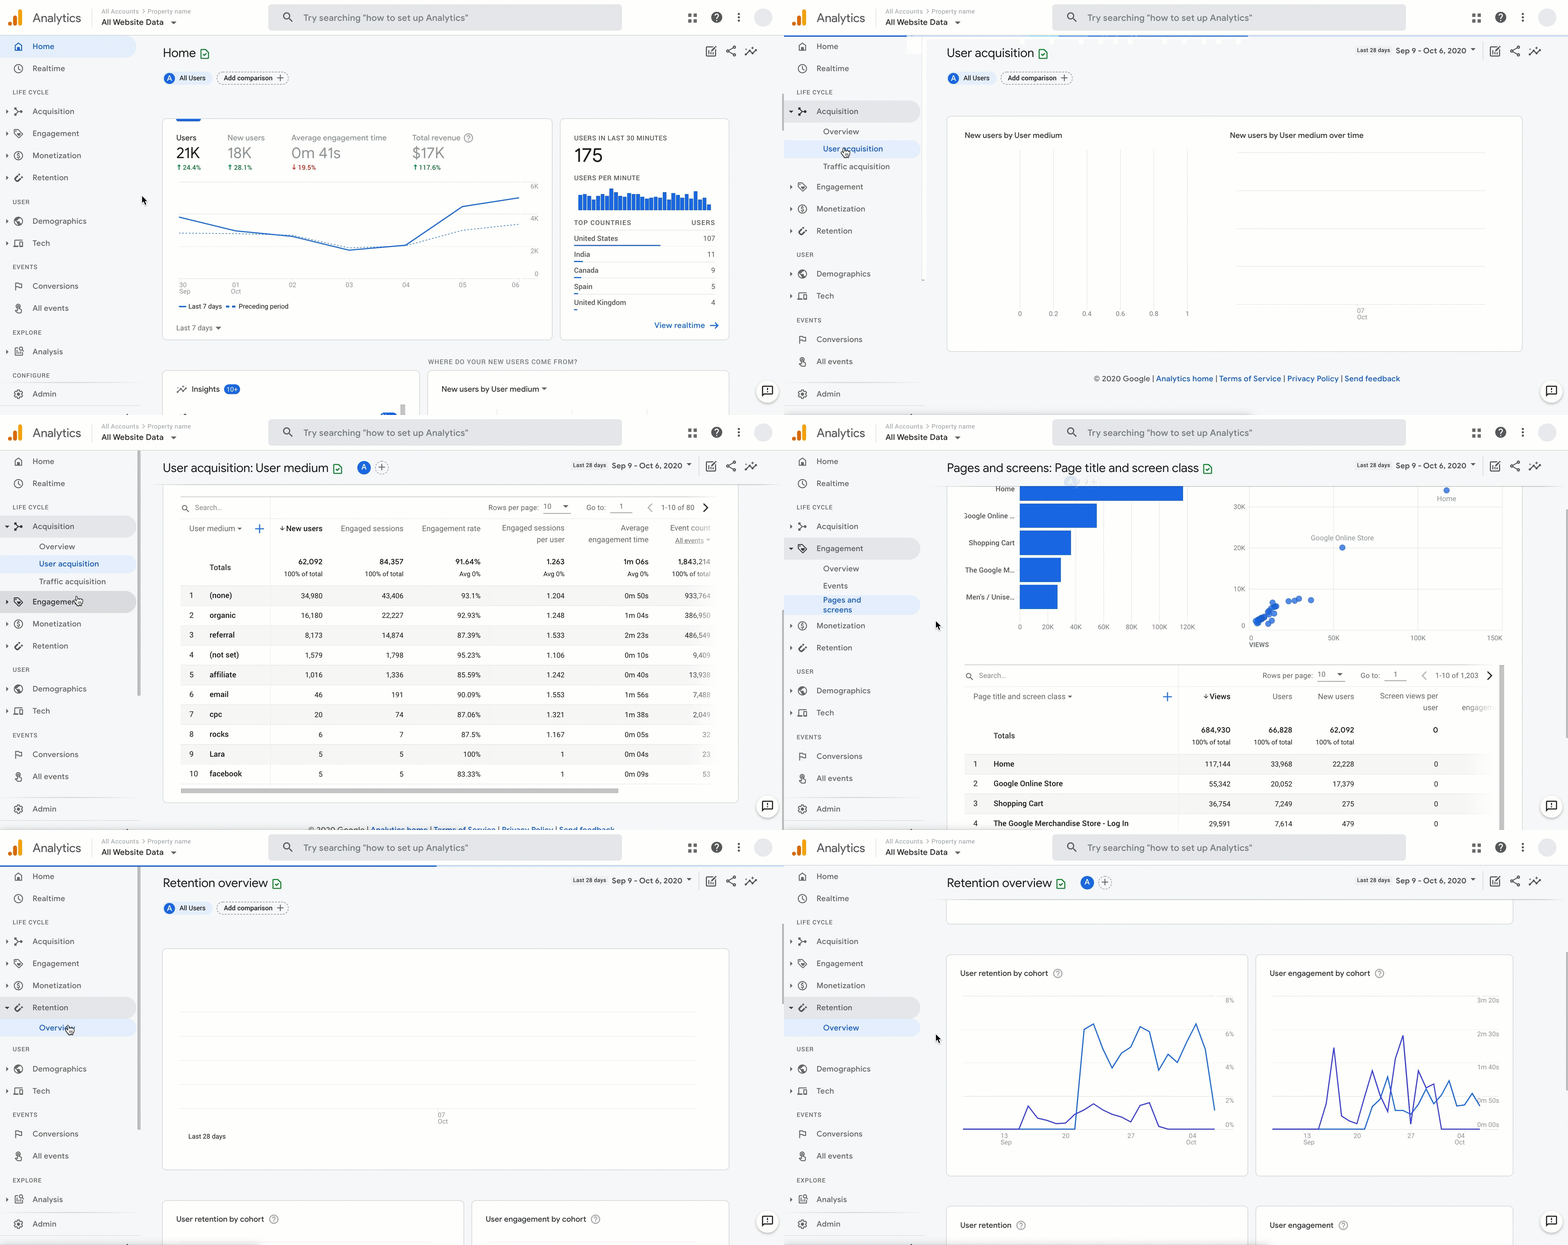
Google Analytics (GA) has been the go-to web data analysis tool for marketing teams. You can use it to monitor website traffic trends and identify top-performing acquisition channels. Plus, with Google Tag Manager, you can create and track custom events, even if you’re not well-versed in coding. GA4 even lets you set up and monitor in-app events to aid data-driven decision-making.
Key features of Google Analytics include:
- Access to first-party user behavior data.
- No-code event tracking and event filtering.
- Machine learning models that predict future user behavior.
- Real-time reporting, including acquisition and engagement reports.
- Funnel data analysis.
Pricing of Google Analytics
Google Analytics Standard is available for free. Pricing for Google Analytics 360 is available on request.
Conclusion
No-code analytics platforms are a godsend for non-technical and technical users alike. They come with a simpler learning curve and minimize the dependence on IT professionals. With no-code data analytics tools, engineering, marketing, and product teams can quickly extract actionable insights from available data and make informed decisions.
Userpilot is a comprehensive product adoption platform with user engagement and analytics capabilities. If you want to see how Userpilot can help you analyze product data and retrieve meaningful insights from it, schedule a demo today.


