
How to Measure User Experience: 12 UX Metrics That Help Build Better Products
Tom Tullis, author of Measuring the User Experience, defines UX as covering all aspects of user interactions with a product, application, or system.
But before we measure UX, it’s important to understand what it is—and what it isn’t. According to Tullis, UX has three defining characteristics:
- A user is involved.
- That user is interacting with a product, system, or anything with an interface.
- The user’s experience is of interest, observable, and measurable.
And why measure user experience? Simple: to help you improve it. According to a landmark study by Forrester, UX returns $100 for every $1 invested. That’s a stunning ROI of 9,900%.
Tullis says if people use it, you can—and should—measure its experience.
So let’s get practical.
Try Userpilot Now
See Why 1,000+ Teams Choose Userpilot

Three categories of UX metrics
To make UX measurement manageable, we’ll break it down into three straightforward categories: behavioral metrics, attitudinal metrics, and performance metrics.
| Category | Key Question |
| Behavioral Metrics | What are users actually doing in your product? |
| Attitudinal Metrics | How do users feel about your product? |
| Performance Metrics | How effectively can users achieve their goals? |
For each category, I’ll cover what the UX metrics measure, how you can measure them, and what they mean to help you improve user experience.
I. Behavioral metrics
Behavioral metrics track real actions your users take. They help you see exactly where users struggle or succeed.
1. Time on task
This metric helps you understand how long it takes a user to complete a specific task, like setting up their workspace or creating their first project. If users take too long, it might point to friction in the UI—things like vague instructions, hard-to-find settings, or too many steps just to get started.
Formula: Total time for all users / Number of users
💡 Pro tip: Track “hesitation time” before key actions as a micro-metric. When users pause for several seconds before clicking an important button or completing a form field, it often shows confusion or uncertainty. A sudden increase in hesitation time after a UI change can reveal usability issues before they affect your main metrics.
2. Average session duration
Average session duration shows how long users typically stay in your product during a single visit. Longer sessions usually suggest that people are engaged and finding value. But if users are dropping off after just a couple of minutes, they might be hitting a dead end—like unclear next steps, clunky navigation, or overwhelming interfaces.
Formula: Total session time / Total number of sessions
3. Abandonment rate
Say a user starts the process of inviting teammates or integrating with another tool but never finishes. This metric helps you identify where and why users are bailing out mid-process. It could be because of hidden CTAs, confusing copy, or a lack of progress indicators.
Formula: (Number of abandoned tasks / Total number of initiated tasks) × 100
4. User error rate
Error rate tracks how often users run into issues—maybe they’re getting stuck when setting permissions, hitting dead links, or inputting data that doesn’t work. A high error rate usually means the interface isn’t as intuitive as it should be.
Formula: (Total errors / Total attempts) × 100
II. Attitudinal metrics
While behavioral data tells you what users do, attitudinal metrics give you the emotional context behind those actions—how they feel about your product. In SaaS, they’re key for understanding user satisfaction, trust, and user loyalty—especially after key moments like onboarding, support interactions, or major feature launches.
A user might complete a task just fine but still walk away frustrated. That’s where attitudinal metrics help fill the gap.
5. Daily active users/monthly active users (DAU/MAU)
The DAU/MAU ratio measures stickiness—how often users return to your product. It’s a key indicator for SaaS companies that want to see whether their product has become a habit.
A low DAU/MAU could mean users don’t see daily value, perhaps because core features are buried, the product is slow, or the notification system isn’t pulling people back in.
Formula: Daily active users / Monthly active users
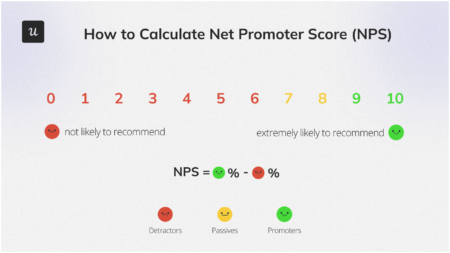
6. Net Promoter Score (NPS)
This one-question survey—”How likely are you to recommend our product to a colleague?”—gives you a quick look at how people feel about your product overall. SaaS companies often send this after milestones like completing onboarding or upgrading to a paid plan.
Formula: % of promoters (scores 9–10) – % of detractors (scores 0–6)
7. Customer satisfaction score (CSAT)
After a user chats with support or finishes a setup flow, a CSAT survey can tell you how that interaction felt. If users are consistently rating support low, it might not be the support team—maybe your product is too confusing to begin with.
Formula: (Number of satisfied responses / Total responses) × 100
8. User retention rate
This tells you how many users stick around after signing up. If your activation flow doesn’t clearly show value—like if users don’t reach the “aha!” moment quickly—your retention rate will take a hit.
Formula: ((Users at end of period – New users during period) / Users at start of period) × 100
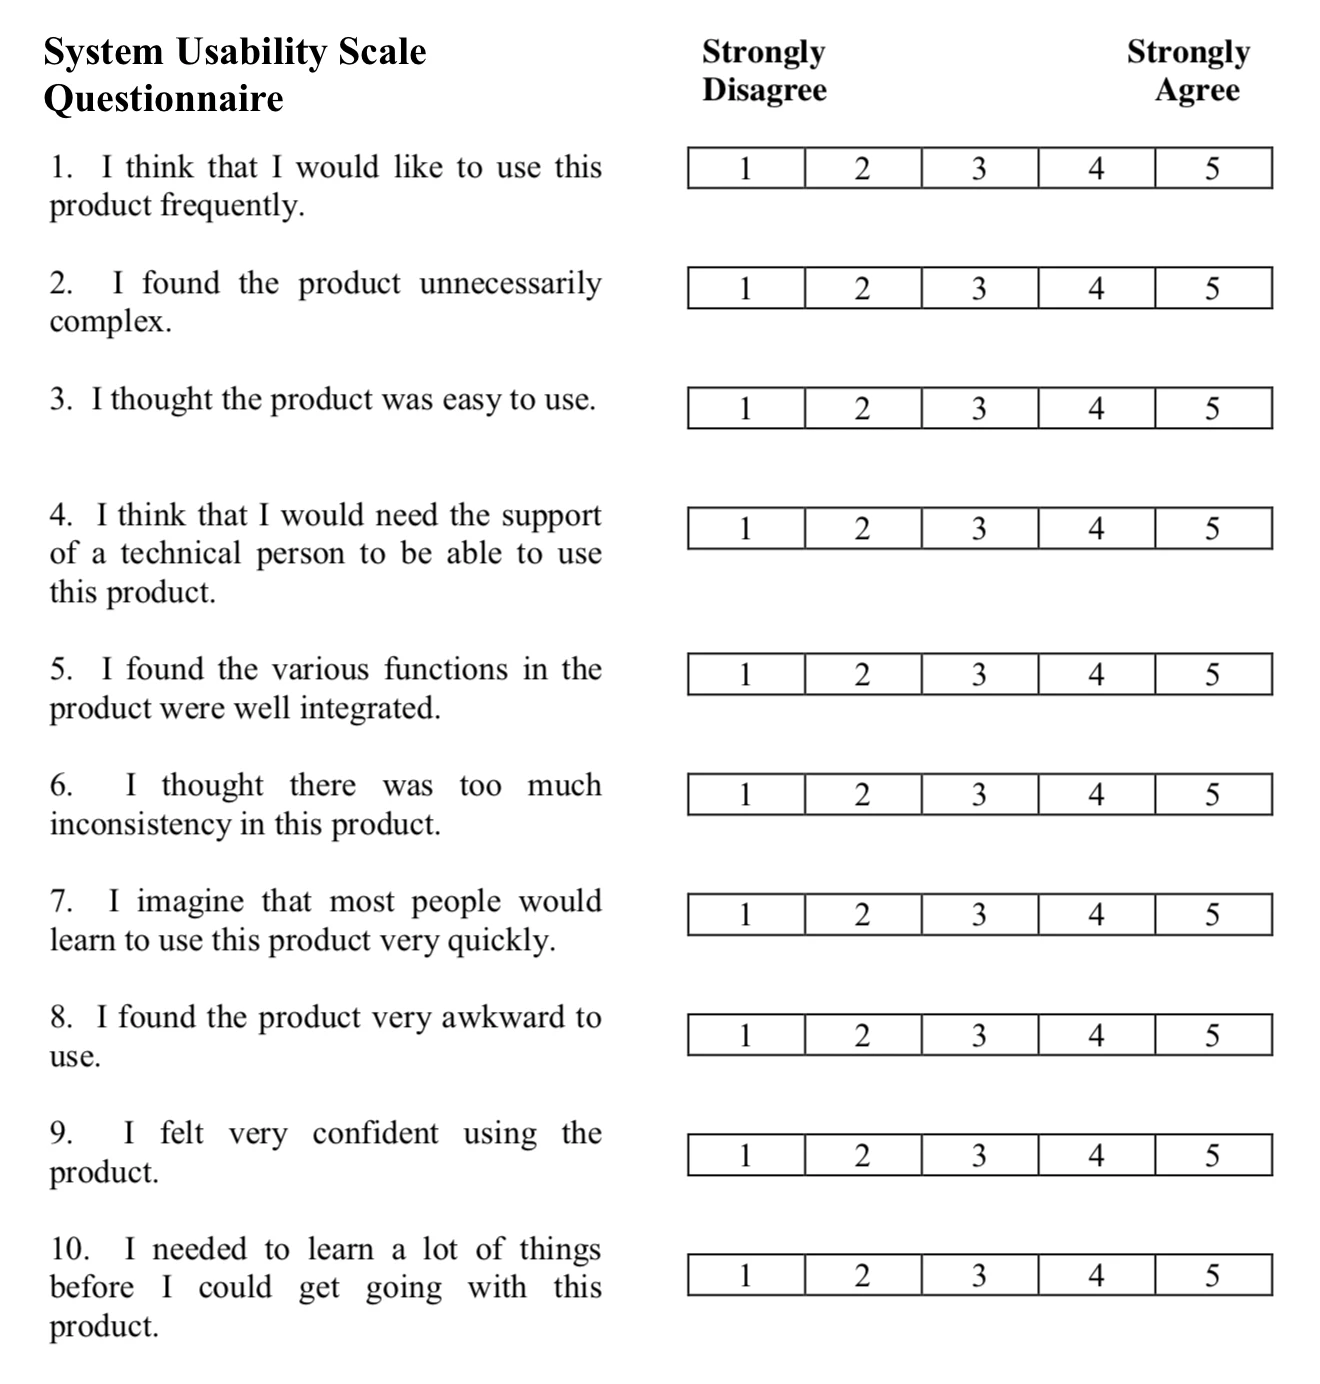
9. System usability scale (SUS)
SUS is a simple, standardized questionnaire used to measure how easy your product is to use. It’s sent out after a usability test and gives you a quick read on perceived usability. The scale always uses the same 10 questions, each answered on a 1 to 5 scale—where 1 means “strongly disagree” and 5 means “strongly agree.”
A few sample questions include:
- I think I would like to use this system frequently.
- I found the system unnecessarily complex.
- I needed to learn a lot of things before I could get going with this system.
The average SUS score is 68. Higher scores mean better usability.
Formula: (Sum of adjusted scores × 2.5) — results in a score from 0 to 100.
III. Performance metrics
Performance metrics show whether your product helps people get things done. They combine speed, success, and ease of use. If your feature looks great in a demo but frustrates users in practice, this is where you’ll see the cracks.
10. Task success rate (TSR)
Are your users able to complete key workflows? Like publishing a post, setting up billing, or launching a campaign? If success rates are low, there’s likely a disconnect between your UX design and what users expect.
Formula: (Number of successful completions / Total attempts) × 100
💡 Quick tip: Task completion rate and task success rate are often used interchangeably, but they’re not the same.
- Task completion rate tracks whether users finished a task—no matter how.
- Task success rate focuses on whether they did it correctly, without help or errors.
11. Efficiency
Efficiency combines speed and success. In a dashboard tool, for example, it could measure how quickly and easily someone can build and share a report. If it’s taking too long, maybe the layout is cluttered or the controls aren’t where people expect them.
Formula: Task success rate / Average time on task
12. Learnability
Learnability measures how quickly a new user can get comfortable. If someone can sign up, get oriented, and take action without needing to chat with support or read help documentation, you’re doing something right.
Vamsi Batchu, in his article for the UX Collective, advises product designers to use “affordances”:
Affordances are visual cues that suggest how something can be used. Think of a button that looks clickable or a handle that suggests pulling.

Learnability doesn’t have a strict, universal formula like some other UX metrics, but here’s a practical way to calculate it in a SaaS context:
Formula: (Time to complete task on first attempt – Time to complete same task on later attempt) / Time on first attempt × 100
Your 3-step guide to measure UX success
You don’t need to measure everything—just what matters for your product. Here’s how to turn your UX metrics into meaningful progress.
Step 1: Start with why (and what you’ll measure)
Start by defining your goal. Do you want to improve onboarding? Increase engagement? Reduce churn? Your goals will help you pick the right UX metrics—and the right KPIs to match.
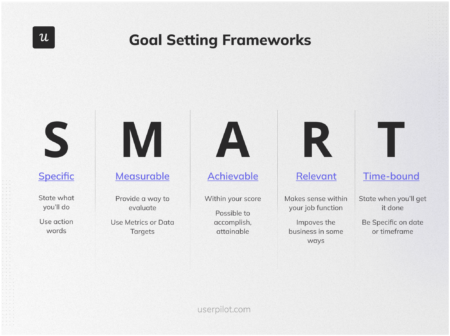
A helpful way to align your goals is by using a framework like SMART (Specific, Measurable, Achievable, Relevant, and Time-bound). That way, you know exactly what success looks like.
Here are four moments that are perfect for measuring UX:
1. During onboarding
This is your first impression. Track how quickly users activate, whether they complete key tasks, and how confident they feel early on.
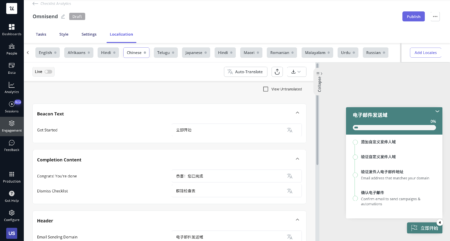
Userpilot can help you trigger in-app surveys right after onboarding flows, so you get immediate feedback while the experience is still fresh. Take it a step further and build no-code progress checklists to gamify the onboarding flow for a frictionless customer experience. And with our powerful localization feature, make your product feel like home for your users.
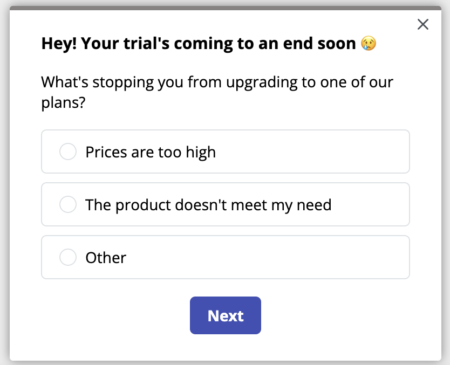
2. Before the trial ends
This is when users decide whether to commit. Look at usage patterns, feature adoption, and satisfaction levels. A well-timed in-app survey can surface what’s working—and what’s not.
With Userpilot, you can automate surveys or launch timely nudges based on user behavior as trials wind down.
3. After users engage with a feature
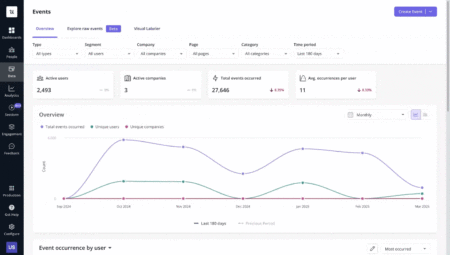
Want to know if a feature adds value? Measure it. Track how often it’s used, how easy it is to use, and what users think of it right after interaction.
Userpilot lets you tag features, trigger surveys immediately after use, and analyze adoption patterns over time.
4. After support interactions
Support experiences affect product perception. Use CSAT or NPS surveys post-support to see how helpful and efficient your team is—and whether the issue got resolved.

You can launch these feedback requests automatically with Userpilot based on support events or help center visits.
Step 2: Choose the right tool for the job
Once you know what to track, choose a tool that’s built for SaaS. Ideally, you want something that covers product analytics, user feedback, and real-time insights—all in one place.
Userpilot is purpose-built for this. It lets you track DAUs, feature usage, NPS scores, and even drill into individual user behavior—all without writing code.
Plus, with session replay-powered analytics, you can go beyond the numbers: spot drop-offs in usage, jump into a replay, and see the exact friction points—skipping inactivity and jumping to key user moments.

Here are a few other options SaaS teams often use:
- Google Analytics: Good for tracking page-level behavior.
- Mixpanel: Great for cross-platform product usage.
- Amplitude: Real-time insights into user behavior.
Step 3: Close the loop
UX is never “done.”
Now that you’re tracking the right things, the real work begins. Look at what the data tells you. Where are users dropping off? What features get ignored? Which touchpoints lead to churn?
Use that insight to make informed changes. Then track again. This feedback loop is where user experience optimization really happens.
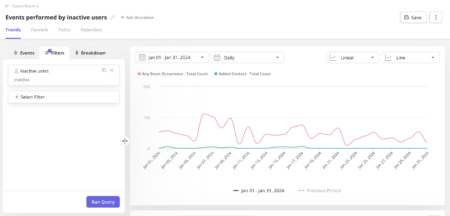
With Userpilot, you can visualize these patterns instantly through trend reports and custom event tagging—so you know what’s working and what needs attention.
Measure what matters, improve what’s measured
The best products feel invisible. Users don’t notice good UX—they just get things done.
Your metrics should reveal this invisibility at work. When task times drop, when errors vanish, when users accomplish more while clicking less—that’s the quiet success of great design.
Ready to make your product quietly brilliant? Userpilot helps you measure and improve what matters.
FAQ
What is a UX metric?
A UX metric (user experience metric) is a specific, measurable indicator that reflects how users interact with a product or service and how they perceive its overall quality. These metrics capture different aspects of the user experience, such as efficiency, satisfaction, and ease of use, so that teams can track improvements (or identify problems) over time.
How to measure user experience of a website?
Use Google Analytics to track bounce rate, session duration, and conversion rate. Analyze heatmaps, session replays, and conduct usability testing. Gather user feedback through UX surveys like CSAT, NPS, and SUS.
How do you test user experience?
Combine these methods and iterate on the results:
Usability testing: Observe real users completing tasks. This can be moderated (facilitator-led) or unmoderated (self-guided).
A/B testing: Compare two versions of a feature to see which performs better on metrics like click-through or completion rates.
Surveys and questionnaires: Use tools like System Usability Scale (SUS) or Net Promoter Score (NPS) to measure perceived usability and satisfaction.
Interviews and focus groups: Dive deeper into user needs and pain points by talking directly with participants.
Analytics and behavioral data: Track how users navigate your product and where they drop off. Heatmaps and session recordings can reveal friction points.
Contextual inquiry: Study users in their natural environment to uncover real-world usage patterns and challenges.


![What are Release Notes? Definition, Best Practices & Examples [+ Release Note Template] cover](https://blog-static.userpilot.com/blog/wp-content/uploads/2026/02/what-are-release-notes-definition-best-practices-examples-release-note-template_1b727da8d60969c39acdb09f617eb616_2000-1024x670.png)
