What Is The Number of Sessions Per User Metric + How To Track It


The number of sessions per user metric is key to understanding user behavior and user satisfaction with your platform.
This article shows you:
- Easy ways to track this metric using Userpilot and GA4.
- Best practices to improve product engagement.
- Sessions per user benchmarks and what to aim for.
What is the number of sessions per user metric (short summary)
- The number of sessions per user shows how often a single user engages with your website or app within a given period. A new session begins when the user returns after an initial experience or if the session times out while the user spends time on the platform without engaging.
- Insights from tracking sessions per user help you measure user engagement, understand usage patterns, prioritize high-engagement features, and increase retention.
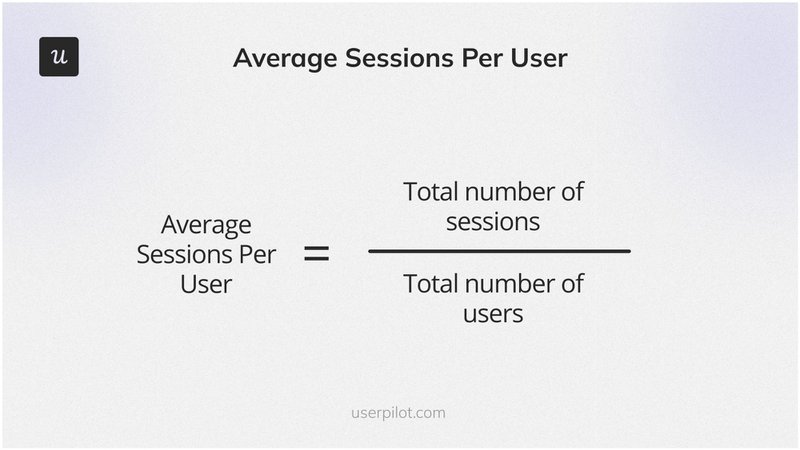
- The formula for calculating the number of sessions per user is the total number of sessions divided by the total number of users.
- The average number of sessions per user is 1.4. However, this varies depending on your audience and industry.
Popular tools for tracking the number of sessions per user metric:
Best practices to improve your average sessions:
- Implement proactive support to provide personalized content and reduce user drop-offs.
- Help users troubleshoot issues quickly with a resource center.
- Identify and remove friction with funnel analytics.
Ready to start tracking the number of sessions per user for your tool? Book a Userpilot demo now.
What is the number of sessions per user?
The number of sessions per user measures the average number of times a user interacts with your website or app within a specific timeframe. A new session begins if the user logs out or becomes inactive after a while.
It’s an important metric in website traffic and app usage analysis, helping you understand user engagement better.
Benefits of tracking sessions per user
If you’re wondering why you should bother tracking how often a user visits your platform, here are three important benefits:
- Measure user engagement levels: User engagement is a critical indicator of how valuable and enjoyable users find your platform. A higher number of sessions per user suggests that your app or website is compelling enough to bring users back.
- Prioritize high-engagement features: By analyzing sessions, you can identify which features drive the most engagement. This enables you to prioritize feature development efforts, focusing on what will deliver the greatest user satisfaction.
- Increase retention: Analyzing session data alongside other metrics helps you identify the reasons for churn. You can then use this insight to inform your retention strategies.
How do you calculate average sessions per user?
To calculate the average sessions per user, divide the total number of sessions by the total number of users during the same period. The formula looks like this:
For example, if an app had 1,000 sessions in a month and 500 unique users, the number of sessions per user would be 2.
Measure this metric regularly to keep track of user behavior. For example, if you rolled out a new social sharing feature, measure this metric alongside feature usage data to see if users are returning more frequently and actively using the feature.
A sustained increase in sessions after the launch could indicate higher product adoption.
What is a good sessions per user benchmark?
According to research by Littledata, the average number of sessions per user is 1.4. Based on this, the study deduced that:
- A good number of sessions per user is anything above 1.6.
- A bad number of sessions per user is anything below 1.2.
Keep in mind, though, that these stats are for websites (Littledata analyzed nearly 6,000 websites). The results will vary for in-product experiences and between industries.
For example, productivity tools naturally have a higher number of sessions per user than less frequently used products like tax filing software.
So, the best approach is to continue tracking your user sessions (along with other analytical metrics) and aim to exceed your averages.
How to track the number of user sessions in popular analytics tools
It’s almost impossible to track user sessions without using a specialized tool. Here’s how to use Userpilot and Google Analytics for easy tracking.
Userpilot
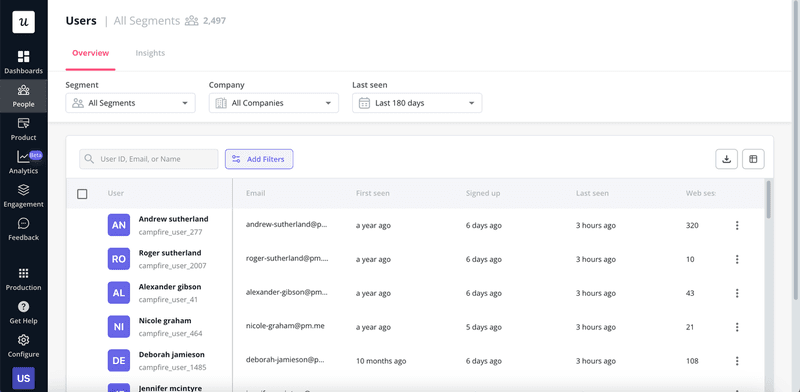
1. Head to the People section in Userpilot and click on “Users.”
2. This opens the User Dashboard, where you can view the usage sessions for different user segments. You can also apply filters to narrow the dashboard results.
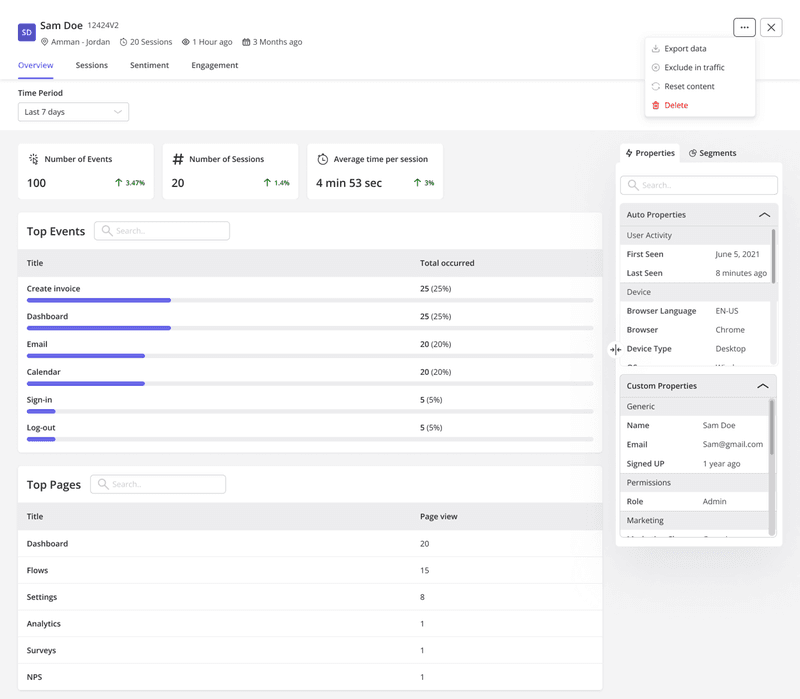
3. Click on individual profiles to get deeper insights. This action will open a page like the one below, showing the number of in-app events, session count, and the average session duration.
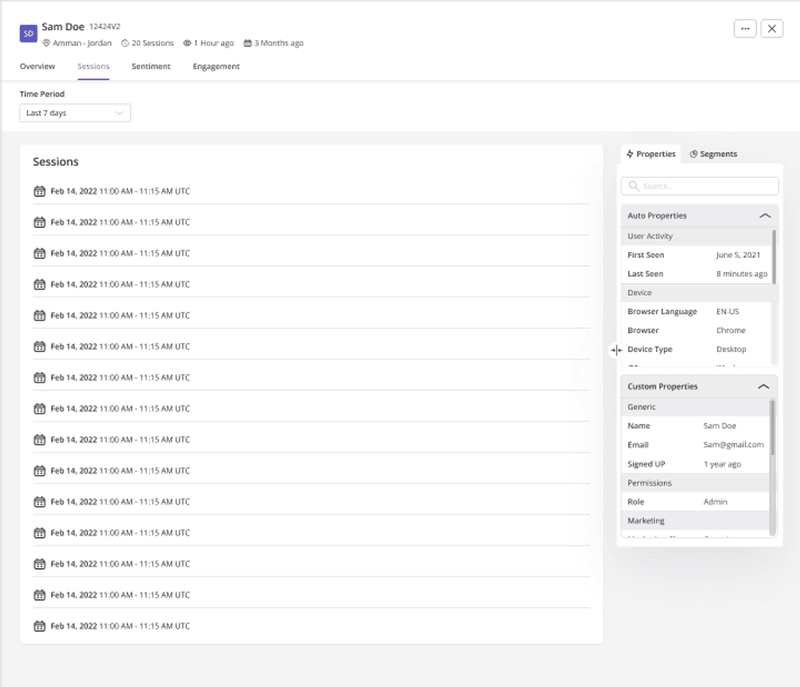
4. Click on the sessions tab to view details for each session.
You can also utilize Userpilot’s product usage dashboard to track core metrics like user trends and the average session duration, giving you better insights into user behavior.
How to do it: Click on Dashboards from the side-bar navigation menu and choose Product Usage Dashboard. You should see a page that looks like this.
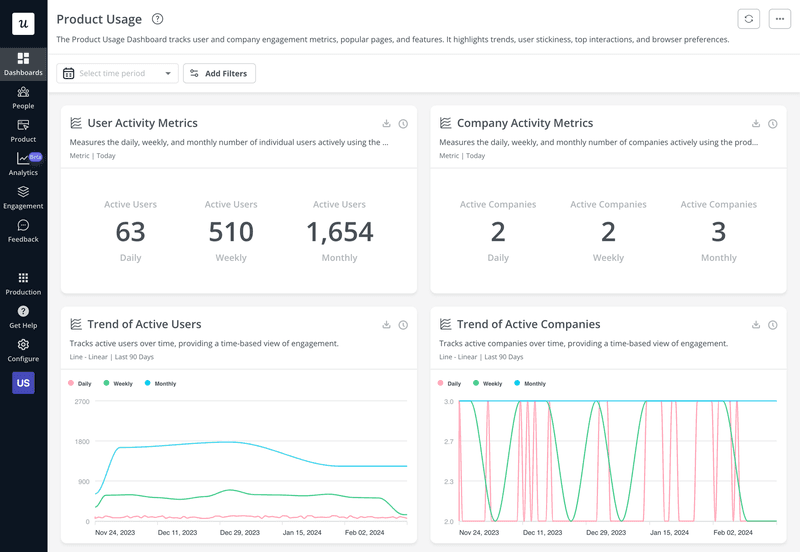
Worried that the dashboard doesn’t cover some metrics you need to track? Userpilot lets you create custom dashboards and include all the metrics and user behavior reports relevant to you.
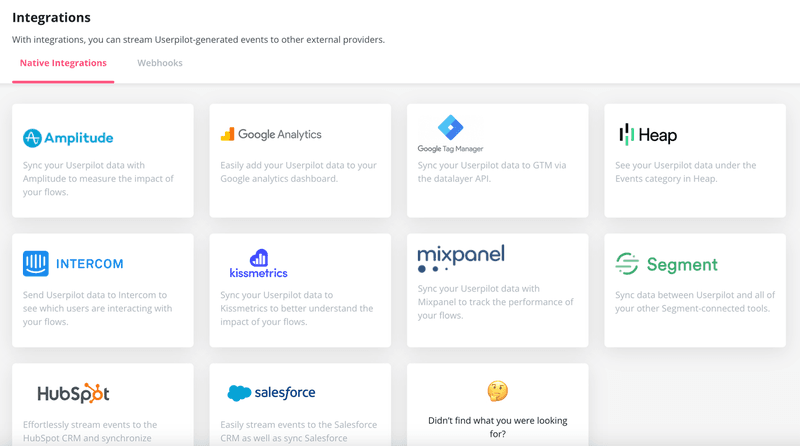
In addition, you can use integrations to access cross-platform analytics.
Google Analytics 4
Follow these steps to track the number of sessions per user with Google Analytics 4.
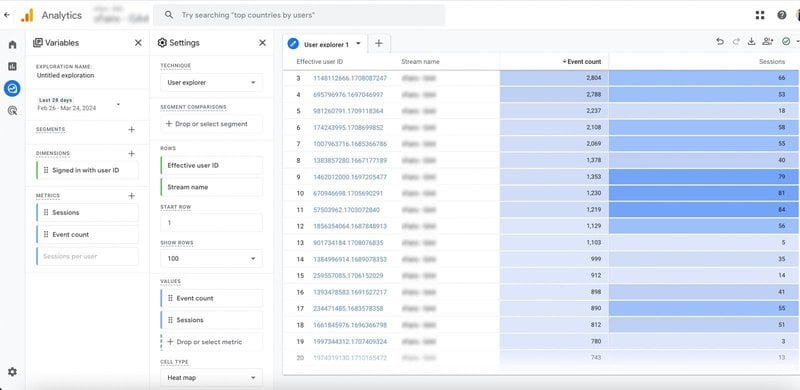
1. Create a new analysis: To begin your performance reporting, navigate to the “Explore” section in your Google Analytics interface and select the “Blank” template to start a new custom analysis.
2. Configure dimensions and metrics: Select “User Explorer” as the Technique. Choose ‘Effective User ID’ as the dimension to identify your users individually. Then, select ‘Sessions’ as the metric to measure how many times each user has interacted with your platform.
3. Build your report: In the workspace provided, you’ll see areas designated for Rows and Values. Drag the user ID dimension to the Rows field. This action lists each user ID separately. Next, drag the Sessions metric to the Values field. This step is crucial as it aligns the number of sessions directly next to each user ID, providing a clear and organized view of user engagement across your platform.
For more insights, you can pair your Google Analytics reports with user data from other performance reporting software.
Best practices to improve the average number of sessions
Implement the following best practices to improve product engagement and boost the number of sessions per user.
Use proactive support to reduce user drop-offs
Use data analysis to identify where users might face problems as they interact with your product.
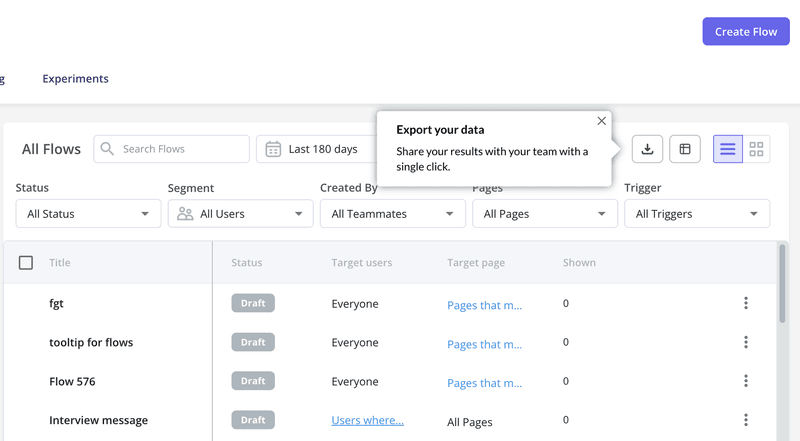
Then, implement in-app communication like tooltips to provide proactive guidance and smoothen the user journey.
For example, consider the image below. Some users might not notice the export button until the contextual tooltip draws their attention to it.
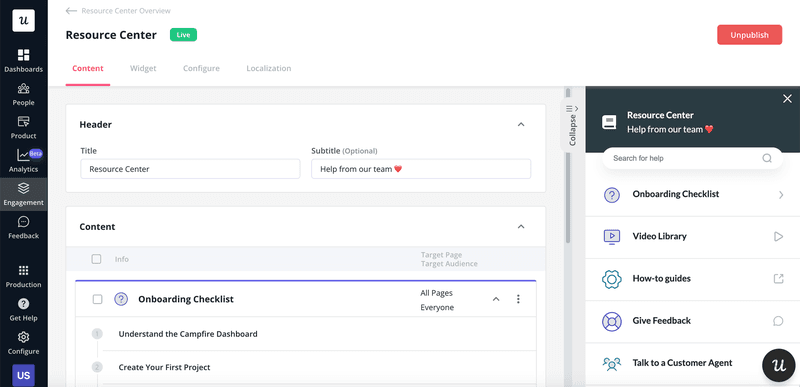
Help users troubleshoot issues quickly with a resource center
A resource center helps troubleshoot basic issues and reduces the need to abandon a session in frustration.
This also frees up time for your customer support team to attend to more serious customer problems.
How to make your resource center rich? Include different content formats—FAQs, knowledge base articles, and video tutorials. Arrange the content in a way that makes it easy for users to find solutions.
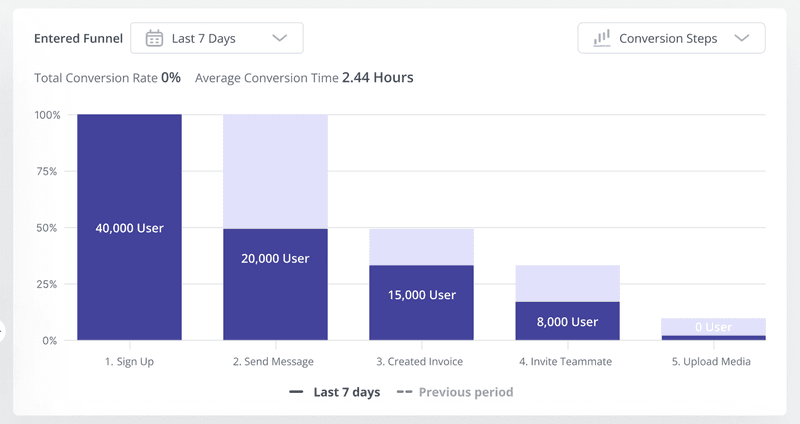
Identify and remove friction with funnel analytics
Funnel analytics track the user journey through various stages of interaction with your platform. By analyzing funnel data, you can identify where users are dropping off or experiencing friction.
Understanding these pain points enables you to make targeted improvements, reducing barriers to engagement and encouraging more frequent sessions.
Conclusion
Customer behavior on your website and app says a lot about how engaging your platform is.
By tracking the number of sessions per user, you can keep tabs on changing behavior and deploy solutions to boost engagement and retention.
Want to access powerful user analytics and behavioral data for your tool? Book a demo now and see how Userpilot analytics helps you build a data-driven product.
About the author