Top 10 Customer Analytics Platforms for Product and Growth Teams


Are you struggling to make sense of scattered user data? The right customer analytics platform helps you uncover exactly how customers interact with your product: so you can spot issues early, optimize user journeys, and drive sustainable growth.
With a reliable analytics solution, you won’t miss critical signals or overlook game-changing insights that could increase product adoption.
To help you make the right choice, I’ve gone through ten leading customer analytics platforms based on their strengths, features, pricing, and user reviews. Choose the best fit for your needs and transform data into actionable strategies.

My shortlist of best customer analytics platforms
Before we go into more depth, here’s my list of the customer analytics tools and their best strengths:
- Pendo: The best software for product-led insights.
- Userpilot: The best all-in-one platform for customer analytics.
- Mixpanel: The best cross-platform customer analytics software.
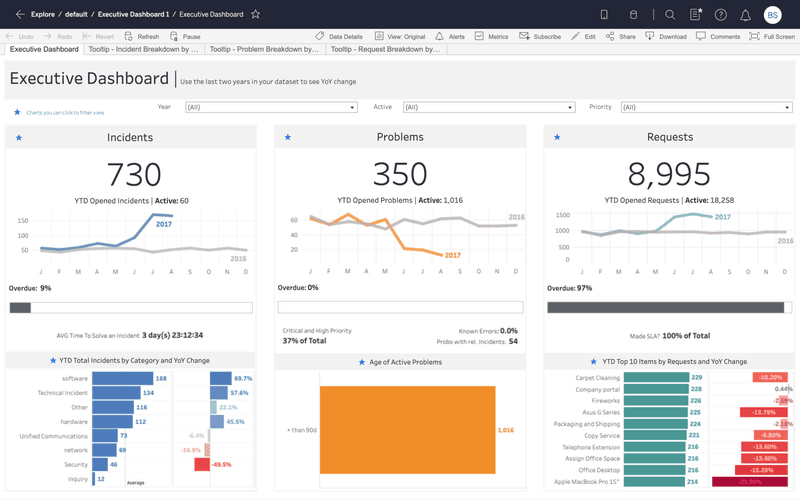
- Tableau: The best data points visualization software.
- Google Analytics: The best website analytics software.
- Hotjar: The best customer analytics software for heatmap data.
- UXCam: The best tool for mobile customer insights.
- Qualtrics: The best software for omnichannel experience management.
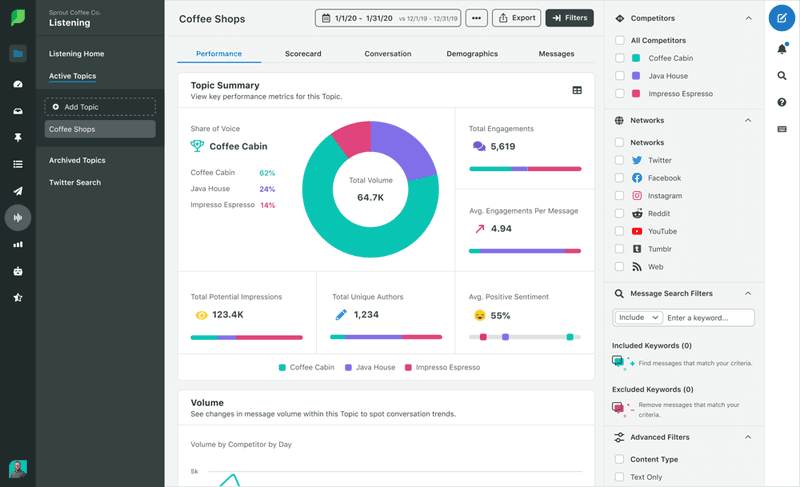
- Sprout Social: Best tools for tracking customer behavior across socials.
- InMoment: The best AI-based customer feedback analytics software.
Factors I consider when evaluating customer analytics tools
Important core features
- Analytics dashboards: Provide real-time visualizations of key performance indicators (like active users and page views) at a glance, so you can easily track changes.
- Data visualization reports: Summarize user interactions in visual data like clear, interactive charts to see user patterns, spot trends, and highlight areas for improvement.
- Integrations: Provide seamless data flow with tools like CRM or marketing software.
Usability features to look for
- Ease of use: Choose a tool that’s straightforward to learn and navigate. This cuts down on the onboarding time so your entire team can start gathering insights quickly.
- Customizability: Look for a platform that allows you to rearrange dashboards and create reports tailored to your goals. That way, you can focus on the most important metrics without wading through irrelevant data.
- Customer support quality: Go for solutions that provide responsive help channels—like live chat, resource libraries, and detailed documentation—so you can troubleshoot issues fast and maintain a smooth workflow.
Features that make a platform stand out
- Complementary tools: Such as the ability to launch in-app messages or product experiments, let you act on insights without juggling extra software.
- Scalability: Ensure the platform can handle increasing data volume and user activity without slowing down.
- Artificial intelligence (AI) capabilities: Like predictive modeling or sentiment analysis, can help you uncover hidden patterns in your customer data.
Top 10 customer analytics platforms with detailed reviews
Even though each platform here offers excellent customer analytics features, they’re not one-size-fits-all.
Some focus on advanced visual dashboards, while others excel at behavioral insights or social listening.
1. Pendo
Best for: Robust in-app guidance and data-driven product decisions
G2 rating: 4.4/5 ⭐
Pendo is a customer analytics platform that helps cross-functional teams analyze user behavior and refine product experiences.
Key features
- Analytics: Retroactive tagging, funnels, paths, cohort reports, and session replays.
- In-app guidance: Tooltips, banners, and modals that reduce friction and improve onboarding.
- AI-powered features: Leverages AI to handle tasks like analyzing trends faster and gaining data-driven insights from customer behavior.
Pricing
Pendo can be pricey and somewhat unpredictable. You’ll also need to request a quote for each plan.
- Base: Entry-level features include custom monthly active users, product analytics, in-app guides, and one integration.
- Core: Builds on Base with session replays for deeper behavioral insights.
- Pulse: Includes everything in Core plus NPS tracking and product discovery tools to optimize your roadmap.
- Ultimate: Adds advanced in-app guidance, journey orchestration, and data synchronization for enterprise-scale needs.
Customer reviews
💪 Strengths
Many users praise Pendo’s customizable in-app guides, easy video embedding, and robust segmentation features.
💡 What could be better
A user noted that there’s a learning curve. Pendo requires your customer data to be structured in a very particular way, which can become cumbersome if you have a large user base.
2. Userpilot
Best for: Best all-in-one customer analytics platform
G2 rating: 4.6/5 ⭐
Userpilot merges quantitative metrics with qualitative insights to give you a 360-degree view of user behavior. This tool allows you to track and analyze user activity, then, immediately act on your findings through in-app engagements. Instead of juggling multiple tools, you can capture customer data, understand what it means, and deploy targeted experiences from one interface. It’s designed for web and mobile apps.
Key features
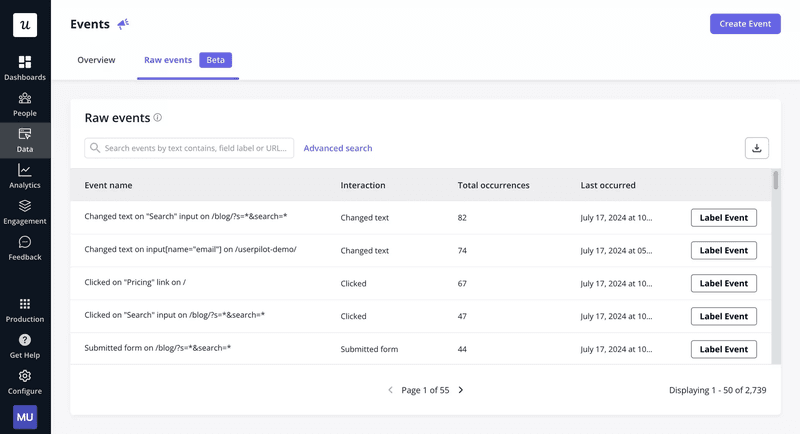
- Autocapture: Automatically tracks user events (like clicks, page visits, and form submissions), so you don’t have to do it manually.
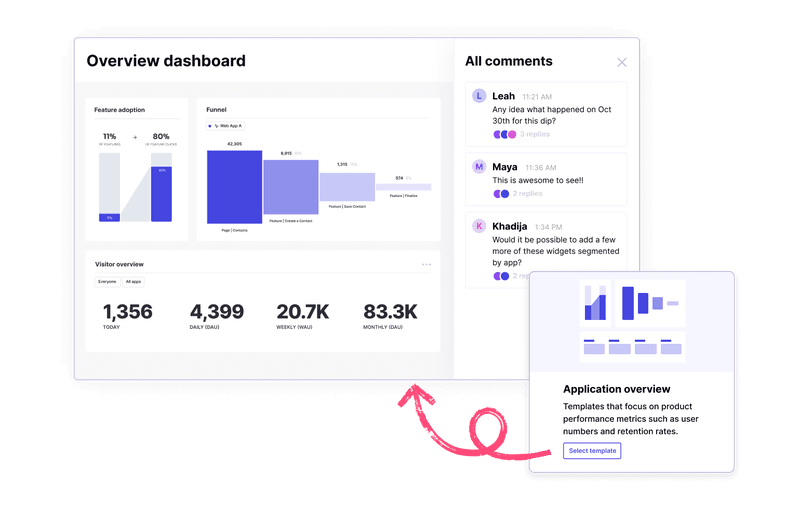
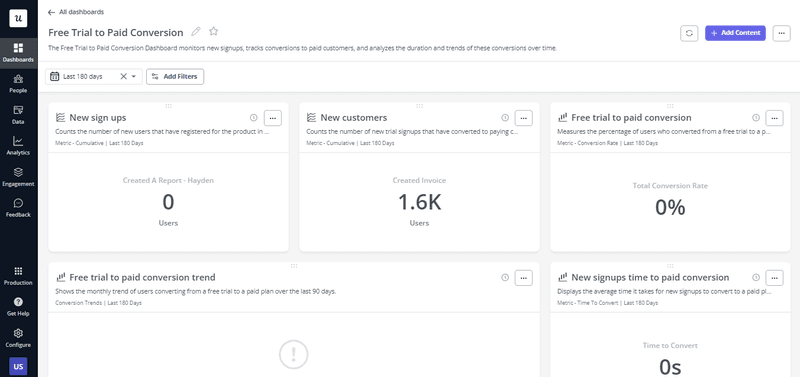
- Analytics dashboards (premade + custom): The tool provides ready-made dashboards for instant insights, plus the option to create custom dashboards tailored to your specific KPIs.
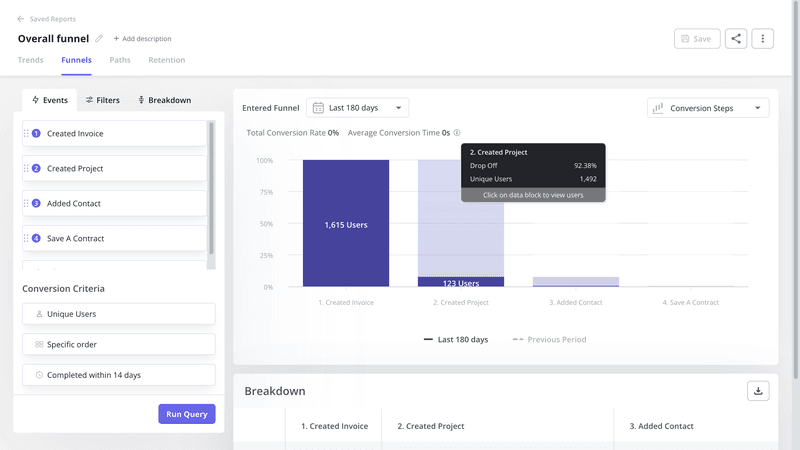
- Funnel analysis: Identify where users drop off in a multi-step process (e.g., sign-up flow or onboarding checklist).
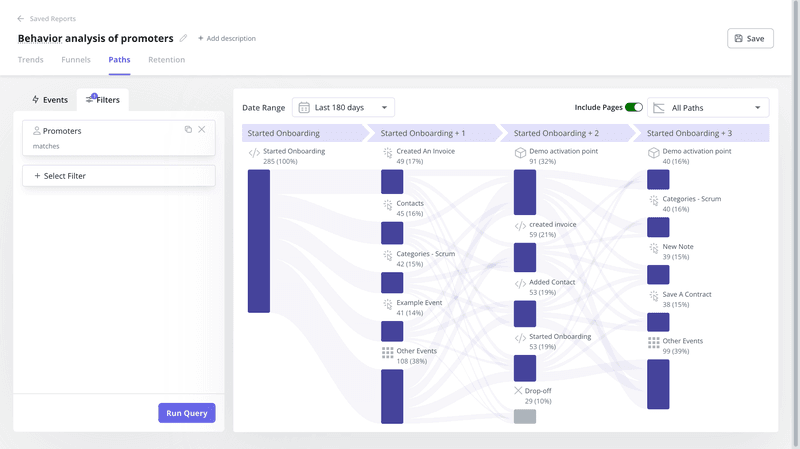
Path analysis: Traces every step users take before or after a specific event, allowing you to see the exact sequence of actions they perform. This feature helps you identify the happy path for different user segments and build workflows that increase adoption and retention.
- Cohort analysis: Groups users by criteria like sign-up date, feature usage, or engagement levels. It lets you track behavior over time, compare how different groups evolve, and assess the long-term impact of product updates or campaigns.
- User profiles: Are detailed records of users’ data like demography, how they interact with your product, and how they feel about it. This makes it easier to deliver personalized customer experiences, spot at-risk users, and prioritize support or outreach initiatives.
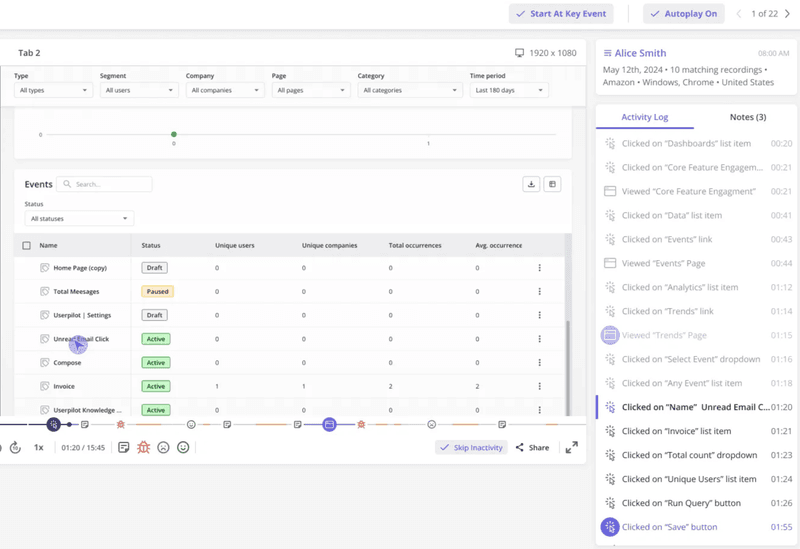
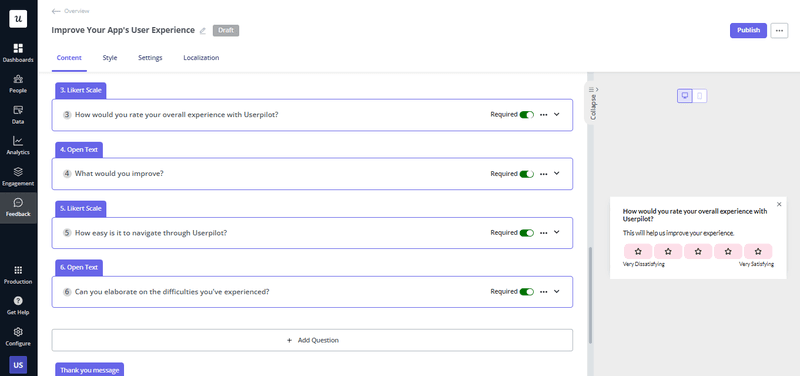
- Session replay: Records real user interactions—mouse movements, clicks, scrolling—allowing you to see how users navigate your product. It’s perfect for uncovering issues, understanding user intentions, and validating design decisions.
- In-app surveys: Collect qualitative feedback on the spot, combining seamlessly with your quantitative data. This dual view of user behavior and sentiment helps you understand the why behind specific actions so you can address pain points faster.
Integrations: Userpilot integrates with popular CRM tools (like HubSpot and Salesforce), data warehouses, and marketing tools to unify your customer insights. With everything in one place, your team can make informed decisions quickly and ensure data remains consistent across all platforms.
Pricing
Here’s an overview of pricing plans:
- Starter (from $299/month billed annually): Ideal for smaller teams, includes up to 2,000 Monthly Active Users(MAUs), NPS surveys, and core analytics like user segmentation, tracking, and trends.
- Growth (custom quote): Adds product analytics, retroactive events autocapture, in-app surveys, and resource center access.
- Enterprise (custom quote): Includes premium integrations, data warehouse sync, advanced security features, and priority support.
Customer reviews
💪 Strengths
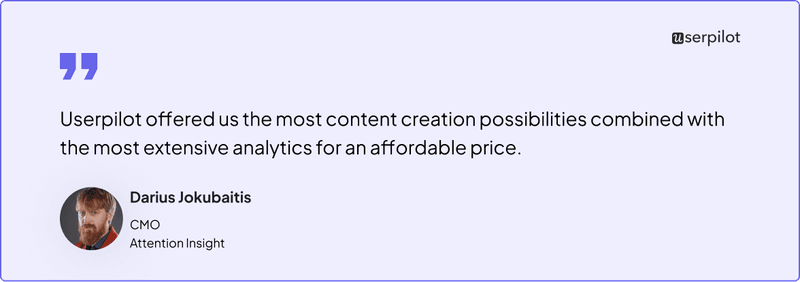
Attention Insight used Userpilot’s in-app guidance and analytics to improve their onboarding strategy and increase user activation by 47%.
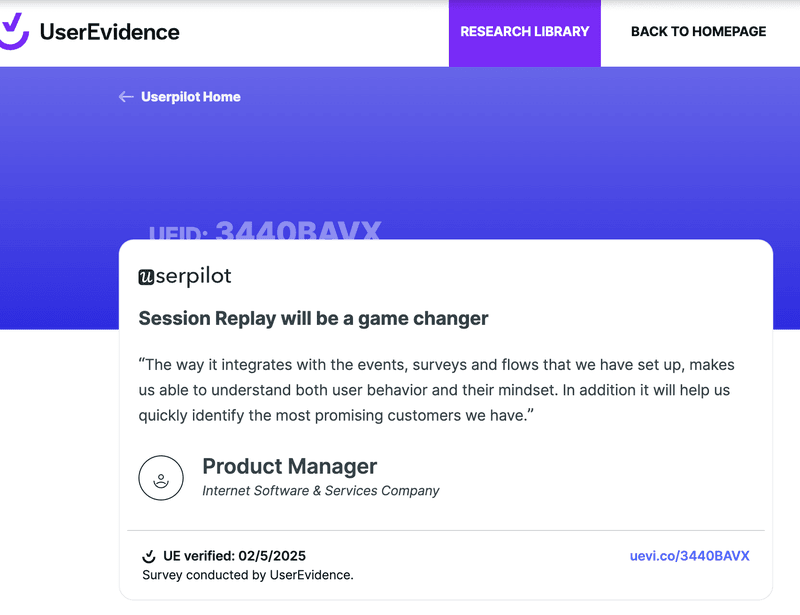
A testimonial highlights how the tool’s session replay feature seamlessly integrates with events and surveys to show user behavior and mindset. These insights help teams identify high-value customers faster.
💡 What could be better
One G2 review noted the lack of native mobile options. However, the team has listened and will soon launch a mobile version, making Userpilot even more flexible.
3. Mixpanel
Best for: Real-time engagement insights
G2 rating: 4.6/5 ⭐
Mixpanel is a real-time analytics platform that helps you track customer behavior and optimize customer journeys. It integrates with other product analytics tools, allowing you to merge event data for more seamless product insights.
Key features
- Behavior tracking: Identify popular features and friction points to boost customer satisfaction.
- Cohort analysis: Compare usage patterns between trial users and paying customers.
- Custom dashboards: Spot trends in churn, retention, and conversions at a glance.
Pricing
- Free: Covers up to 1 million monthly events and 10K session replays.
- Growth: Pay for extra events as you scale, with unlimited reports and 20K replays.
- Enterprise: Quote-based plan for unlimited events, advanced analytics, and dedicated support.
Customer reviews
💪 Strengths
Users love Mixpanel’s flexible reporting, rapid feature releases, and prompt support that addresses complex questions.
💡 What could be better
Some mention slight delays, usually minutes, in event data appearing, though it rarely impacts overall workflows.
4. Google Analytics
Best for: Freemium website and mobile app analytics
G2 rating: 4.5/5 ⭐
Google Analytics is a freemium analytics platform that tracks website and mobile app engagement. It’s a common choice for teams to assess marketing campaigns.
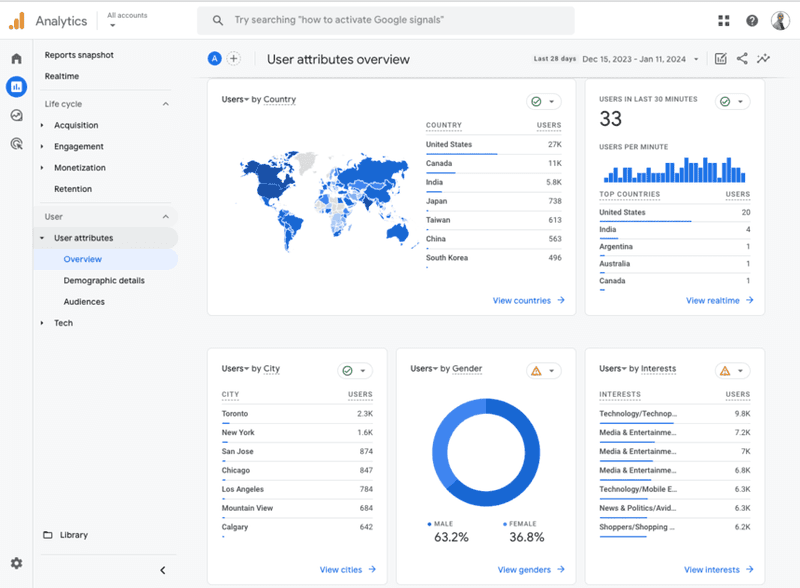
Key features
- Behavior tracking: Auto-collect user actions or define custom events.
- Traffic analysis: Pinpoint referral sources and examine funnel drop-offs.
- Segmentation: Filter visitors by demographics, device, or customer behavior.
Pricing
Google Analytics is free by default. However, Google Analytics 360, which offers enterprise features like BigQuery integration and dedicated SLAs, starts at $50,000/year.
Customer reviews
💪 Strengths
A user commends Google Analytics as an excellent tool with extensive reporting and custom dashboards.
💡 What could be better
Its UI can be overwhelming, so new users may struggle at first.
5. Hotjar
Best for: Analyzing heatmap data
G2 rating: 4.3/5 ⭐
Hotjar is a product analytics solution primarily known for its heatmaps and session recordings. It lets you see how users engage with your product, helping you spot navigation hurdles and improve their experience.
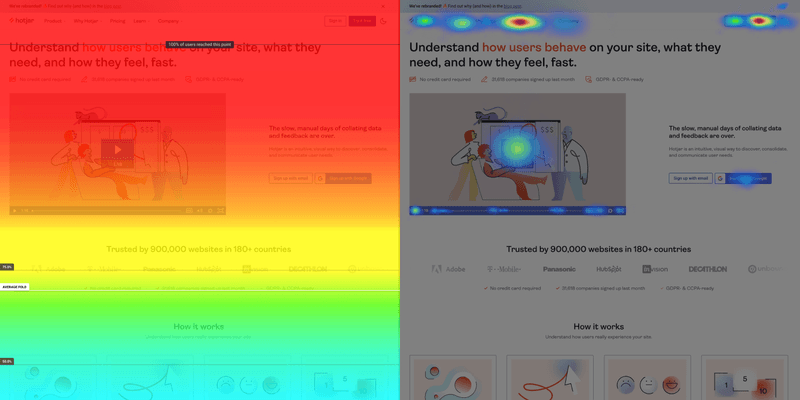
Key features
- Heatmaps: Reveal where users click and how far they scroll to guide UX improvements.
- Session recordings: Watch real-time user interactions to discover drop-offs or rage clicks.
- Funnels: Track conversions and identify key steps where users leave.
Pricing
- Basic (free): Up to 35 daily sessions, unlimited heatmaps, basic filters.
- Plus ($32/month): 100 daily sessions, advanced filters, session info.
- Business (from $80/month): 500 daily sessions, frustration scores, advanced integrations.
- Scale (from $171/month): Funnels, console error tracking, SAML SSO, priority support.
Customer reviews
💪 Strengths
Many users appreciate the script’s lightweight, easy deployment via Google Tag Manager and robust filtering capabilities.
💡 What could be better
Some users complain about irrelevant sessions, especially in the free version, making it unclear how Hotjar decides which sessions to record.
6. UXCam
Best for: Mobile-first product analytics
G2 rating: 4.6/5 ⭐
UXCam is a product analytics solution optimized for mobile apps. It tracks user gestures and taps, even detecting rage clicks, helping teams pinpoint user frustration in real-time.
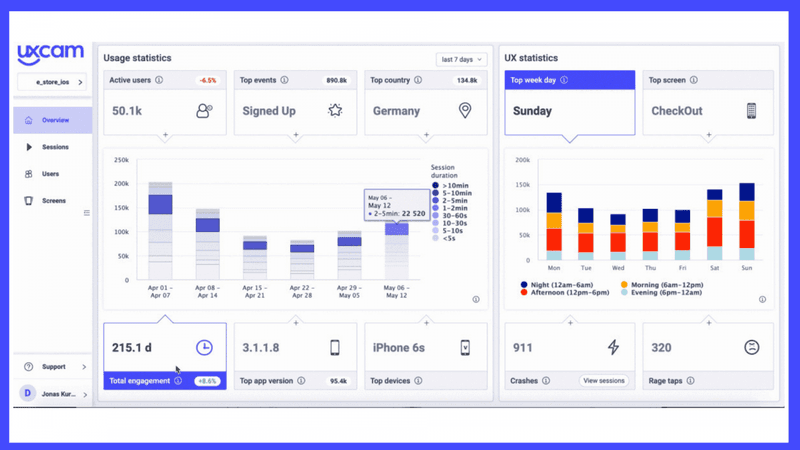
Key features
- Retention analytics: Identify the key actions that boost user loyalty.
- Issue analytics: Get immediate crash alerts and watch session replays to diagnose problems.
- Smart event tracking: Set up conversion events for easier monitoring and analysis without any code.
Pricing
All the paid plans are quote-based.
- Free: 3,000 monthly sessions with limited session replays and filters.
- Starter: 10,000 monthly sessions, fundamental analytics, and heatmaps.
- Growth: Advanced analytics, customer journey insights, performance monitoring, and an onboarding manager.
- Enterprise: Unlimited analytics, dedicated CSM, and advanced security.
Customer reviews
💪 Strengths
One user praised UXCam’s accurate session recordings and user-friendly mobile app, calling it an excellent solution for thorough data logging.
💡 What could be better
Another user reported scaling usage challenges due to flawed tagging and a steep learning curve for non-experts. They suggested more hands-on support and clearer tutorials.
7. Qualtrics
Best for: Omnichannel experience management
G2 rating: 4.4/5 ⭐
Qualtrics is an experience management platform that gathers feedback from calls, chats, social media posts, and more. Its advanced AI and natural language processing features help you pinpoint customer sentiment shifts and uncover hidden trends in real-time.
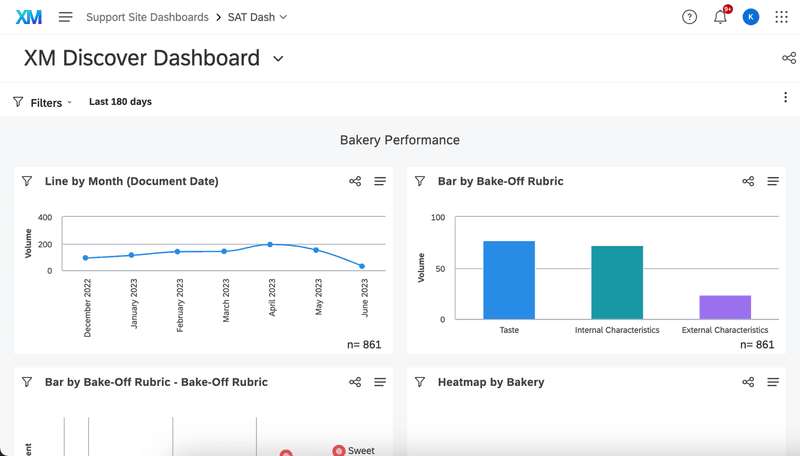
Key features
- Omnichannel data capture: Collect and unify insights from support channels, surveys, and reviews for a 360° customer view.
- Customer surveys: Design AI-powered surveys across multiple touchpoints to measure satisfaction and loyalty.
- Online reputation management: Track and respond to public reviews directly in the dashboard, backed by AI-suggested replies.
Pricing
All plans require a custom quote. Under customer experience, you can select modules like Digital, Care, or Locations. Each adds features like journey analytics, contact center monitoring, or real-time reputation management.
Customer reviews
💪 Strengths
One reviewer noted that the platform is intuitive enough for novices yet flexible for advanced customizations and integrations across the organization.
💡 What could be better
Another user found manual updates overwhelming and wished for more direct, in-app options without using .csv imports.
8. Tableau
Best for: Data visualization
G2 rating: 4.4/5 ⭐
Salesforce’s Tableau is a business intelligence platform that compiles customer data from multiple sources, such as databases, spreadsheets, and cloud services, into compelling visual reports.
Key features
- Live visual analytics: Build real-time dashboards to track metrics without coding.
- Augmented analytics: Leverage built-in AI and machine learning for deeper insights.
- Pre-built dashboards: Customize industry-specific templates or import dashboards from the Tableau Exchange.
- Drag-and-drop functionality: Simplify the creation of charts, graphs, and dashboards.
Pricing
- Viewer ($15 per user/month): interact with existing visualizations.
- Explorer ($42 per user/month): create custom views, data-driven alerts.
- Creator ($75 per user/month): build new customer data flows, use AI with Einstein Copilot.
Customer reviews
💪 Strengths
Users love Tableau’s range of visualizations, seamless cloud integrations, and ability to handle large datasets quickly.
💡 What could be better
Some small businesses find it expensive, and the learning curve for advanced features can be steep. Large datasets may also slow performance.
9. Sprout Social
Best for: Social media analytics and engagement
G2 rating: 4.4/5 ⭐
Sprout Social is a dedicated social media analytics platform that helps teams manage multiple profiles and track real-time engagement.
Key features
- Automation: Assign urgent messages automatically and receive alerts for crisis-level spikes.
- Performance tracking: Distinguish between paid and organic results to fine-tune marketing efforts.
- Audience engagement maximization: Analyze up to 16 weeks of user data to find optimal posting times.
Pricing
- Standard: $199 per seat/month, ideal for small teams with a handful of social profiles.
- Professional: $299 per seat/month, adds unlimited profiles and AI-assisted suggestions.
- Advanced: $399 per seat/month, offers sentiment analysis and advanced reporting.
- Enterprise: Custom quote, includes white-glove onboarding and premium support.
Customer reviews
💪 Strengths
One user praised Sprout Social’s intuitive setup, top-notch support, and streamlined features.
💡 What could be better
Another reviewer cited frequent bugs, rising costs, and an inflexible renewal policy: ultimately recommending other solutions with more competitive pricing and a smoother user experience.
10. InMoment
Best for: AI-driven feedback analysis
G2 rating: 4.7/5 ⭐
InMoment is an AI-driven customer experience platform best suited for analyzing feedback from surveys, social reviews, and call logs.
Key features
- Customer feedback surveys: AI-infused survey builder to design custom surveys quickly. With advanced text analytics and dashboard reporting to capture and act on customer insights.
- Conversational intelligence: Ingests and transcribes calls, chats, and emails, providing AI-powered conversation summaries that clarify customer interactions and highlight key issues.
- Advanced analytics & AI: Uses advanced AI to deliver predictive insights on customer intent, effort, and emotion. With journey-based impact analysis for strategic decision-making.
Pricing
InMoment doesn’t publish set rates. You’ll need to schedule a demo and request a custom quote based on your business needs.
Customer reviews
💪 Strengths
One reviewer noted that automated feedback emails improve vendor-customer relationships and streamline feedback loops.
💡 What could be better
Some users mention slow support for managed service clients, e.g., simple tweaks or filters might take months to implement.
Choosing the right customer analytics platform for your needs
Understanding user behavior isn’t just a nice-to-have—it’s essential for driving product growth and customer retention.
We’ve explored some of the best user behavior analytics tools, breaking down their key features, pricing, and real user feedback. Whether you’re looking for advanced product analytics, detailed session replays, or AI-driven insights, there’s a tool that fits your needs.
About the author