Personalization for SaaS – How To Do it Right [With Examples]


Personalization in SaaS is such a minefield. There’s a thin line between being personal and being creepy. I’ve recently noticed several big B2C and B2B brands have jumped on the personalization bandwagon. Some of their attempts are just cringe-worthy:
For instance, I received an email from IKEA about their transport, saying ‘it’s my big day tomorrow’.
No, it’s not ‘my big day’ tomorrow, IKEA. Thanks for the reminder about your transport, but it’s not like I’m going to celebrate the anniversary of the arrival of your BRIMNES wardrobe with cake and champagne every year.
Personalization is not about throwing in the {{first name}} tag in the confirmation email and welcome screen. Nor is it about calling me a ‘friend’ and faking familiarity. Done right, personalization in SaaS can be absolutely critical for new user activation, engagement and retention.
Let’s dive into some of the common pitfalls to avoid and how to do personalization right.
Personalization gone wrong – Confusing “personal” with “proper”, and “trendy” with “timely”
Source: hyperise
“There is a huge difference between Trendy and Timely, as well as Personalized and Proper”
Said Nicole Dugan, Director of Marketing at Sapiens, in a comment under my Linkedin post venting about failed personalization attempts.
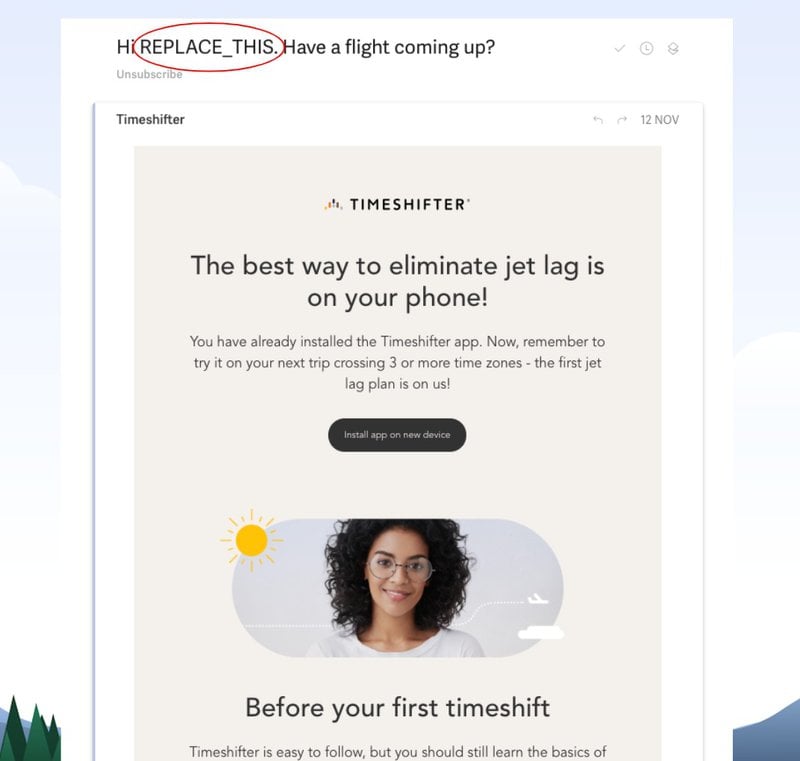
This hits the nail right on the head: most companies see personalization as simply calling the user by their first name (often wrongly, using {{name tags}} – see below:)
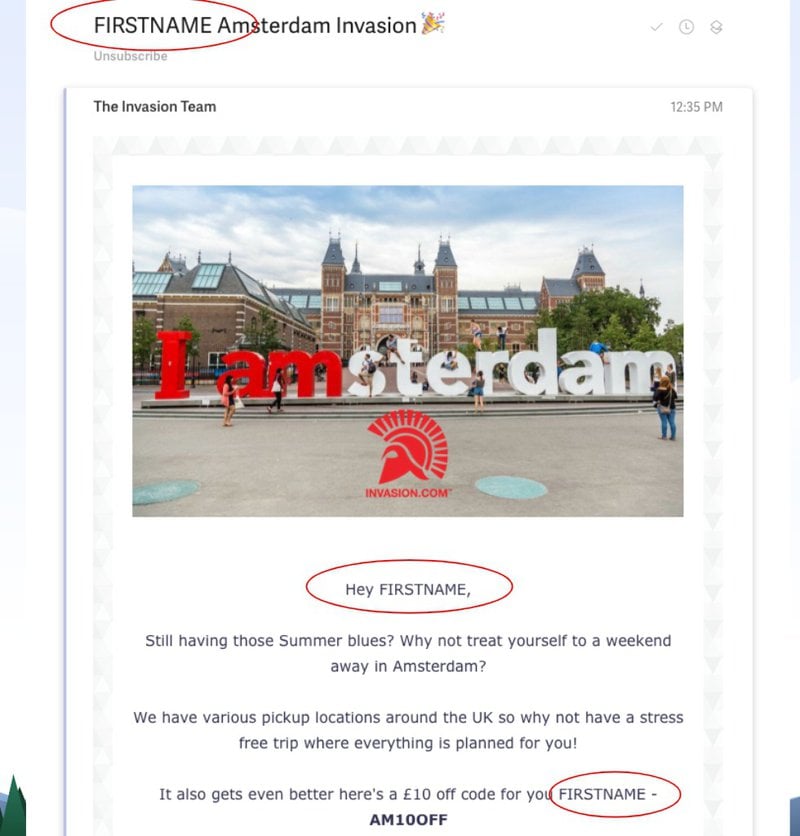
Source: hyperise
Or faking familiarity where it’s actually not proper.
When in real life would you call a complete stranger you’re trying to sell something to “a friend”?
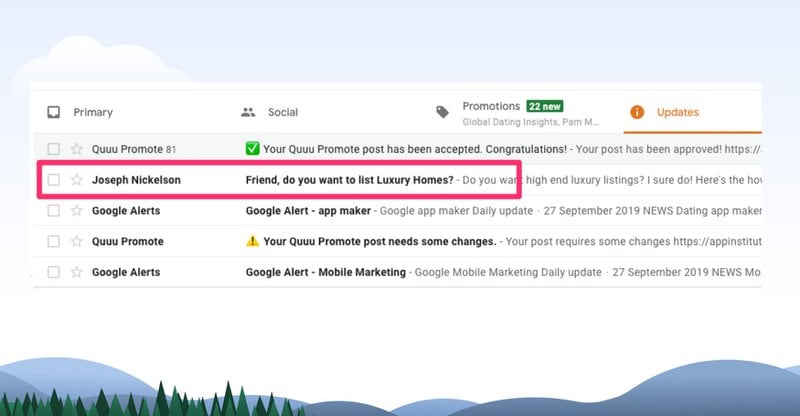
Source: hyperise
Imagine cashiers in supermarkets or managers in restaurants calling you a friend. That would be plain creepy in real life, right? Then why do we insist on doing it online?
No, faking familiarity, or overusing Bernie Sanders memes to look cool won’t earn you your customer’s respect (and their business).
What will?
Personalizing your user’s onboarding experience to their use case to help them get their job done faster.
Or following up diligently to see if their problem has been solved. This is the kind of personalization that shows you really care – as opposed to failing at the FIRSTNAME tag – which points to the exact opposite.
Companies should only personalize when they really had some kind of personal interaction with the customer – and to the extent they had it.
Much as you wouldn’t expect a corner store shopkeeper (that you’ve never talked to) to suddenly send you a box of chocolates for your birthday, there’s no need for a company you only have a transactional relationship with to fake familiarity.
If you go to the same hairdresser with your kid all the time and you build a relationship with him/her over time, and the hairdresser then remembers your kid’s birthday and gives him/her a small gift – that’s a different story.
Why Do So Few SaaS Businesses Get Personalization Right?
There are a few common reasons why SaaS businesses often fail leveraging personalization.
First – as I mentioned above already – they associate personalization with adding a few ‘personal touches’ like first name tags to their emails/ in-app messages, or sending birthday wished to their customers.
Second – even if a SaaS company knows that they should personalize the onboarding flows, in-app experiences, and emails for their users – they rarely have the time and resources to understand their users well enough to do so.
A lot of SaaS companies focus on superficial demographic data while creating their ‘user persona avatars’ – think ‘Marketing Mary’ or ‘Manager Tom’. Problem is – as Louis Grenier from EveryoneHatesMarketers pointed out in his recent post: people don’t buy your software because they have 2 kids, like swimming, and their favorite color is red. People buy your SaaS product to get a specific job done (think JTBD framework):
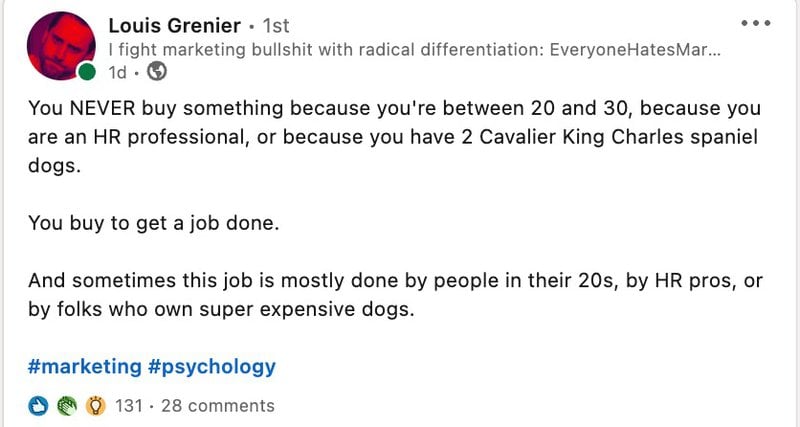
Source: Louis Grenier
Second: understanding your users’ journey and your user’s in-app behavior is super-difficult. Just look at the user analytics screenshot from Heap below:
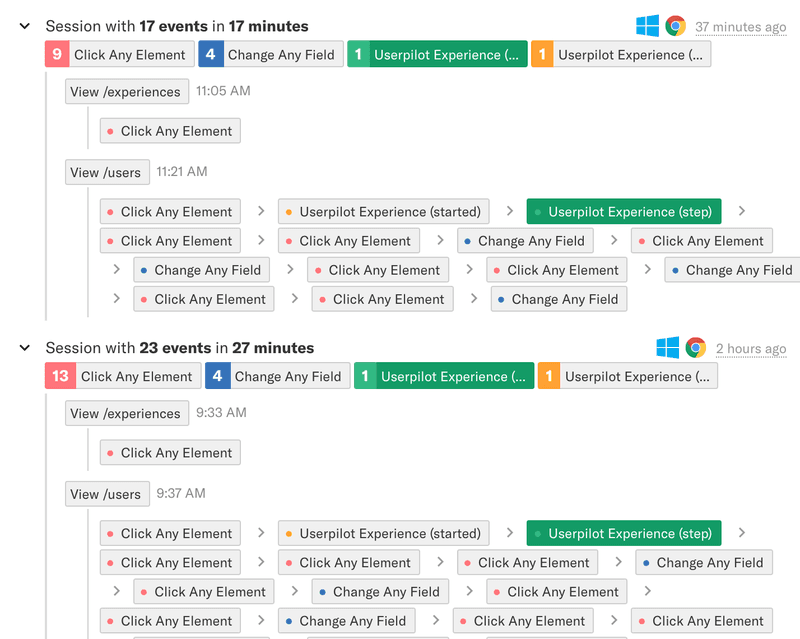
Source: Heap
Can you make out who the user is and what issues they have based on these charts? Even if you had the context – product analytics tools are notoriously difficult to read.
As a result – few SaaS companies actually know what touchpoints each user persona has with their company and their product. And hence – they don’t know how to personalize their in-app experiences at these touchpoints.
Why The *Right* Personalization Matters So Much in SaaS?
You may think – what does personalization matter so much?
Let’s go back to Louis’ Grenier’s post: your users are using your tool to solve their personal or business problems. To get a specific job done.
Unless your SaaS is super-niche, it will probably be solving a few problems. Sometimes it will be solving very different problems for very different people.
E.g. our tool allows Product Managers to create in-app experiences that boost feature adoption such as tooltips and walkthroughs without coding. Or it allows Product Marketers to promote the latest webinar to their users in a slideout. An engineer can use it too to create scalable flows without coding.
Take an email marketing tool.
Laura, who’s just starting her new blog with cooking recipes may want to use it to collect subscribers and slowly start growing her newsletter.
On the other hand – Jessica, an owner of a sizeable e-commerce store may want to move to your tool from another email marketing tool to save money (or because you offer some functionality that the competitors didn’t have).
John, a SaaS business owner, may want to use it to automate his onboarding.
Ken, an online coach may want to use it to run an email course.
As you can see, these four people need to get some very different jobs done with your tool.
Will personalization of the onboarding flow based on their goal help them get their jobs done faster? (You know – a straightforward interactive walkthrough showing them what they need instead of a boring product tour showing them *all* your product features, even the ones they will never use?)
Hell yes.
Will saying ‘Hello Jessica!’ vs. ‘Hello John!’ in the welcome email make any difference to them, let alone make them choose your tool over another one?
I think it’s self-explanatory.
So – in a nutshell – personalization in SaaS is important because it can help your users hit their goals faster. And that will make them happier and more willing to pay (so – improve your activation, conversion, and retention).
Now let’s see how to do personalization in SaaS right – and how ConvertKit, a Saas company that gets personalization, has done it.
How to Personalize the Right Way?
As you may have guessed – the right way to personalize in SaaS is by a) segmenting your users by their Jobs to Be Done; b) helping them get their jobs done ASAP.
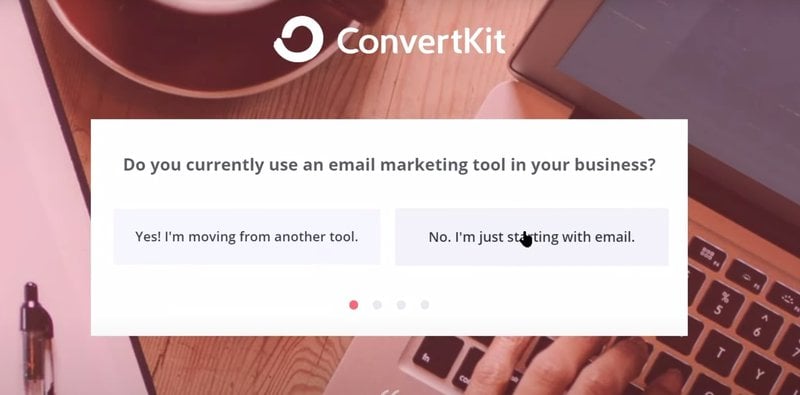
ConvertKit, an email marketing tool for creatives, makes sure their new users get what they want ASAP, by asking them what they want to accomplish in the welcome screen (do read our post about welcome screens btw. – you will need it to implement personalization in your SaaS!)
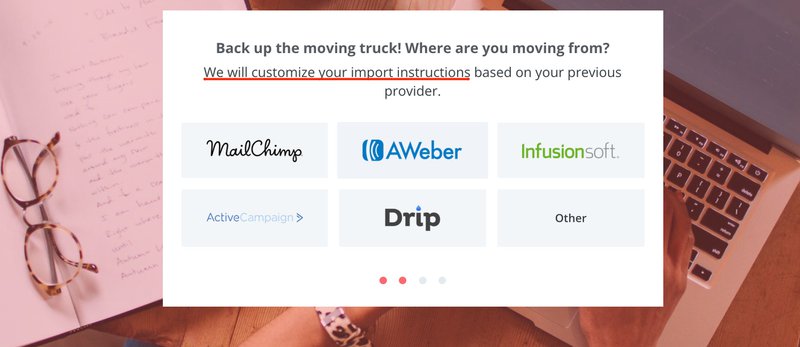
If you choose you’re moving from a specific tool, they will give you a few options and then customize your moving instructions to help you get that done faster.
Here’s what you can do to get personalization in your SaaS right:
- Decide what common jobs your users ‘hire’ your product for;
- Create a microsurvey with these jobs as options in your welcome screen (you can create them code-free using Userpilot.)
- Tailor the onboarding experiences accordingly – show your users the shortest path to achieving their goal. One at a time.
They will thank you.
Other Ways You Can Successfully Use Personalization in SaaS
As I hinted on before – personalization is not just the domain of product or marketing.
You can personalize well in SaaS by simply…instructing your Customer Success and Support people to care. Really, really care – the way you would care as if it was their own problem.
If you have a customer coming to you with an issue, personalization is following up and making sure their issue has been solved.
Or if you have a user who does not come to you, but is visibly struggling with something – which you can tell by the fact that they have not used a specific feature that they should be using (check out our simple user analytics, btw) – you should proactively reach out to them to help them adopt this feature (or automate the process using interactive in-app experiences.)
Conclusion
Real, meaningful personalization, like when you’ve really been in touch with the customer, you transferred them to the relevant department and now you’re following up to see if their problem has been solved = building a relationship.
Better still – if you offer them a personalized user journey that will help them hit their goals faster.
Overstepping the mark and sending automated messages with creepy details showing you’re probably storing more data about the customer than they would like to = cringeworthy.
Don’t be a tryhard. Personalize only when appropriate. Click the banner below if you want us to show you how.
About the author