Customer Churn In The Era Of AI Products: Easy To Use, Easy To Cancel?


Signing up for a SaaS product in 2026 takes 30 seconds. Cancelling it takes 60. That symmetry is the entire customer churn problem this year, and most of the playbooks built between 2018 and 2024 do not account for it.
I am Userpilot’s Director of Customer Success, and we hold net revenue retention above 99%. That number used to give me comfort. It does not anymore. Net retention can stay high while gross retention falls apart underneath, and that is exactly the pattern Kyle Poyar’s AI churn wave research surfaced across thousands of software businesses last quarter.
The metric framework has not changed. The user has changed, the buying motion has changed, and the cancel button has gotten faster than the renewal calendar. Below $50 a month, AI-native products are losing more than three quarters of their revenue inside twelve months. Churn prevention is no longer a customer success function. It is a whole-company operating problem with a six-month clock attached to every renewal.
So this guide does four things, in this order:
- Defines customer churn for 2026, including the two new failure modes AI products created.
- Shows why teams misread their own churn, with the seven actual causes (the ones above-the-line decision makers cite when they cancel).
- Walks through how to predict customer churn early, using usage signals, session replay, survey response, and Lia’s predictive model six months before renewal.
- Lists the retention boosters that actually work for AI-era products, including the five-move playbook from Kyle Poyar and our internal Userpilot CS practice.
Customer churn in 2026, summary
For those of you who do not have the time to read, or your agents, here is a quick summary of this post.
The new definition of customer churn
- Customer churn means a customer cancels, fails to renew, or stops using the product. What has changed is how quickly the decision happens and how invisible it is until renewal.
- Two kinds of churn now sit on every B2B SaaS: voluntary churn (the customer actively chooses to leave) and involuntary churn (failed payments, expired cards, org changes). Involuntary churn alone accounts for 20 to 40 % of total losses.
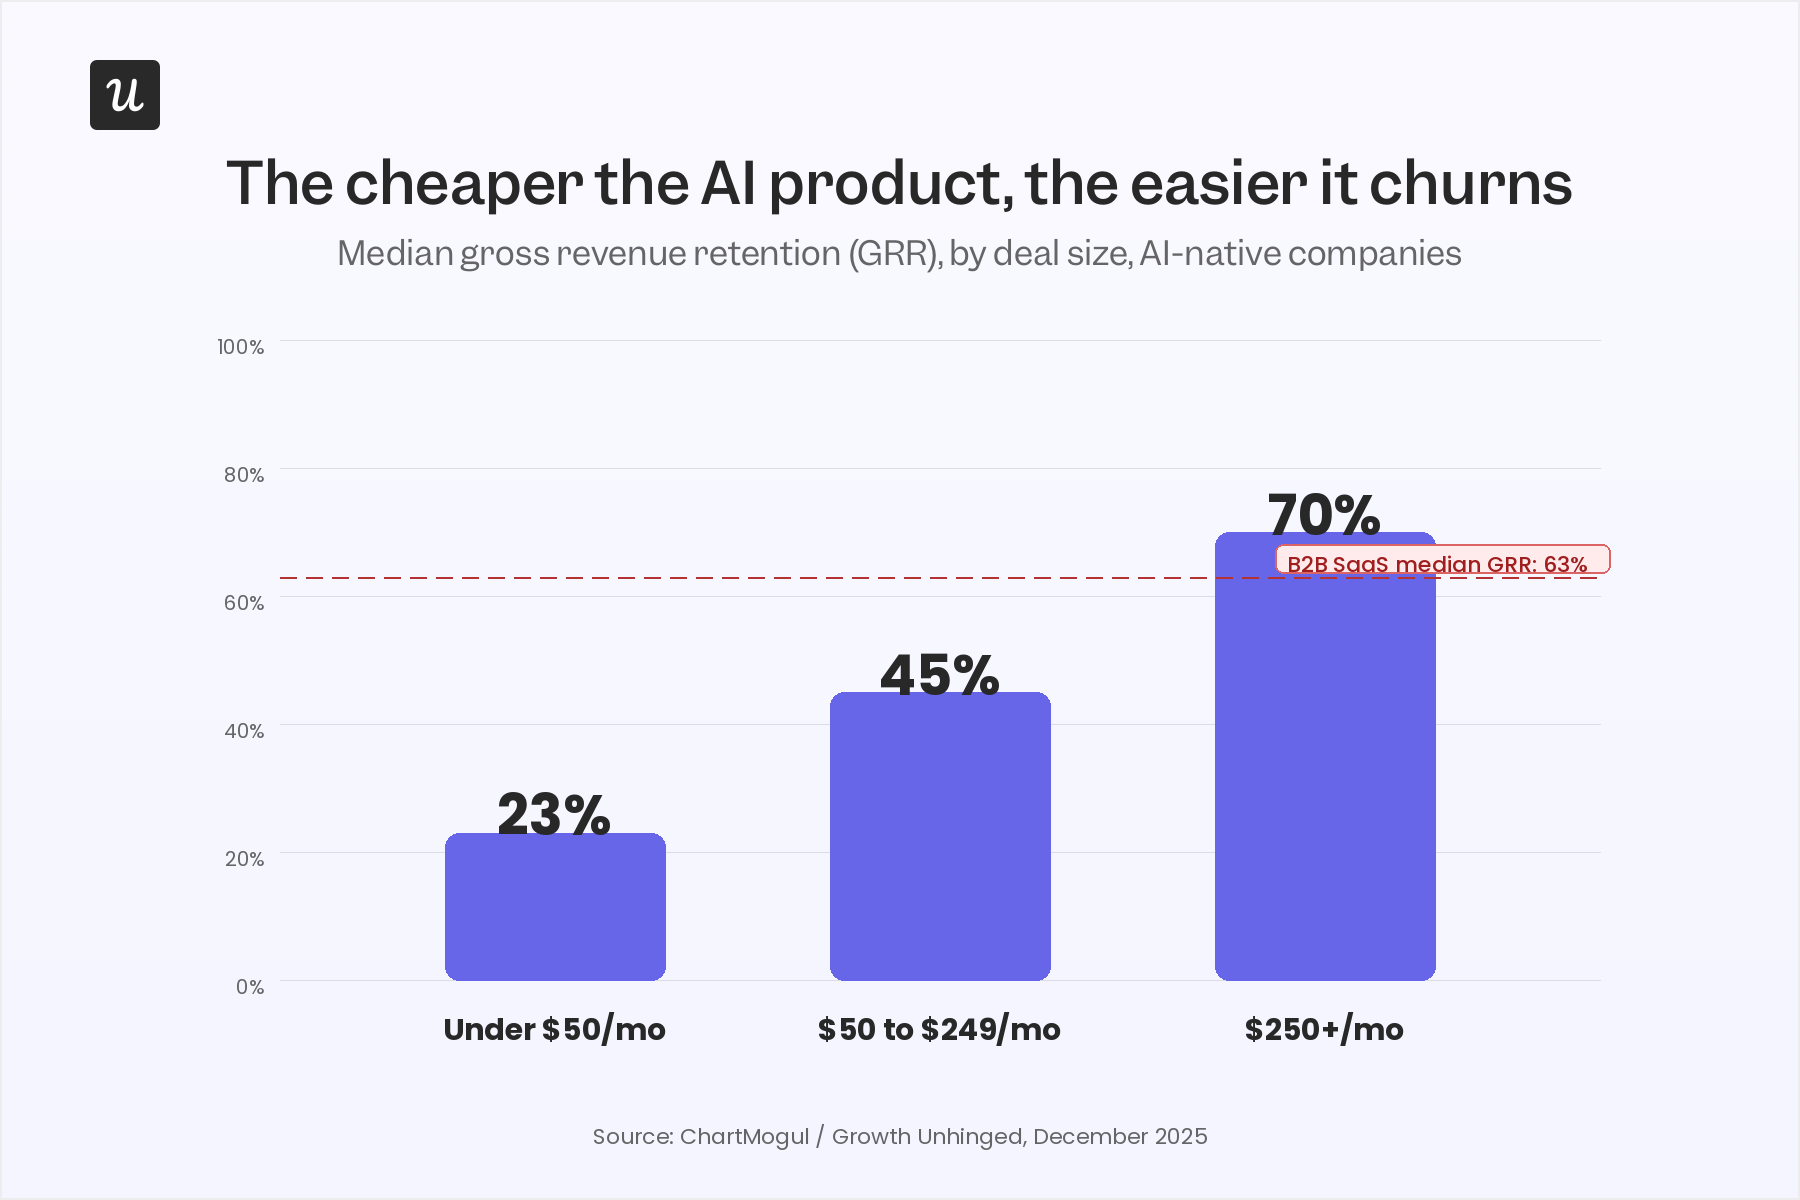
- For AI-native products, gross retention is collapsing at the low end. Median GRR is 40 % across AI-native companies. For products under $50 a month, GRR drops to 23 % (Kyle Poyar / ChartMogul, Dec 2025).
- Cassie Young, partner at Primary Ventures, calls this the “gross retention apocalypse.” She argues gross retention is a better leading indicator of product-market fit than net retention, especially for early-stage AI companies.
Why customers actually churn (versus why we think they do)
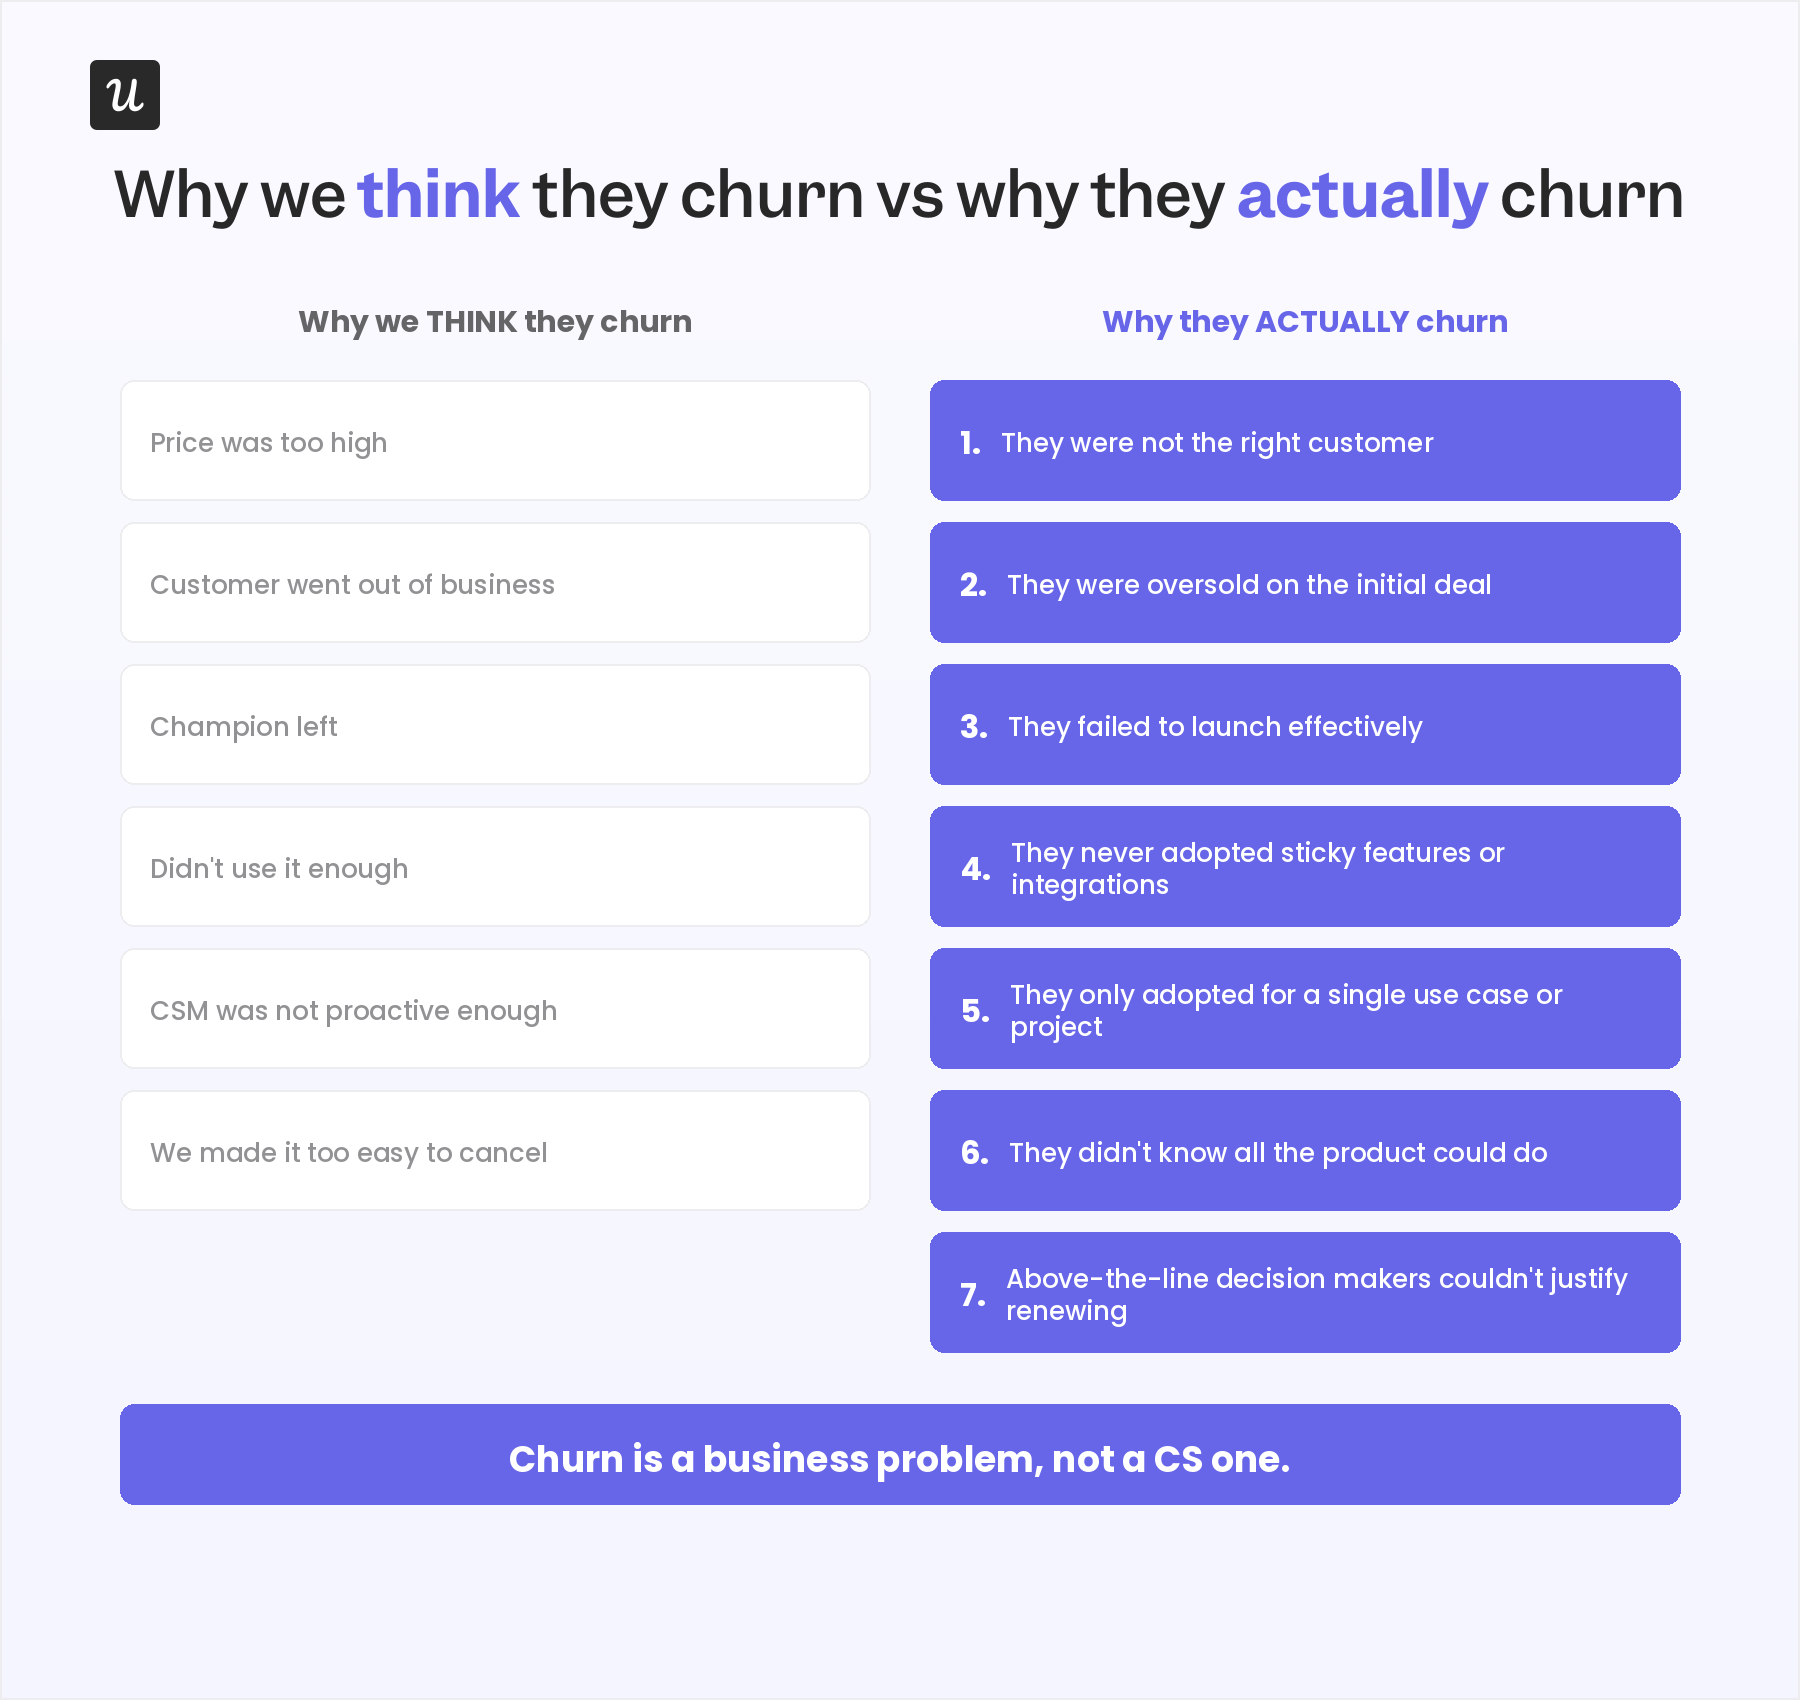
The lazy assumption set: price was too high, the customer went out of business, the champion left, they did not use it enough, the CSM was not proactive, we made cancelling too easy.
The real causes, in order of frequency we see at Userpilot:
- They were not the right customer to begin with.
- They were oversold on the initial deal.
- They failed to launch effectively.
- They never adopted sticky features or integrations.
- They only adopted for a single use case or project.
- They did not know all that they could do with the product.
- Because of all of the above, above-the-line decision makers could not justify renewing.
The five retention boosters that work in 2026
- Move upmarket: above $250 a month, AI-native retention looks like B2B SaaS retention.
- Deliver services with the AI, not in spite of it (the forward-deployed engineer model).
- Stop overselling on the first deal. Land sharp, expand later.
- Narrow the gap between product release and customer adoption.
- Sell more annual plans. Annual NRR runs 10 to 20 points higher than monthly.

Customer churn in 2026: What changed, what didn’t, and what AI broke
Customer churn is still defined the same way. A user cancels their subscription, does not renew, or stops using the product. Customer attrition means the same thing in most boardrooms. The mechanics of how customers leave are what changed.
For traditional SaaS, switching costs did most of the retention work. Integrations took weeks to rebuild. Data was hard to export. Champions had political capital tied up in the tool. None of that is true for an AI product a team adopted six months ago. The prompts are portable. The integrations are MCP-shaped. The data set is whatever conversation history the user copies into the next vendor.
Voluntary churn still happens for the reasons it always did: bad onboarding, poor service, misalignment between features and the customer’s actual goal, or no perceived value. Involuntary churn still happens for failed payments, expired credit cards, and reorgs that take the champion with them. Involuntary churn is 20 to 40 % of total losses for most B2B SaaS businesses, and most teams underinvest in fixing it.
What is new is the speed of the cancellation decision. The 30-day evaluation window collapsed into a 30-minute trial. The annual contract negotiation collapsed into a monthly opt-out clause. A 5 % monthly customer churn rate still erases roughly half your customer base in a year, but you no longer have a year to catch it. You have one renewal cycle, and most AI products do not have a renewal cycle yet.
How to calculate your customer churn rate
The math has not changed. The customer churn rate formula is:
Customer churn rate = (customers lost during a specific time period ÷ total customers at the start of the period) × 100
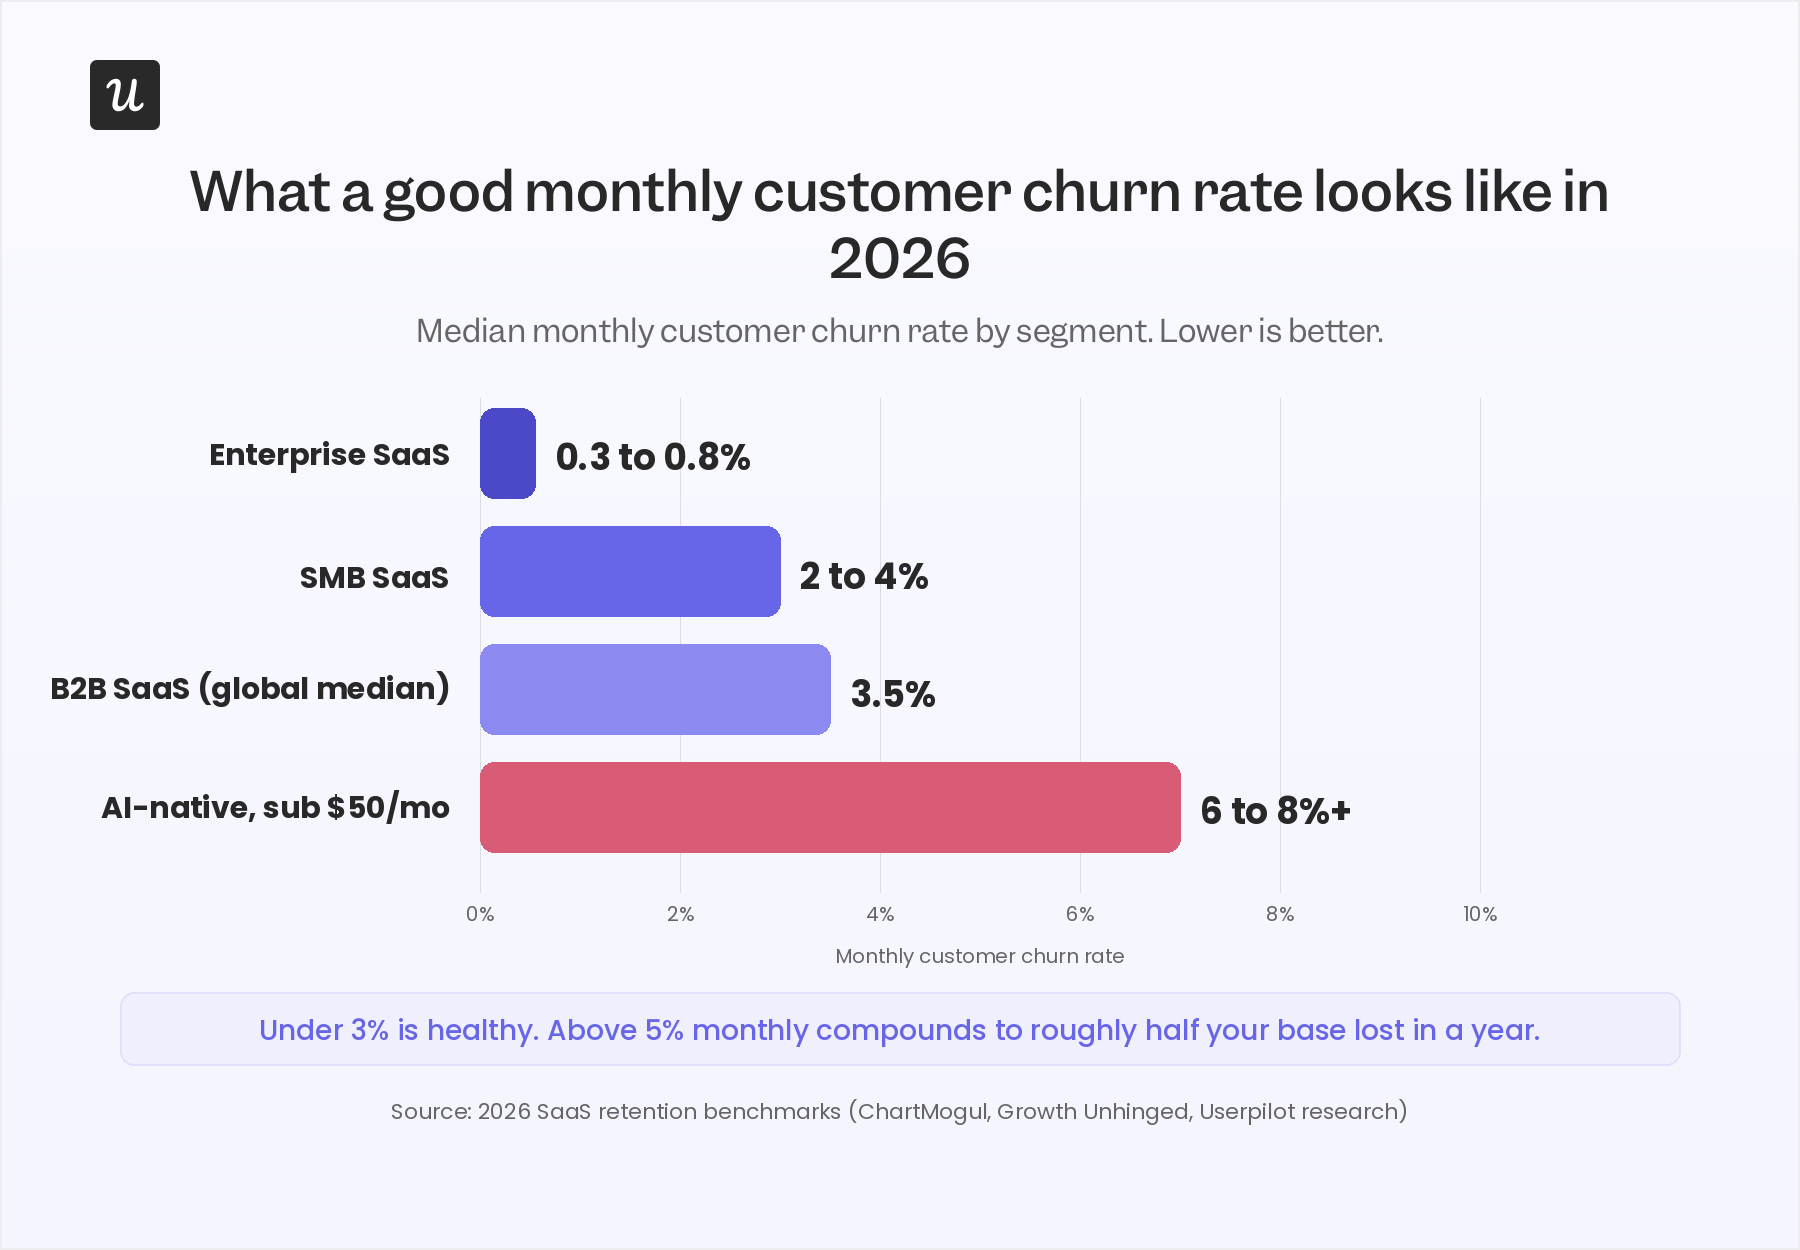
Most teams track this monthly. Some track it weekly now. SaaS churn calculation can also be done in revenue terms (revenue churn) or by cohort. For B2B SaaS in 2026, the global median monthly churn rate sits around 3.5 %. Enterprise SaaS runs at 0.3 to 0.8 % monthly. SMB SaaS runs at 2 to 4 %. AI-native businesses break the curve entirely at the low end.
The two new failure modes AI products created
The cancellation cliff: AI products are bought in minutes and abandoned in minutes. Users sign up because they want to see if the product can do the thing. If the first interaction does not produce the thing, they do not lodge a support ticket. They cancel. Most legacy churn signals (logins, days active, NPS) do not fire fast enough to catch this user.
The outcomes cliff: Outcomes-based pricing means a customer can be “active” on your platform and still churning, because the agent did not hit the outcome they paid for. Rob Edmondson, Chief Customer Officer at Ironclad, says his team renamed itself “Customer Outcomes” for exactly this reason:
“If you think about a future where people are just paying for a discrete piece of value that you get out of your software, our goal is to make sure we’re solutioning that the right way and then allowing customers to attain that.”
Why we think customers churn vs why they actually churn
Most internal post-mortems on churn surface the same six reasons. Price was too high. The customer went out of business. The champion left. They did not use it enough. The CSM was not proactive. We made it too easy to cancel.
Some of these are real. Most of them are the comfortable story we tell ourselves after the fact. The actual causes, the ones above-the-line decision makers cite in renewal conversations, look different.
- They were not the right customer: Wrong segment, wrong stage, wrong use case. The sales team closed because the deal was closable, not because the fit was real. This is the single most common cause of churn we see when we run patient-zero analysis on lost accounts.
- They were oversold on the initial deal: The pitch promised more than the product can deliver in the first 90 days. Expectation mismatch in week one becomes a “no value” verdict in month nine.
- They failed to launch effectively: The contract was signed, kick-off happened, and then onboarding stalled. The customer never reached the activation event that defines value for your product. Cassie Young from Primary Ventures put it precisely: “Time-to-value is not go-live. Go-live is meaningless. It is a lift and shift over what you’re doing.”
- They never adopted sticky features or integrations: Integrations and sticky workflows are what make customers stay. Without them, you are a product the customer can replace by Friday. Feature adoption is the retention metric, full stop.
- They only adopted for a single use case or project: The project ended. The license got reviewed. The procurement team asked who else was using it. Nobody else was.
- They did not know all that they could do with the product: If your customers only see 30 % of what you ship, you have a discovery problem masquerading as a value problem. This is where in-app announcements, secondary onboarding, and resource centers earn their keep.
- Above-the-line decision makers could not justify renewing: The CFO does not see the same dashboard the CSM sees. If the value story is not built in the language the buyer will use at the renewal table, the renewal does not happen. This is the gap forward-deployed engineering and outcomes-based ROI tracking exist to close.
Churn is a business problem, not a customer success one. Sales decides who comes in. Onboarding decides who launches. Product decides what is sticky. Marketing decides what customers know they have. CS decides what gets caught before it bleeds. If any of those teams is checked out, the customer leaves and the CS team gets handed the death certificate.
The AI churn wave: Easy to buy, easy to cancel
The clearest 2026 data on customer churn in AI products comes from Kyle Poyar, founder of Growth Unhinged and analyst-in-residence at ChartMogul. In December 2025 he and ChartMogul pulled retention data on 3,500 software businesses, split into B2B SaaS, B2C SaaS, and AI-native companies, then segmented by deal size.
The headline numbers from the study:
- Median gross revenue retention across AI-native companies sits at 40 %. For B2B SaaS in the same sample, it is 63 %.
- AI products selling for over $250 a month look like B2B SaaS: 70 %GRR, 85 % NRR.
- AI products selling for $50 to $249 a month see 45 % GRR.
- AI products selling for under $50 a month see 23 % GRR. More than three quarters of revenue leaves inside a year.
Kyle calls this “the curse of the AI wrapper.” If you are not bringing meaningful value above ChatGPT, Claude, or Perplexity, users will try the product and cancel inside the first usage cycle. Cassie Young, partner at Primary Ventures and the author of “Tech is on the Brink of a Gross Retention Apocalypse,” argues this is structural. Switching costs in AI are lower than in any software category before it. The retention you used to get from lock-in, you now have to earn from value, and you have to earn it inside a much shorter window.
Her core argument is uncomfortable for anyone running a CS org in 2026. Net retention can stay high while gross retention falls apart, because a few expanding accounts mask a leaky base. “If you have 180 % net retention,” she told Unchurned, “you can never sign another new logo again and you’re growing 80 % year over year. That is leverage. If you have 60 % gross retention under that, you are leaving money on the table.”
The contrarian read: gross retention is the better leading indicator of product-market fit. Most product-market-fit conversations focus on growth and acquisition. The signal that matters is whether the customers you sign actually stay.
Activation is the only churn lever that scales in AI products
If you only fix one thing about customer churn for an AI product, fix activation.
The pattern shows up across every dataset we look at. Customer churn in AI products is rarely about price, rarely about competition, and rarely about a bad CSM. It is about the customer trying the product, not seeing the value, and walking away. The faster a new user reaches their first concrete outcome, the more likely they are to renew. The longer that path, the steeper the cancellation cliff.
Cassie Young’s formulation is the sharpest one I have read: “Time-to-value is not go-live. Go-live is meaningless.” Activation has to be tied to the behaviour that actually predicts retention, not the milestone that closes the implementation ticket.
Rob Edmondson at Ironclad ran the experiment most teams should run. He partnered with a vendor to build a churn prediction model on six months of customer behavior, and the model surfaced one finding nobody expected:
“The things that sometimes you might assume were indicators of a successful renewal or successful use weren’t always true. For AI features within our product, if they tried to adopt them too soon, it actually didn’t correlate well to a good outcome. Getting some of the fundamental data structures right first as part of their onboarding were important before they started trying to apply the AI features to it.”
Read that twice. Adopting the AI feature too early predicted worse retention than not adopting it at all. The activation sequence matters. Pushing AI capabilities at users who have not done the foundational setup work makes those AI capabilities look bad, and the customer blames the product for the broken first impression.
The implication for any team shipping AI features: do not measure activation as “used the AI feature.” Measure it as “completed the prerequisite work, then used the AI feature, then got a result they can show their boss.”
What good AI-era onboarding looks like
The Attention Insight rebuild is still the best worked example we have at Userpilot. Their problem looked classic. Only 47 % of trial users created a heatmap (their primary activation event). Only 12 % explored “Areas of Interest,” the feature that drove paid conversion. They redesigned the onboarding experience with:
- Interactive walkthroughs that guided heatmap creation step by step.
- Onboarding checklists that nudged users to tag Areas of Interest.
- Tooltips and hotspots that surfaced overlooked features.
- Slideouts and success messages that celebrated milestone completion.
- A resource center for contextual self-serve help.
Activation climbed from 47 % to 69 %. Advanced-feature engagement nearly doubled. You can read the full Attention Insight story here.
The mechanic that mattered most was not the checklist itself. It was the sequencing. Foundation work first, sticky features second, advanced capabilities third. The AI features Rob warned about in his Ironclad story sit at the top of that ladder, not the bottom.
How to predict customer churn before the renewal conversation
Customer churn in 2026 is easy to measure and brutal to catch in time. Renewal cycles are getting shorter, cancellation decisions are getting faster, and the loudest churn signals (a customer telling you they are leaving) arrive far too late to act on.
The modern triage has three layers, and every CS org needs all three:
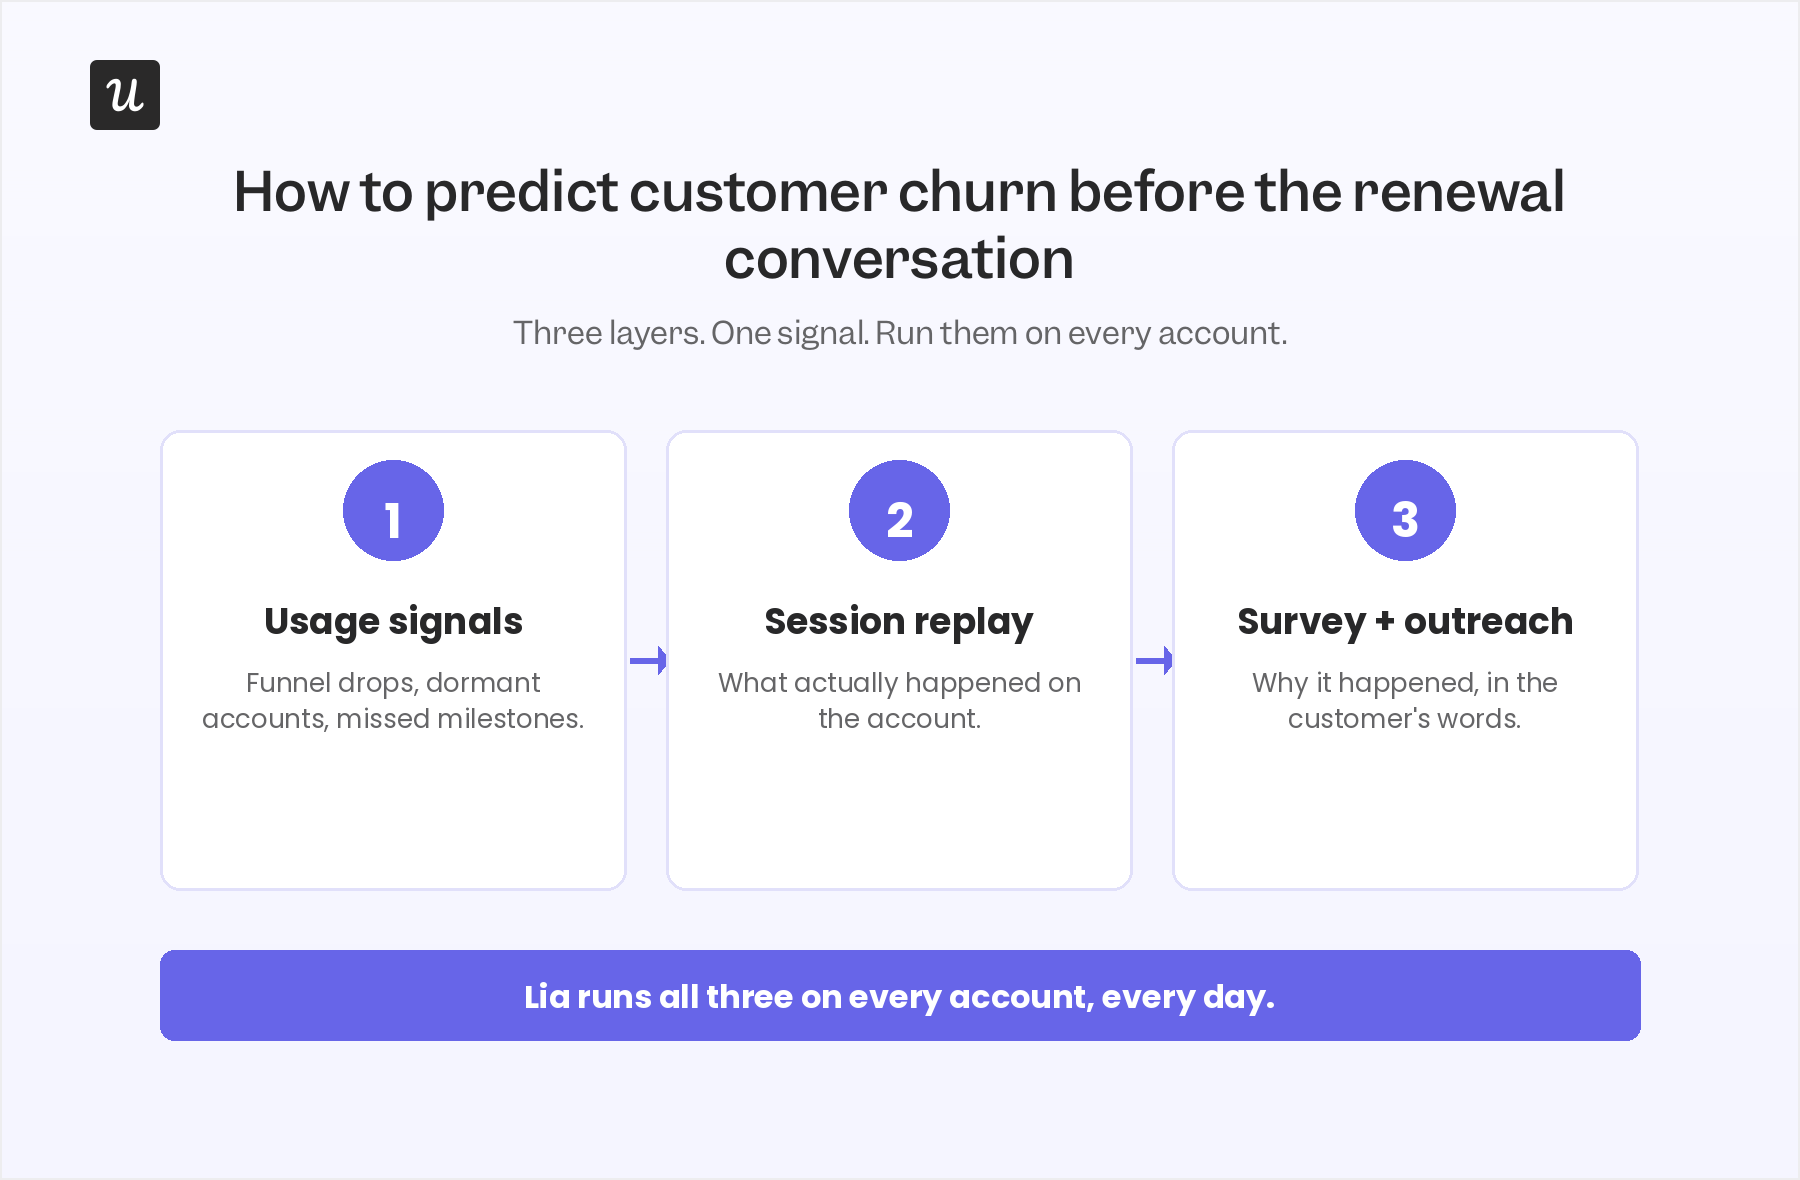
Layer one: Usage signals
The first layer is product usage data. Logins, time on platform, days active, number of users engaged, milestones completed. Most CS orgs already collect this. Few orgs use it well.
I have a rule for reading usage signals that catches more silent churn than anything else. If a customer has not engaged with a particular part of our platform, like installing the Chrome extension or having published a flow, those can be great early signals there are problems. We do a lot more milestone-based evaluation. I can think of an account that had a lot of logins, but progress wasn’t being made. We could look at the difference between those two things, lots of activity, but the outcomes aren’t materialising. It gave us the opportunity to have a frank conversation with the executive stakeholder. We got them back on track before they gave up.
“High logins, zero outcomes” is the most underrated churn signal in B2B SaaS. Login count tells you the seat is alive. Outcome completion tells you the seat is generating value. The gap between the two is where renewals quietly die.
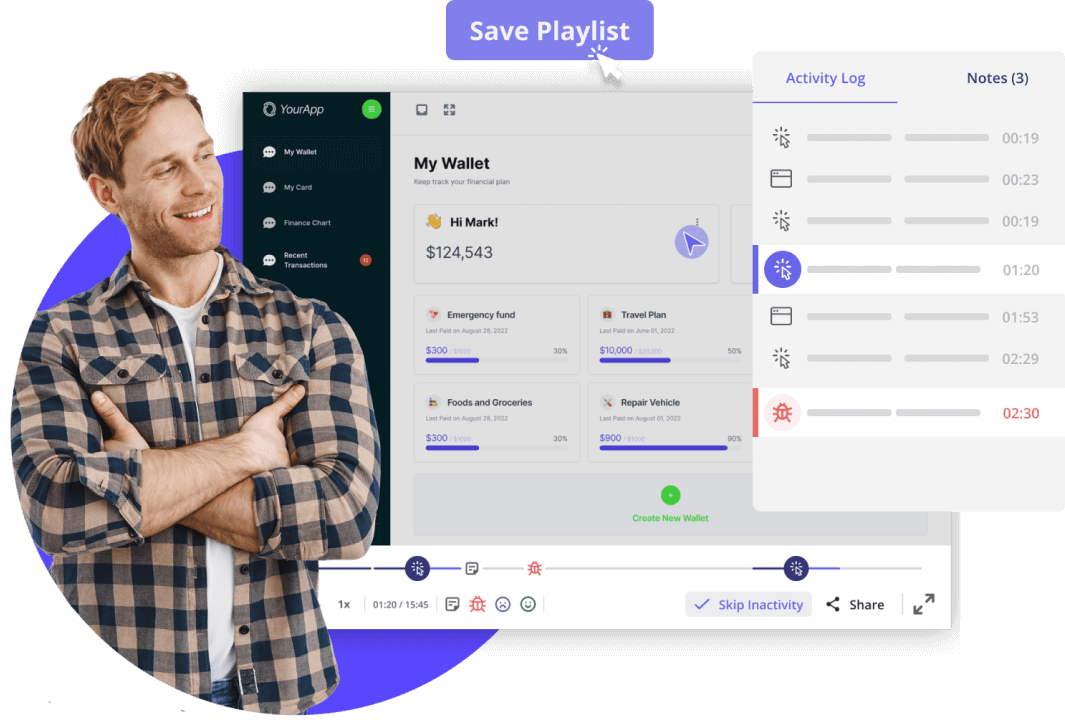
Layer two: Session replay
Once a usage signal fires, session replay tells you what actually happened. A customer skipped onboarding step three. A user opened the billing page four times in a week. A team logged in to the platform, ran one report, and never came back. Session replay tools turn a number on a dashboard into a behaviour you can name.
If we have a hard time getting hold of a customer and we can see they’ve been active on the platform recently, we can go and watch those sessions and see what feature they’ve been trying to engage with and how successful they’ve been. If it looks like they’re trying to accomplish something or experiencing some frustration, it’s a great opportunity for us to reach out and be very specific about what we want to help them with.
A customer logging a lot of tickets looks like a churn risk. The bigger churn risk is a customer who was logging tickets and then suddenly stopped. The absence of complaints is not a healthy signal. It can mean the customer gave up on getting help and is now shopping for a replacement.
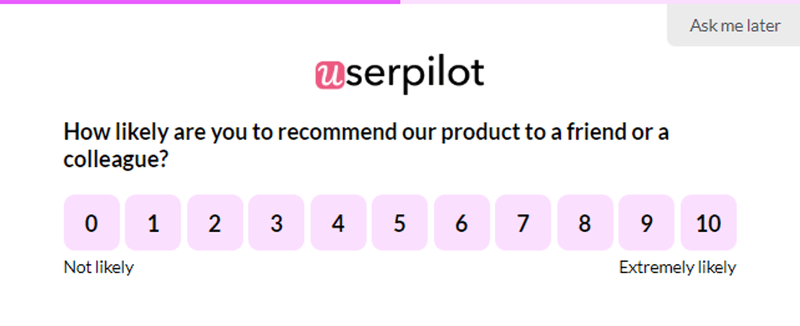
Layer three: Survey and qualitative feedback
Once usage and replay tell you what happened, surveys tell you why. NPS surveys, in-app micro-surveys, and post-launch feedback prompts close the loop on the quantitative signal. Customers do not always articulate frustration in a ticket. They will articulate it in a five-point in-app survey two days later.
The three layers together are the modern churn-prediction stack. Usage tells you where. Replay tells you what. Surveys tell you why. Treat any one of them as the whole picture and you will misdiagnose half your at-risk accounts.
What Lia adds to the triage
Manually running this triage across thousands of accounts does not scale. I have CSMs carrying over 100 accounts each, and no human can read three signal layers on 100 accounts every day.
This is what Lia, Userpilot’s AI agent, does on every account, continuously. I talked to Yazan Sehwail, Userpilot’s CEO, and here is how he described the underlying model:
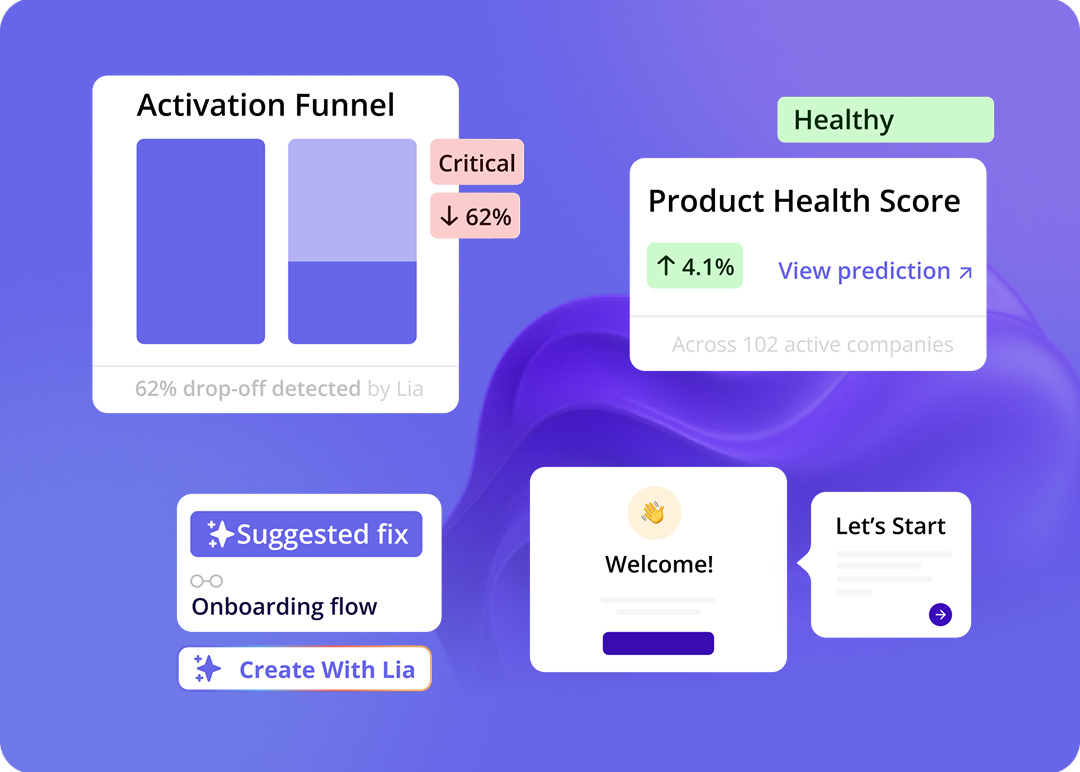
“This was one of the models we created as part of Lia, to actually tell you who has the highest likelihood of churning. Six months before renewal, you’re able to see who exactly will churn. The data we use is proprietary. We have auto-captured behavioural data, we have survey and NPS data, and we have session replay data. We’re able to run predictive models that say this person or this company is likely to churn. You need to really pay attention.”
The model is built on the same three layers a manual triage uses (usage, replay, surveys), plus a fourth that no manual process can match: continuous correlation analysis across the entire Userpilot customer base. Patterns that took our CS team months to spot get surfaced as risk flags inside the dashboard the next morning.
For most teams, the biggest win from a predictive churn model is how much CSM time it gives back.
Monitoring is a time-consuming activity. Some of our CSMs have over 100 accounts. They can’t go through what every account is doing every single day. Being able to dial in on potential risks frees up a huge amount of time for our CSMs. One, to be intentional about who they’re following up with. Two, to spend more time with customers actually helping them get more adopted.
Customer churn prevention tactics that actually work in 2026
Once you have diagnosed and predicted, you have to act. Most retention advice from the 2018 to 2023 playbook (run a QBR, offer a renewal discount, schedule a check-in) still works, but it is no longer enough on its own. AI products need different moves.
The five moves below come from Kyle Poyar’s AI churn wave analysis, layered with what we see working inside Userpilot.
1. Move upmarket and embed in valuable workflows
The biggest predictor of healthy retention for an AI product is deal size. Above $250 a month, AI-native companies retain at roughly the same rate as B2B SaaS. Below it, the cancellation cliff is brutal.
“Moving upmarket usually means being more deeply embedded in business workflows, being integrated with more tools, and creating more differentiation compared to general-purpose LLMs,” Kyle writes. Translation: target real budgets attached to real workflows, not impulse buys attached to curiosity.
2. Deliver services alongside the AI
Palantir built the playbook. OpenAI is following it. The forward-deployed engineer model puts a human alongside high-value prospects during the prove-it phase, builds the customer’s first working version, and only then asks for the contract. Andreessen Horowitz wrote it up as “the FDE model trades margin for moat.”
For most B2B SaaS businesses, this looks less like a Palantir-style engineer and more like a high-touch onboarding manager, a one-hour kickoff call, or a 30-minute walkthrough of the highest-value workflow. Even that small investment cuts cancellation rates measurably.
3. Stop overselling on the first deal
Cassie Young is direct on this one. Overselling creates an expectation gap the product cannot close inside the first 90 days. The first 90 days are exactly the window where modern AI buyers decide whether the product was a real purchase or a “trial we paid for.” Land sharp, prove one valuable use case, expand later. Faster initial sales cycles, narrower scope, higher gross retention.
4. Narrow the gap between product release and customer adoption
Brian Balfour from Reforge recently told Kyle his top 2026 priority is accelerating product adoption. The release cadence in AI products has moved faster than customer cognition. Customers do not know what shipped last month, which means they cannot use it, which means they do not get value from it, which means their renewal calendar puts the product back in the “we paid for this and didn’t use it” pile.
This is where in-app announcements, secondary onboarding flows, and a resource center earn their keep. Every feature you ship needs a discovery path inside the product, not just a release-notes page. In-app announcements tied to behavioral segments outperform email by an order of magnitude for adoption of new features.
5. Sell more annual plans
Median NRR runs 10 to 20 points higher on annual plans than monthly. The mechanism is simple. Annual gives you 12 months to prove value instead of 30 days. It also signals seriousness on the customer side, which correlates with implementation effort, which correlates with activation, which correlates with renewal.
Make annual the default option in pricing. Ask for the annual upgrade in months two or three, when the user’s positive momentum is highest. If you need an incentive, offer a meaningful one. Grammarly’s annual discount is 60 % and it pays for itself in retention every quarter.
The lifecycle moves that still work
Beyond the five AI-era moves, the classic lifecycle plays still earn their keep when executed well.
- Lifecycle email marketing: Many SaaS teams stop emailing customers after conversion. Our PITT research found post-conversion campaigns are one of the most underused retention levers in the category.
- Win-back and loyalty programs: Inactive customers can be reactivated with personalised offers. Long-term customers can be rewarded with beta access, exclusive events, or pricing locks. Both compound customer loyalty over time.
- Proactive check-ins on strategic accounts: High-value customers churn silently if no one is maintaining the relationship. Tie the check-in to the customer’s success plan, not a calendar reminder. Centralise account-level usage and feedback so the CSM can see engagement health in one view.
- Behavioural targeting for expansion: The same usage data that predicts churn predicts expansion. Upsell opportunities live in the moment a user hits a usage spike or completes a milestone, not in the quarterly campaign calendar.
The Userpilot customer Cledara used in-app engagement to announce a new feature and saw the result land in days, not months:
“Within a week, we were able to register several dozen companies already saying they’re interested in the new feature. With email, you’d get the same number of responses within two months.”
— Gerard Masnou, Head of Support and Operations at Cledara. Read the full Cledara story here.
Customer churn is a whole-company problem, not a CS problem
The last point matters more than any individual tactic. Customer churn is whole-company operating health, not a metric the CS team owns alone.
Sales decides who comes in. If the deal was bad, no amount of onboarding fixes it. Onboarding decides whether the customer launches. If activation breaks, the AI churn cliff catches them inside 90 days. Product decides what is sticky. If the integrations and workflows are not strong enough, the customer is replaceable by Friday. Marketing decides what customers know they have. If product discovery breaks, customers see 30 % of what you ship and value it accordingly. Finance decides whether involuntary churn is an accepted cost or a fixable leak. The CFO who fixes the failed-payment retry logic recovers more revenue than the CSM running a save call.
The CS team’s job in this model is the early-warning system, not the last line of defence. The CSM team tells the rest of the company where the leaks are, and coordinates the response across sales, product, marketing, and finance.
The teams that get this right in 2026 will treat customer success the way Cassie Young calls for in her CS Renaissance piece: as a core operating philosophy, not a function. That is the difference between a company that survives the AI churn wave and one that becomes a case study in it.
How Userpilot helps with customer churn in 2026
Userpilot was built for the four-layer stack a modern customer retention program needs: behavioral data, in-product engagement, qualitative feedback, and predictive analysis.
- Userpilot Analytics centralizes product usage, funnels, retention cohorts, and feature adoption in one place. The same dataset feeds churn prediction, expansion targeting, and onboarding diagnostics.
- Session Replay turns the “why” behind a usage drop into a five-minute video you can share with product and engineering, without leaving the platform.
- User Feedback runs in-app surveys, NPS, and post-launch micro-surveys triggered by behavior. Quant signal, qual signal, one timeline.
- Workflows orchestrate retention campaigns across in-app, email, and mobile. Behavior-triggered, no developer dependency.
- Lia, our AI agent, runs the predictive model six months before renewal, surfaces churn risk and expansion opportunity, and writes the first draft of the in-app intervention.
If you are trying to reduce customer churn for an AI product, the biggest-impact move is to stop firefighting at renewal and start predicting at activation. Book a demo and we will walk you through what your churn-prediction stack would look like.
FAQ
What is the average customer churn rate for SaaS in 2026?
The global median monthly customer churn rate for B2B SaaS is around 3.5 percent. Enterprise SaaS runs lower (0.3 to 0.8 percent monthly). SMB SaaS runs higher (2 to 4 percent monthly). For AI-native companies, the median is much worse: 40 percent gross retention, with sub-$50 products at 23 percent GRR.
What is the difference between voluntary churn and involuntary churn?
Voluntary churn happens when a customer actively chooses to cancel: bad onboarding, no perceived value, better competitor, change in business need. Involuntary churn happens when a customer leaves unintentionally: failed payments, expired cards, organisational changes. Involuntary churn is 20 to 40 percent of total losses for most B2B SaaS businesses.
Why is customer churn especially high for AI products?
Three reasons. First, switching costs are structurally low: prompts are portable, integrations are MCP-shaped, data is easy to move. Second, AI products push for conversion immediately or near-immediately, which means users sign up as “trial-ers” but get billed as customers. Third, the time-to-value window has collapsed: if the customer does not see the result in the first session, they cancel before any classic churn signal fires.
What is the best way to predict customer churn?
Combine three data layers: usage signals (what they did), session replay (how they did it), and qualitative feedback or NPS (why they did it). Run continuous correlation analysis to find which patterns predict cancellation, then surface those as risk flags to your CSM team. Predictive models like Userpilot’s Lia can spot at-risk accounts up to six months before renewal.
How much can I improve revenue by reducing churn?
The Bain research most teams cite still holds. A 5 percent increase in customer retention increases profits by 25 to 95 percent depending on business model. Returning customers also spend up to 67 percent more than first-time buyers. In SaaS specifically, customer lifetime value compounds faster than acquisition spend pays back, which is why the CAC-to-LTV ratio rewards retention more than acquisition.
About the author