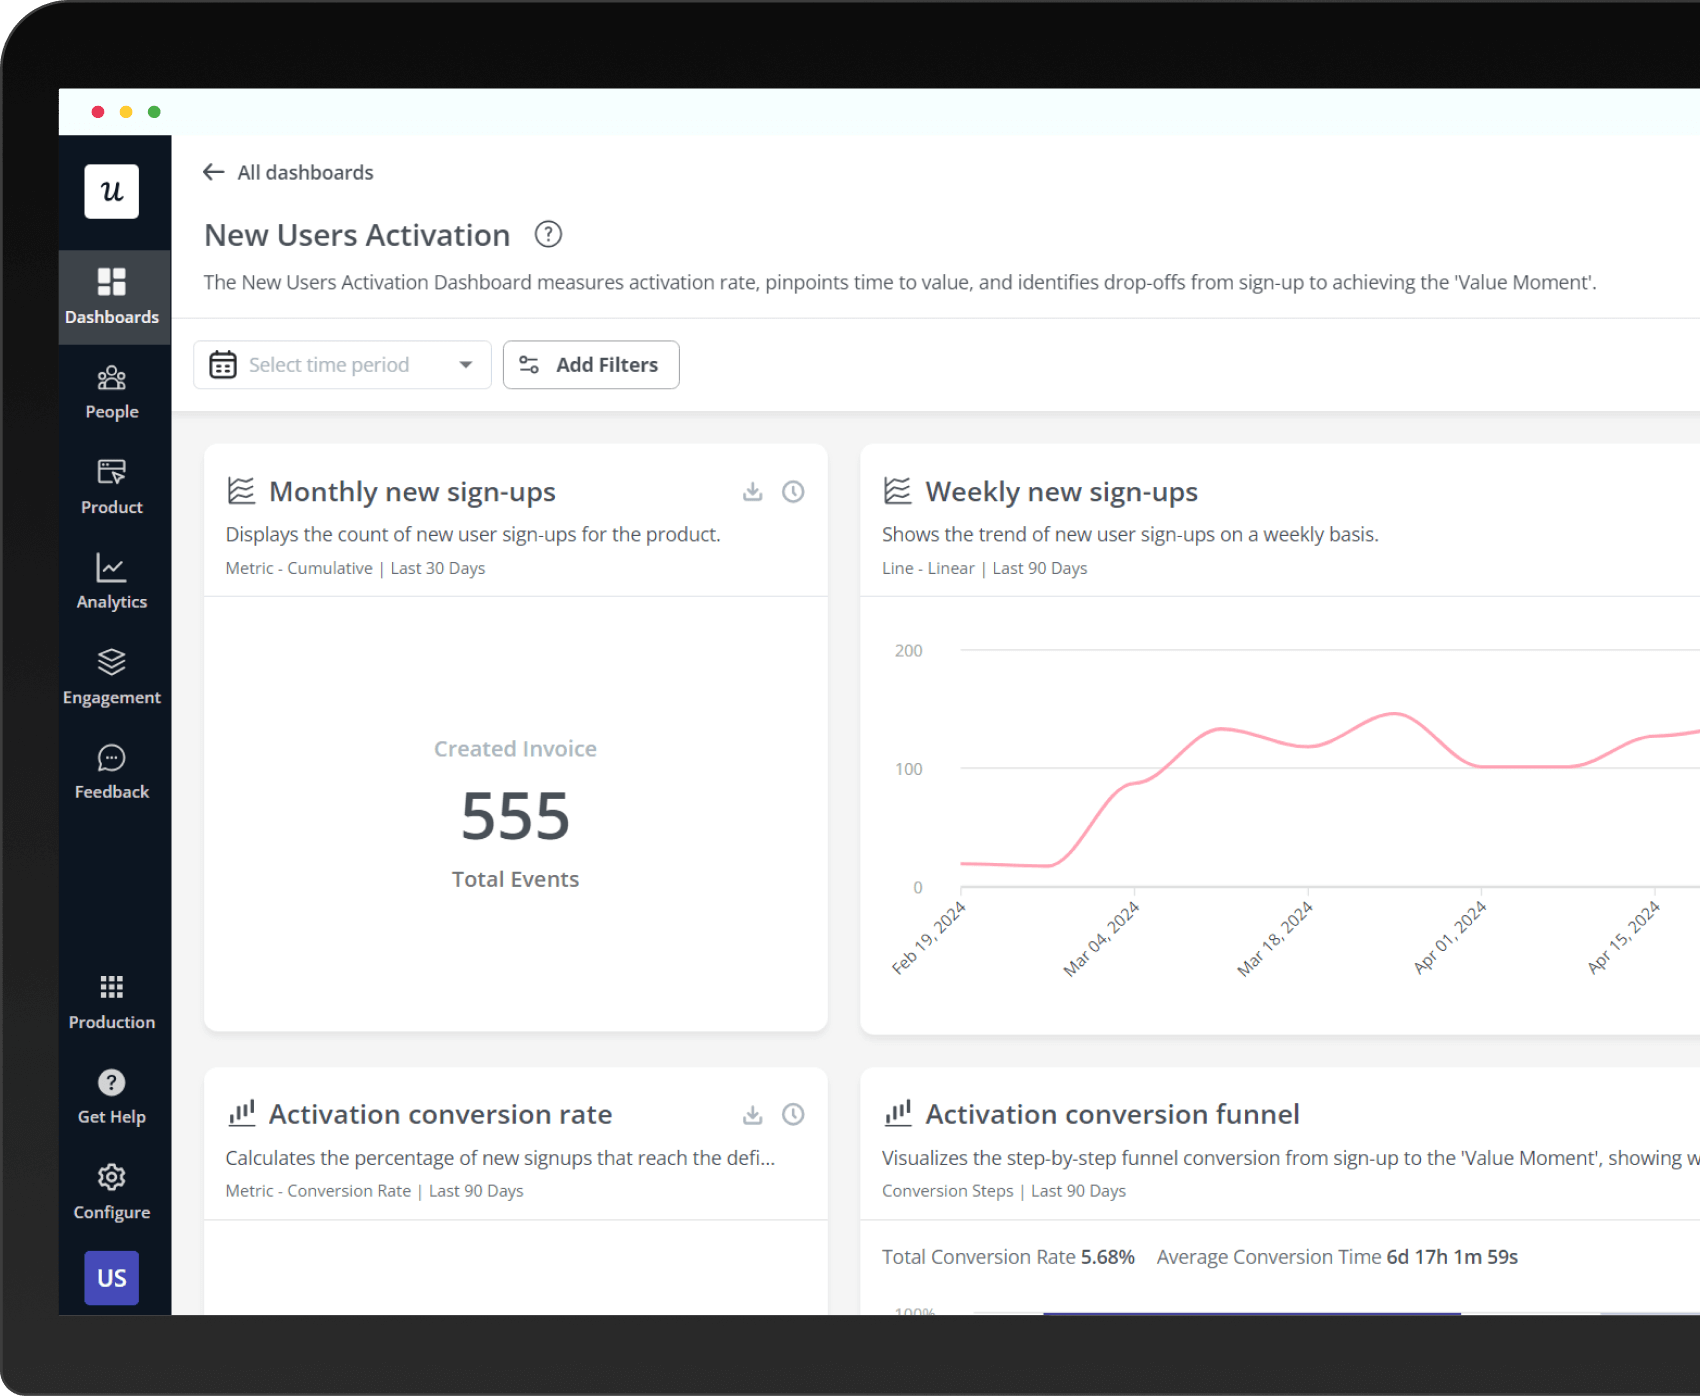
We collected first-party data from 62 B2B companies using Userpilot’s Activation Dashboard. This dashboard not only tracks the activation rate but also pinpoints the time to value (TTV) and identifies key drop-off points from sign-up to the Activation Point. The data is segmented by company size, industry and business strategy (PLG vs. SLG).
Smaller companies often focus intensely on user acquisition and engagement to establish themselves in the market.
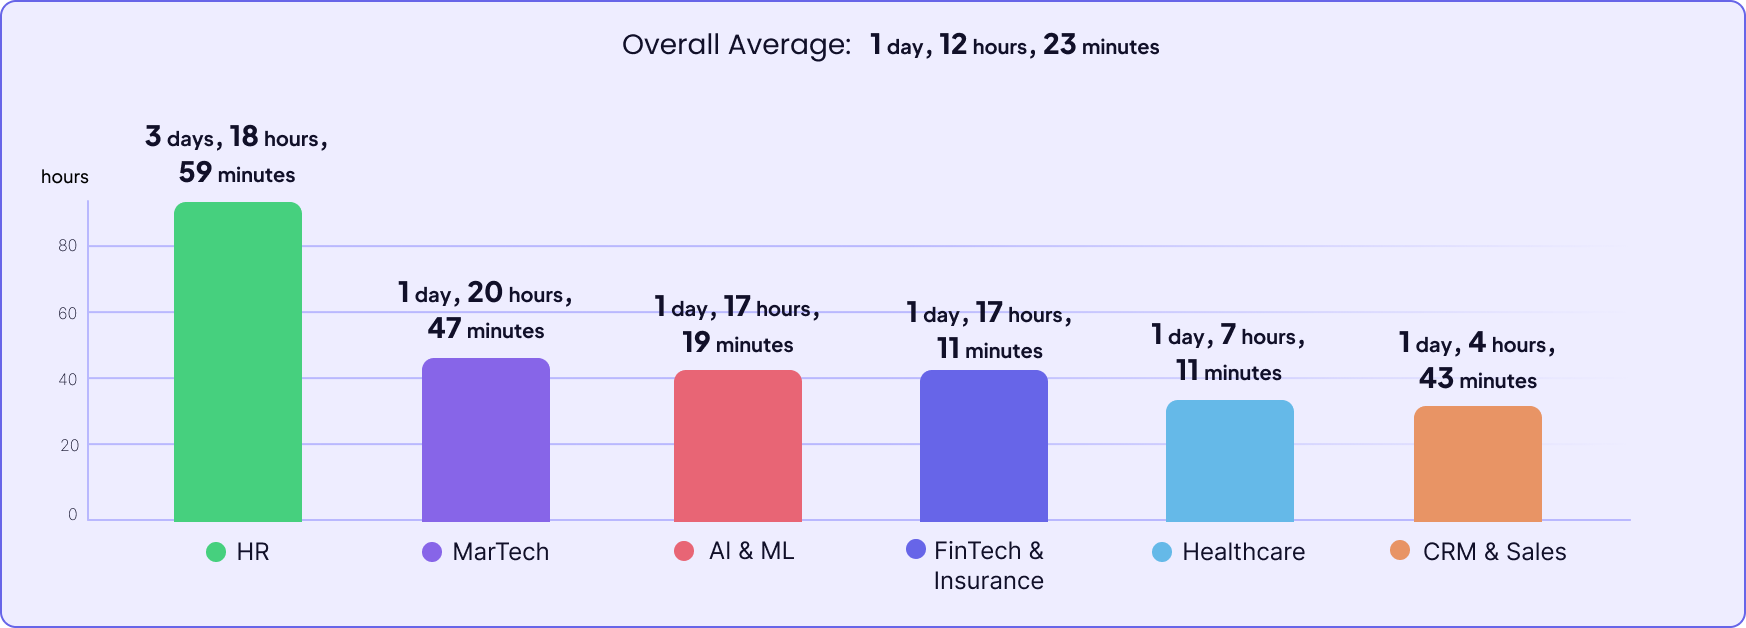
Mid-sized companies might struggle more with activation as they navigate the complexities of scaling, whereas the smallest and largest companies show better performance, likely due to their ability to focus intensely on user needs.
And larger companies have more resources to invest in effective marketing, customer onboarding, and user engagement strategies.
As Product-Led Companies often serve B2C or SMB-B2B customers, offering a free trial or freemium, their users may have a lower motivation to activate compared to enterprise users of products by Sales-Led companies – that often require an annual contract and payment up-front.
PLG models focus on the user independently exploring and adopting the product, which can sometimes mean a slower start. Users need to discover features and understand the value on their own, which can take time.
On the other hand, SLG companies often involve sales engineers and customer success managers in the process of customer onboarding, making it more guided and tailored to their needs – and possibly faster.
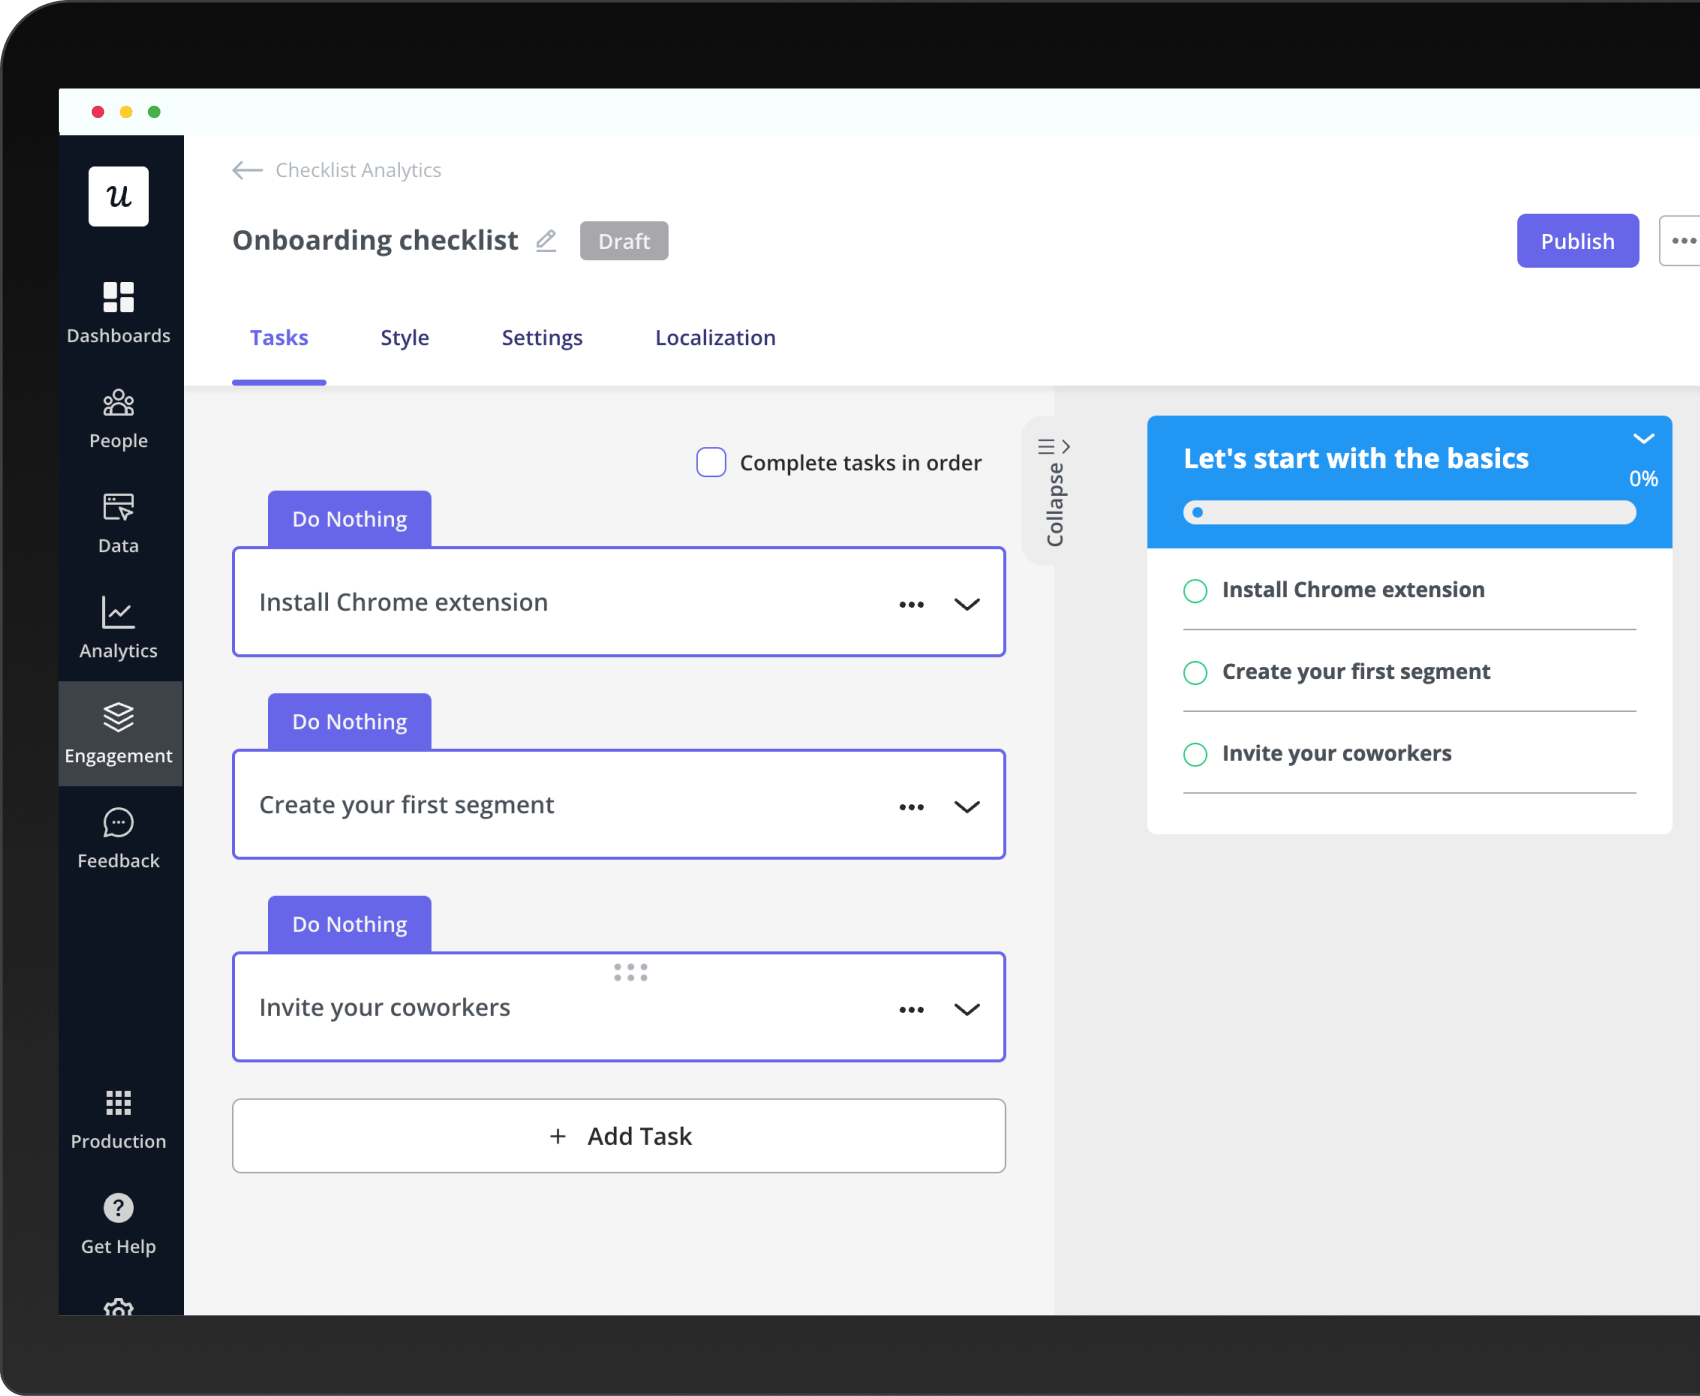
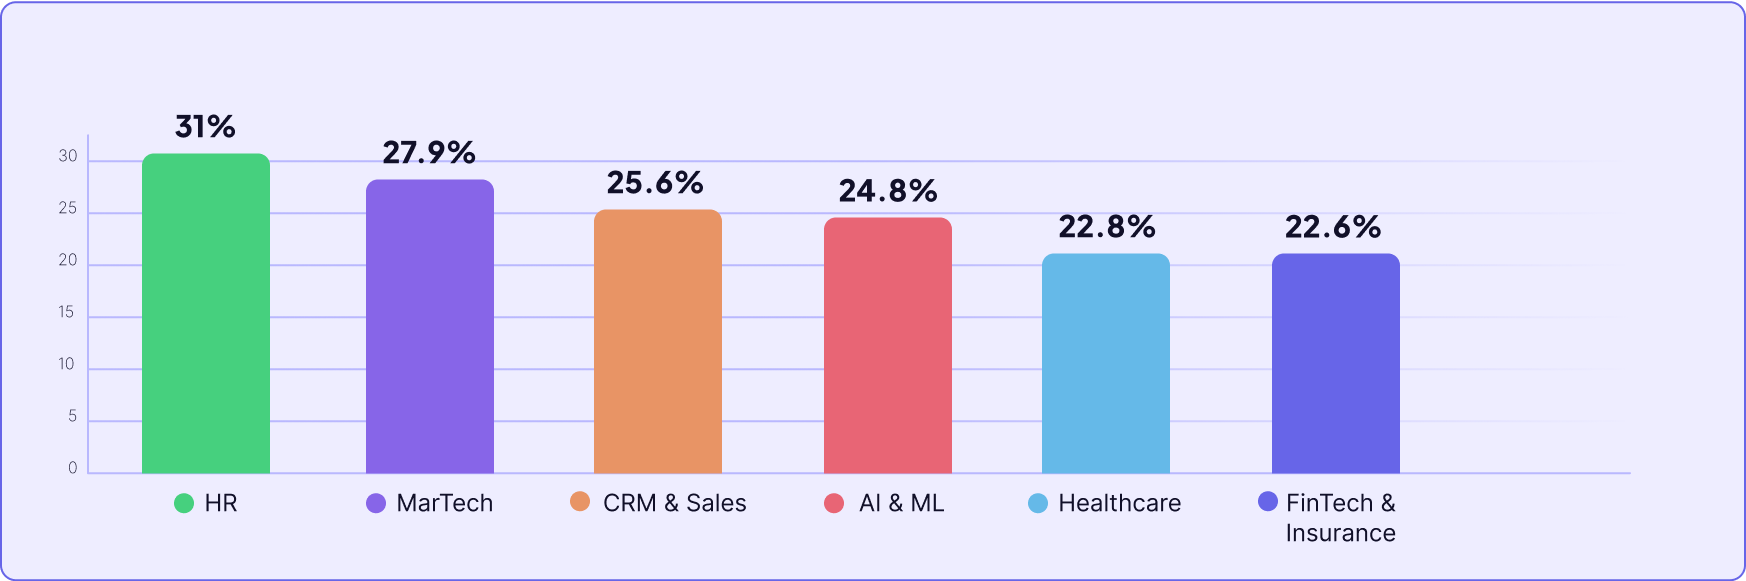
We analyzed onboarding checklist completion rates across 188 companies from different industries.
Smaller companies lead with the highest rates. As company size increases, there’s a slight decline in completion rates, particularly noticeable in mid-sized companies. However, the largest companies manage to improve their rates slightly, which could be attributed to their resources.
And again we have a surprising turn of events, SLG companies are outperforming PLG companies in onboarding checklist completion rates as well.
This outcome could be attributed again to the hands-on approach that SLG companies typically take during the onboarding process.
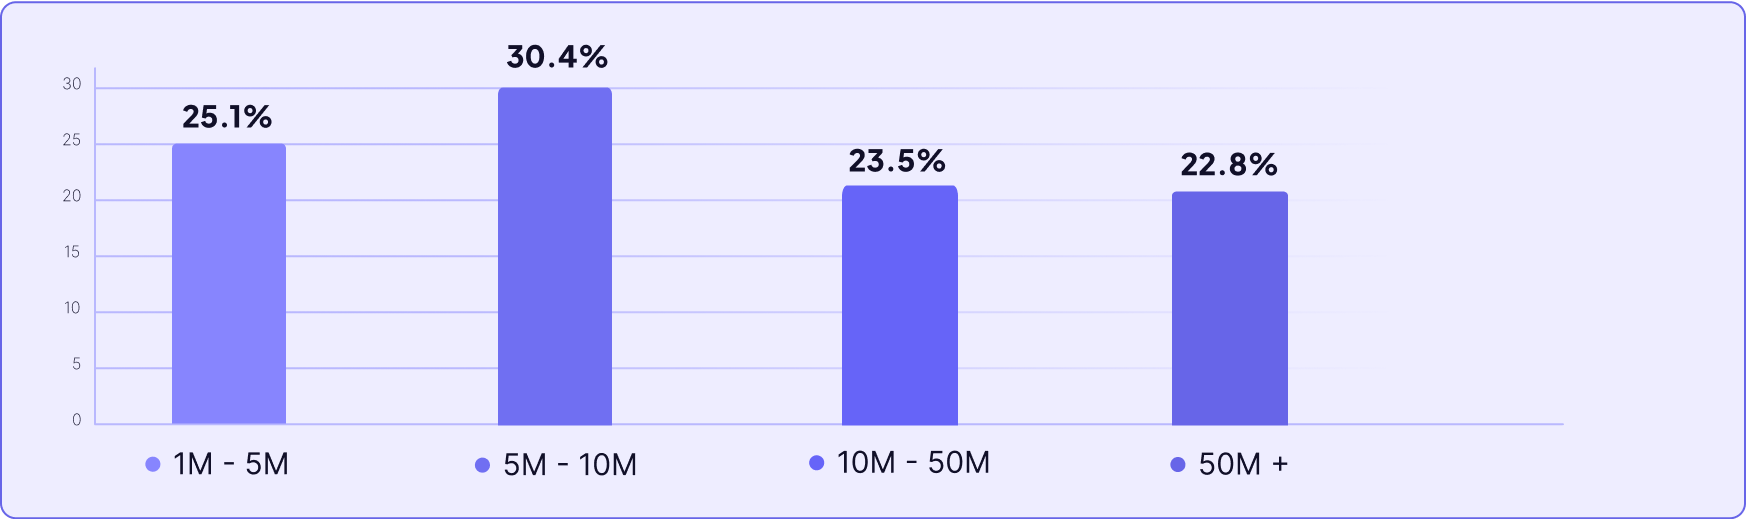
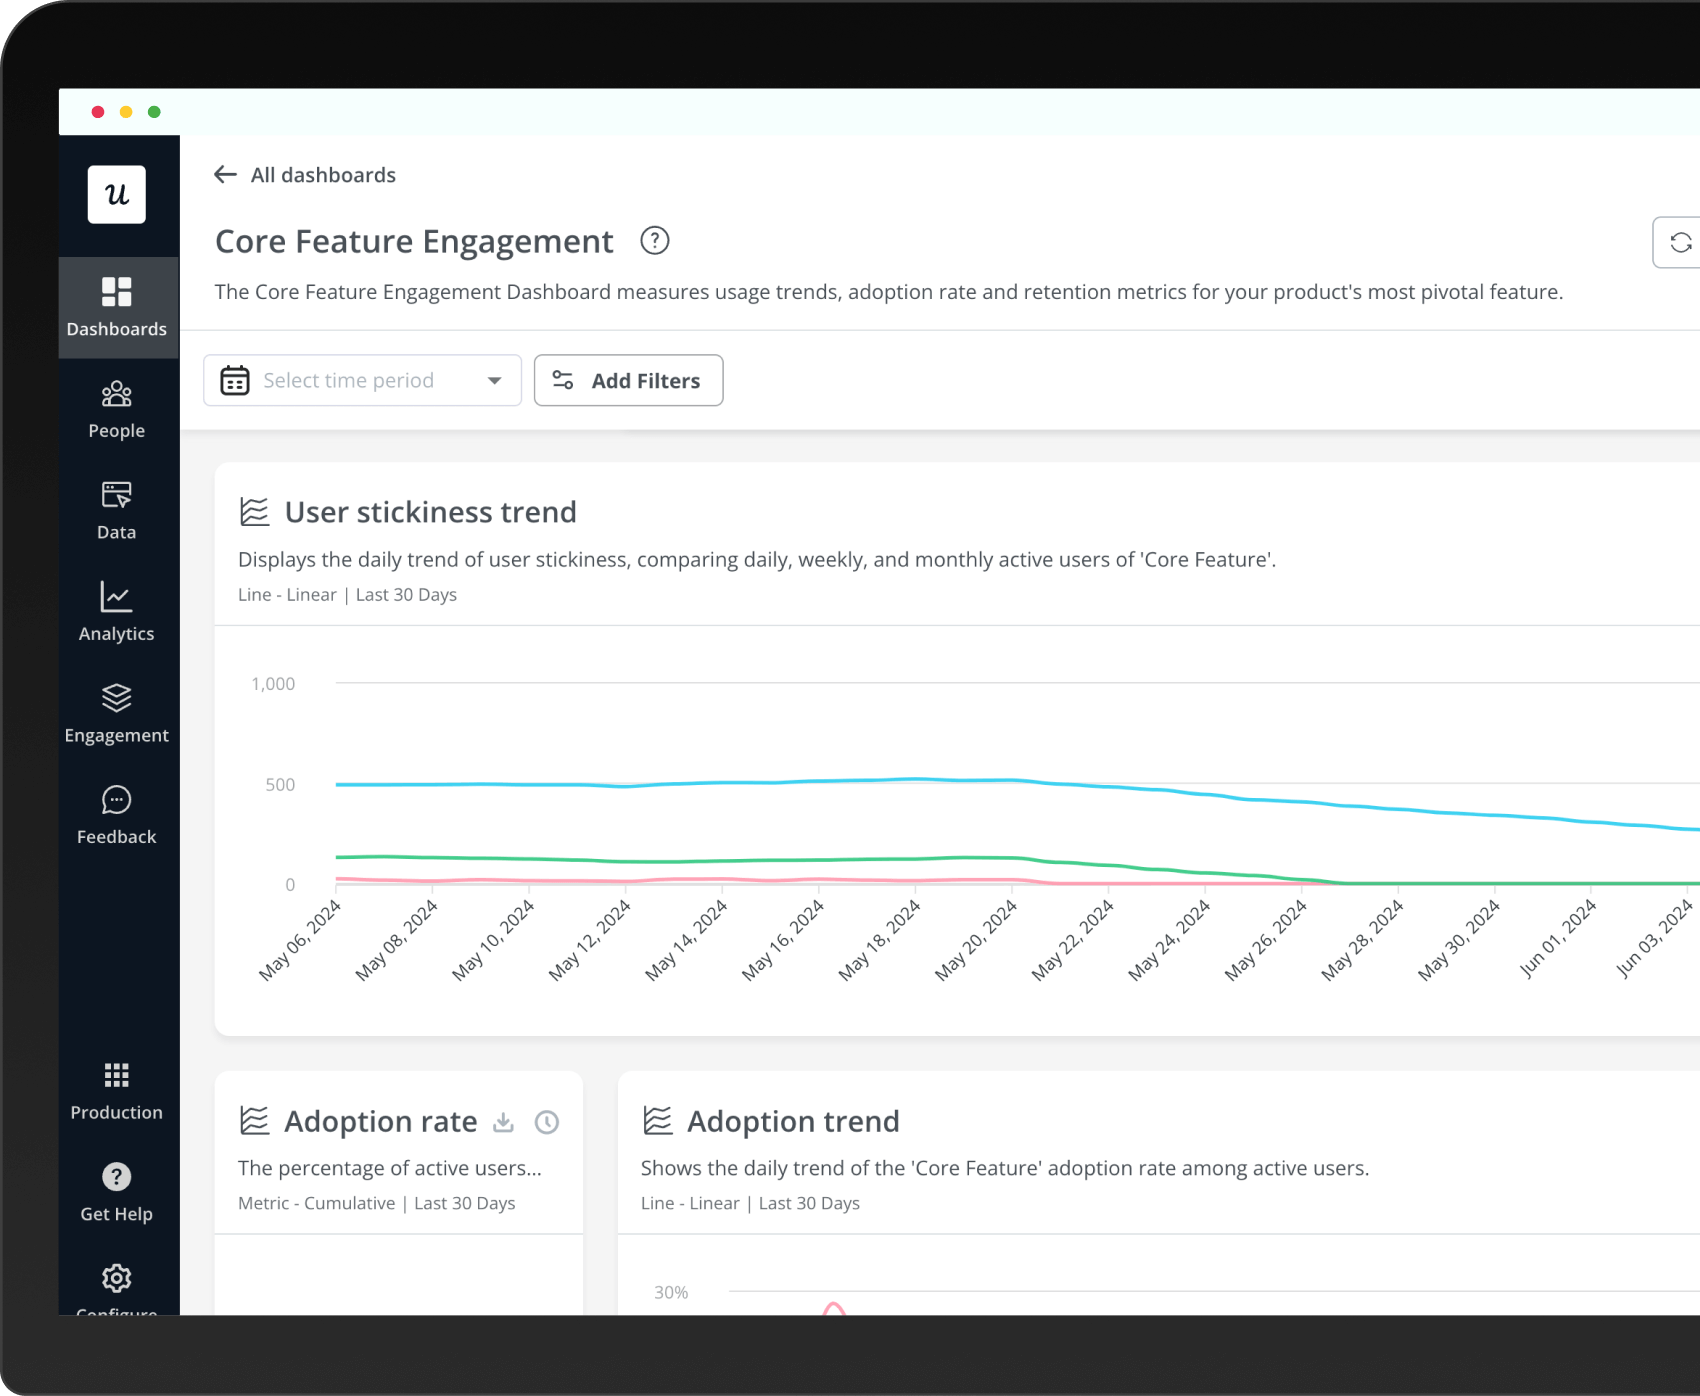
To see how the users engage with the core feature and how this correlates with the key activation rate, we grabbed data from the Core Feature Adoption dashboard in Userpilot for 181 companies that were using it at the time of writing.
There are no statistically significant correlations between company size and core feature adoption rate – although we can see that it tends to be slightly higher with smaller companies – which may be allocating more resources to more individual, personalized onboarding (or may just happen not to be large B2C behemoths with a fairly unmotivated audience base.)
Looking at the core feature adoption rates between Product-Led and Sales- Led companies, it’s interesting to note that SLG companies show a slightly higher rate at 26.7% compared to PLG companies at 24.3%. Again – if manual onboarding by the CSMs and sales engineers correlates with higher user activation rate, it’s expected it would also correlate with a higher core feature adoption rate.
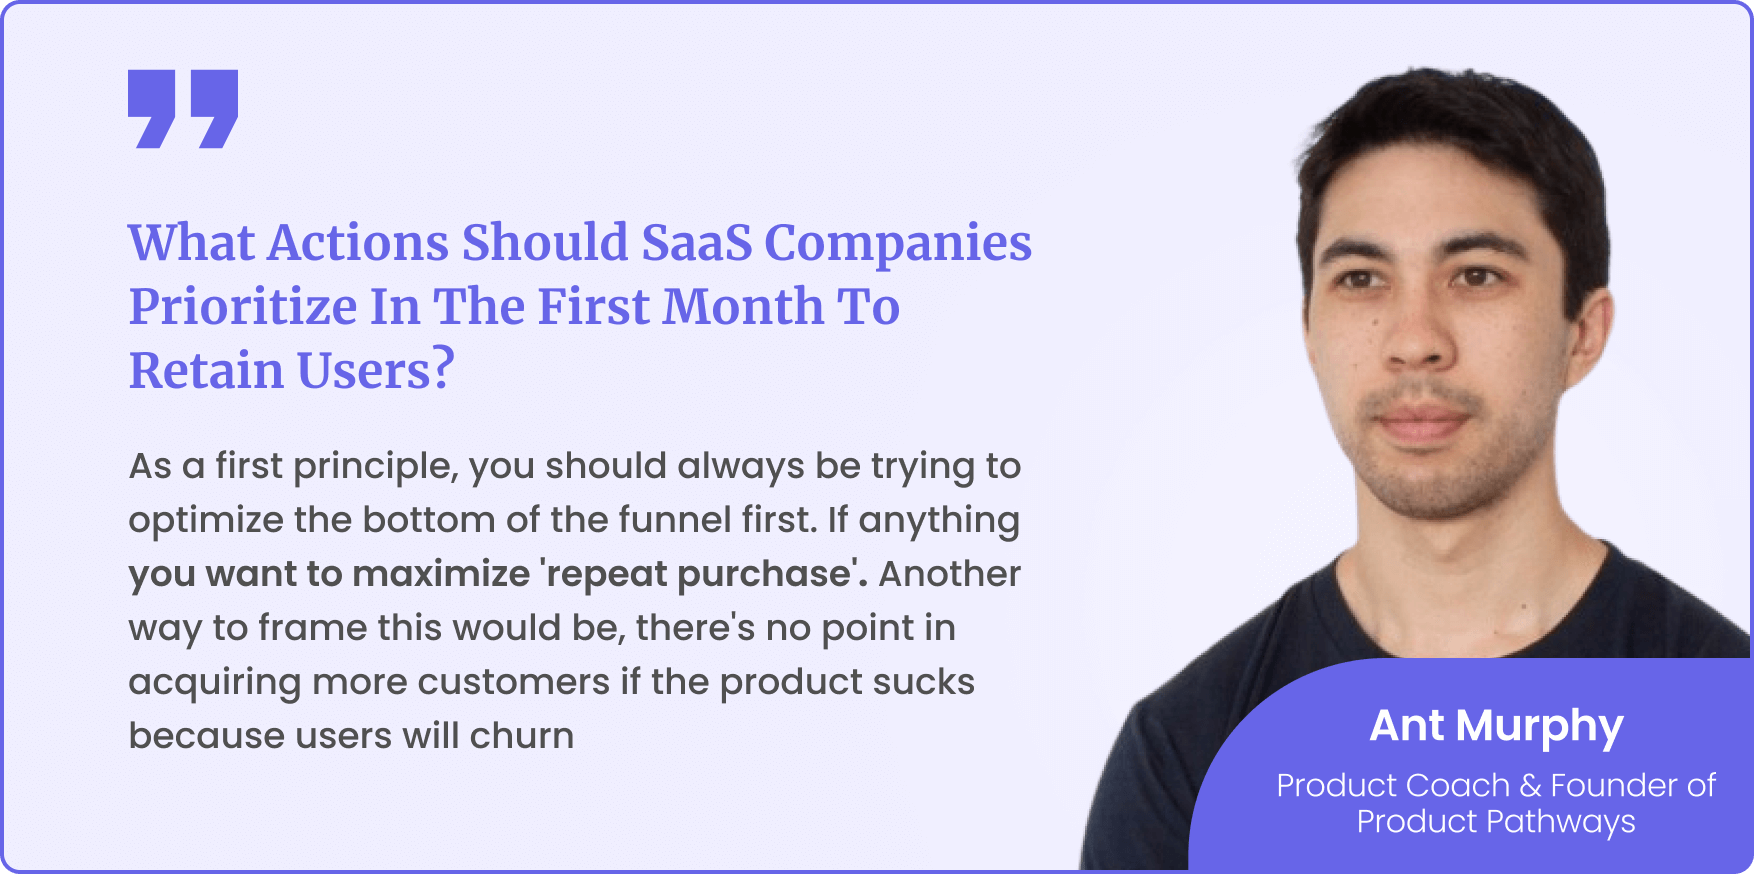
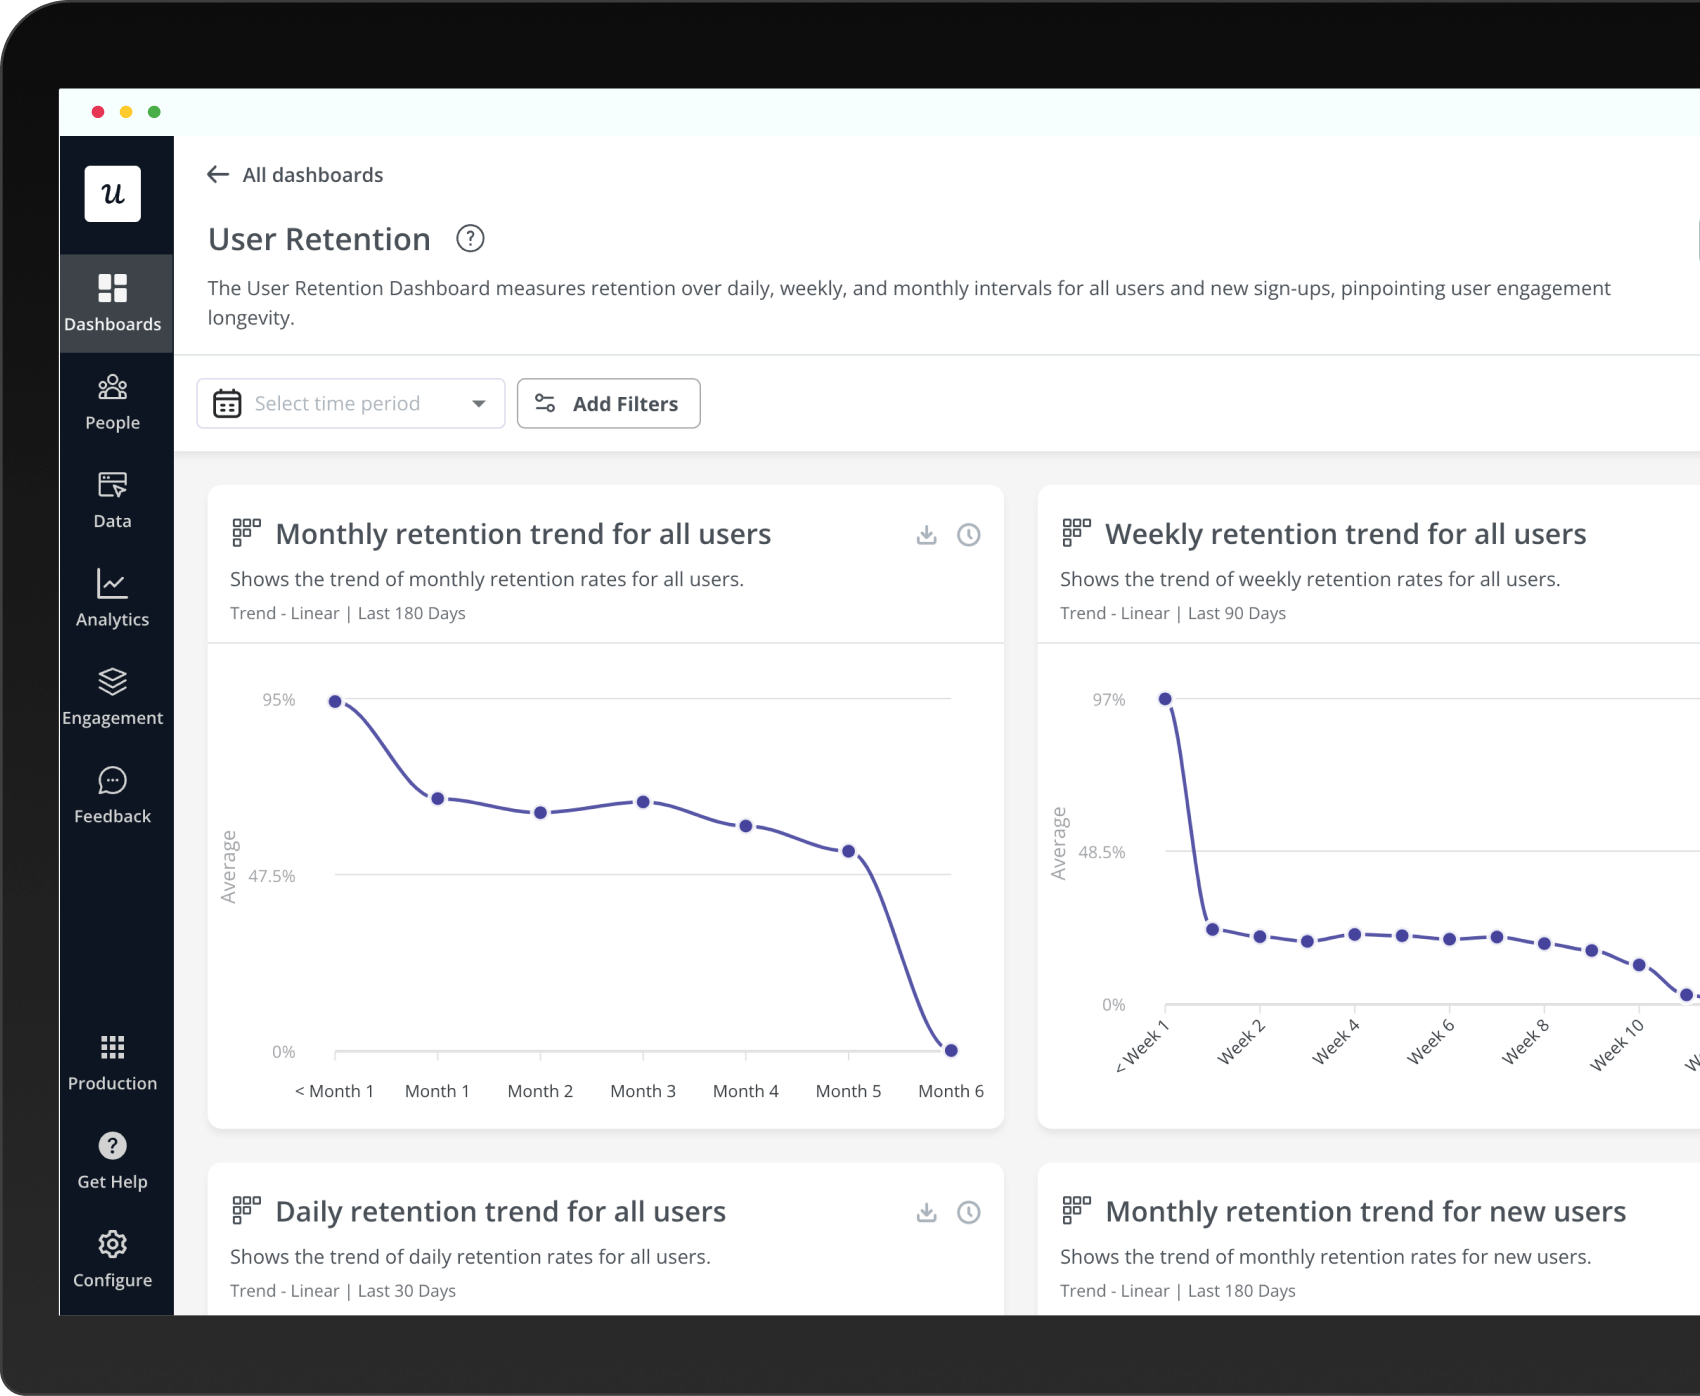
Month 1 retention rate measures the percentage of users who continue to use the product or service one month after their initial activation or sign-up.
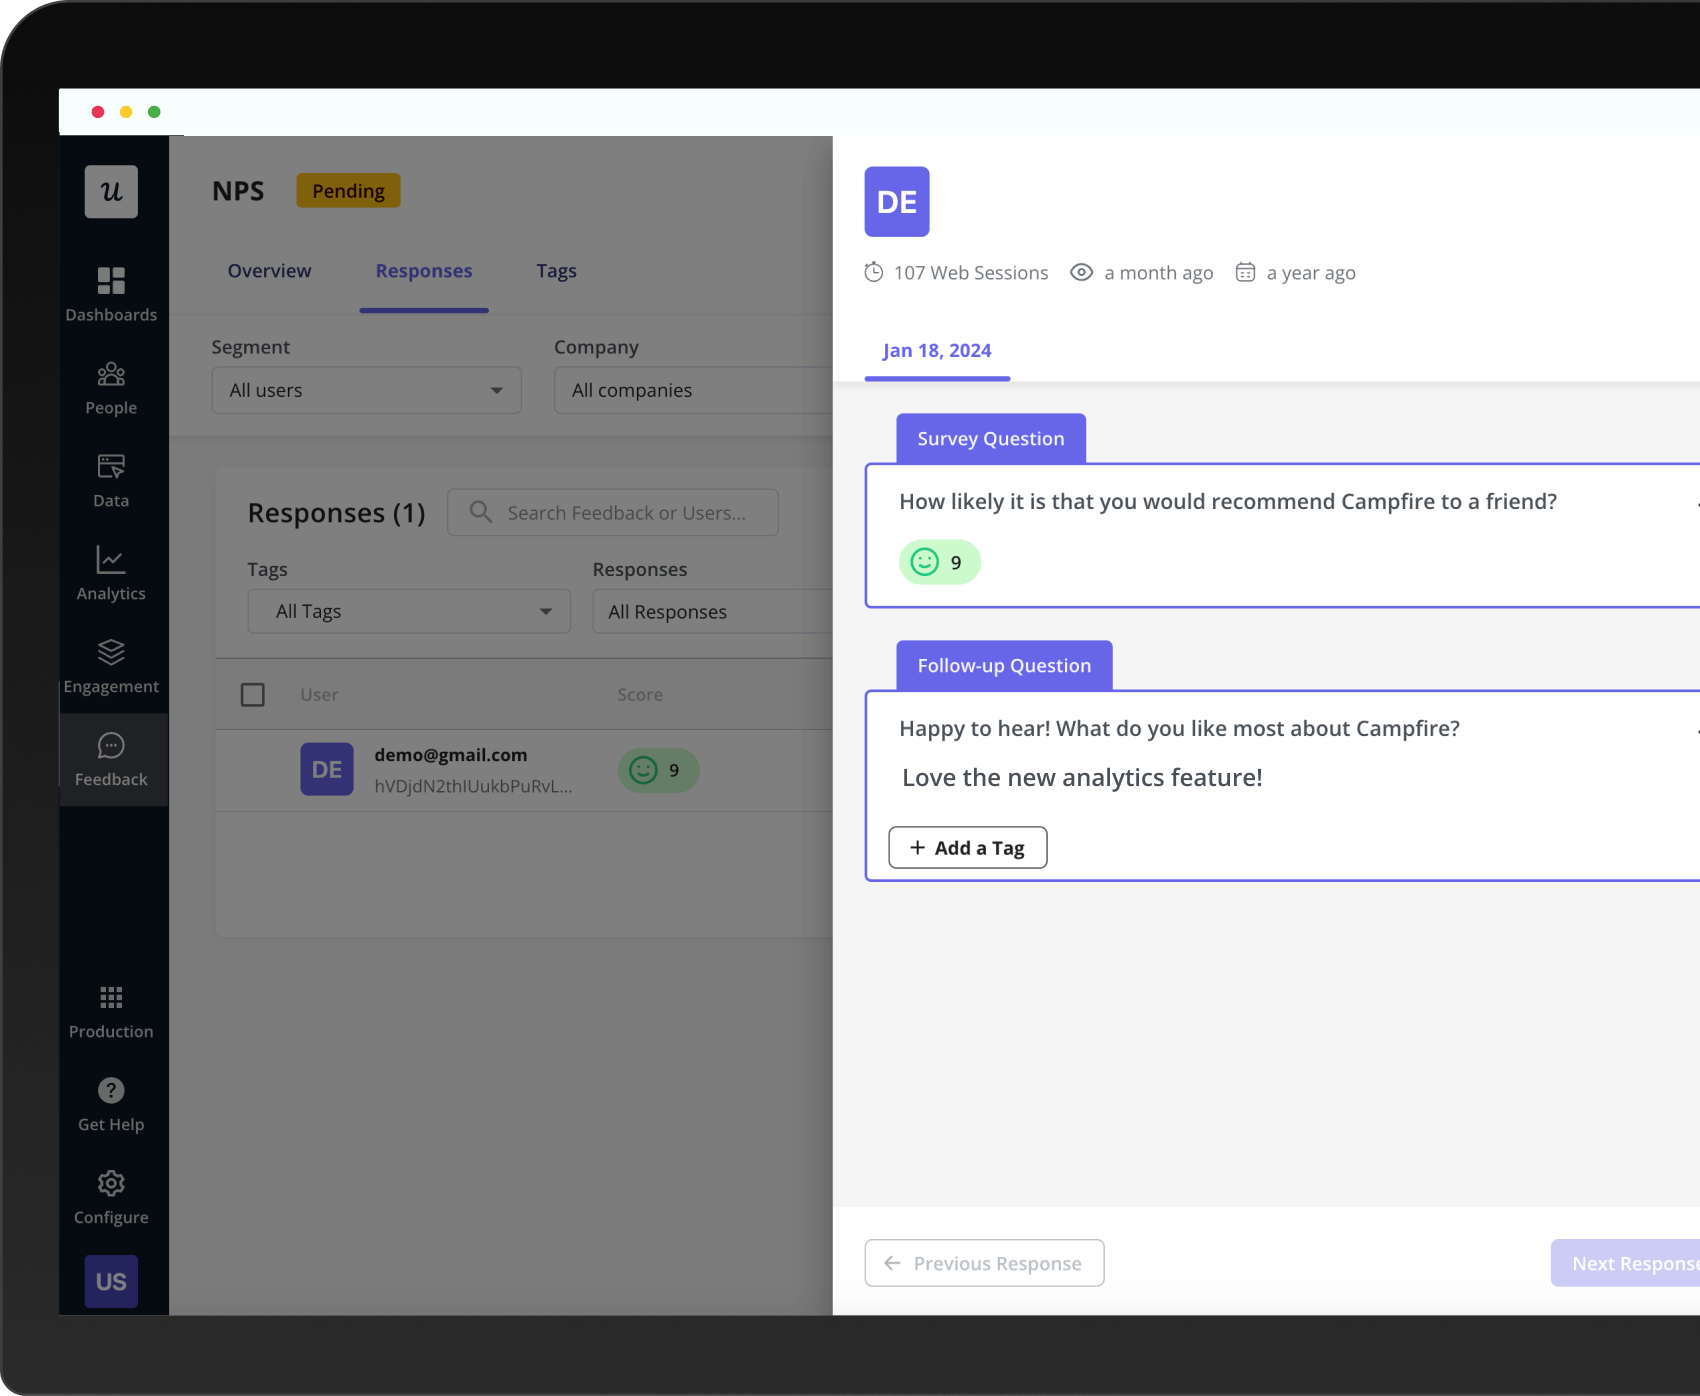
We analyzed 229 SaaS companies to get the average NPS. For this analysis, we used our NPS Dashboard, which is specifically designed to track and interpret customer loyalty and satisfaction metrics. Here you can track how many views your NPS surveys have gotten, the number of responses, the overall response rate, and how the score has been trending over time.
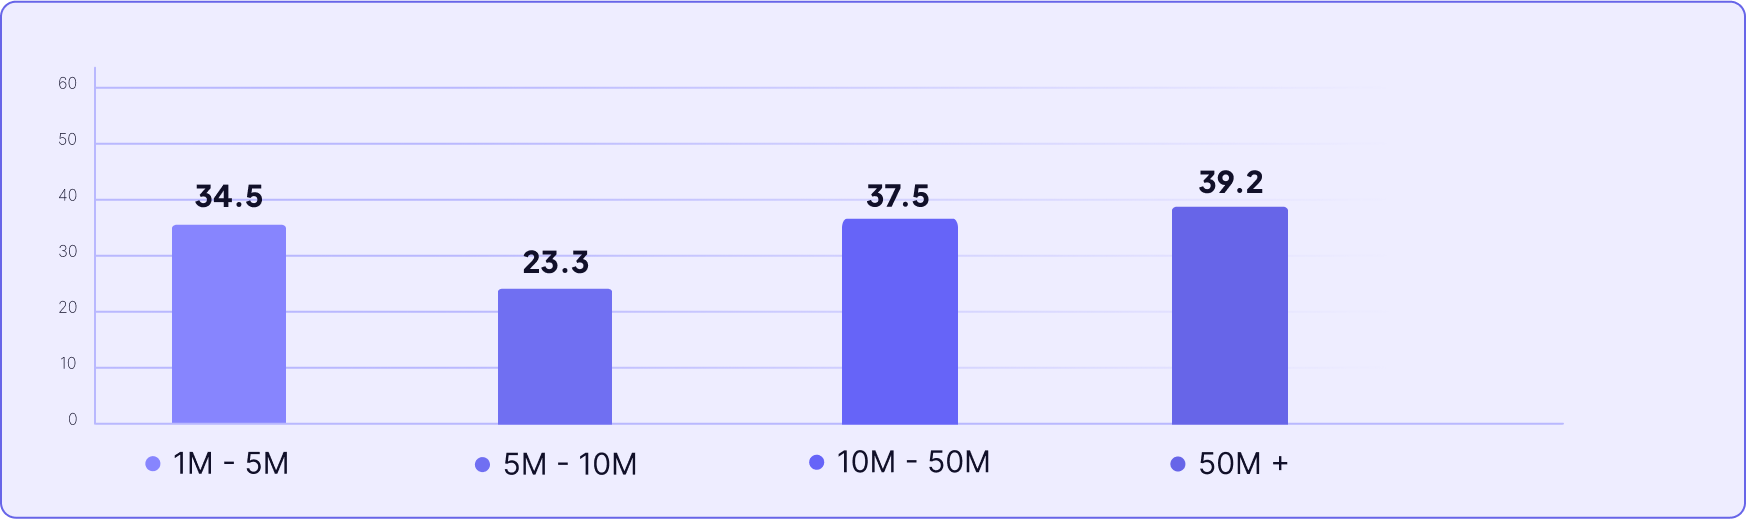
Looking at the NPS scores by company size, there’s a clear trend where generally, as companies grow in revenue, their NPS tends to improve.
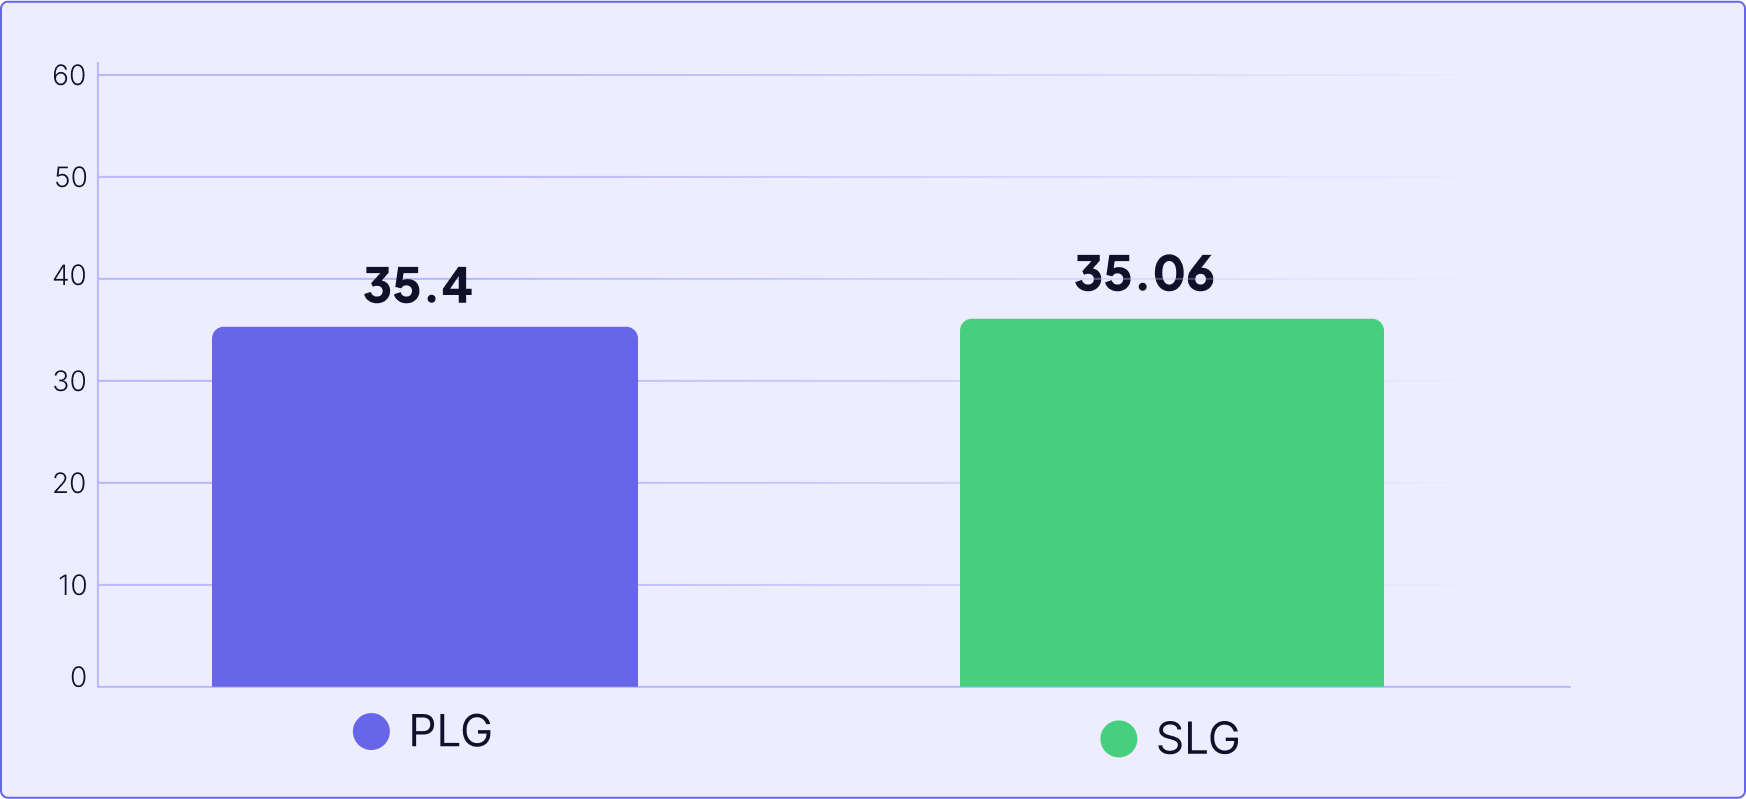
Both scores are fairly close, showing that the overall customer satisfaction and willingness to recommend the services or products are somewhat similar between these two growth strategies.