If you really want to build a product your users love, removing user friction entirely is not the answer.
If friction points were universally bad, no product would have security checks, confirmation dialogs, or multi-step workflows. Such critical steps prevent users from making irreversible decisions.
The goal isn’t to eliminate all friction. Instead, it is to identify the right and wrong types of friction and remove the bad friction to create a holistic user onboarding journey.
And that’s where using product analytics can help. In this guide, I’ll walk you through:
- What types of friction should be removed?
- How to use product analytics to remove friction.
- What to do once you find friction points.
- How Userpilot helps you manage friction.
Try Userpilot Now
See Why 1,000+ Teams Choose Userpilot

What types of friction should you remove?
Some friction points are necessary, like adding extra steps before canceling an account. It saves you from churn and lets your users think through their decisions. But the friction you didn’t plan for? That’s where problems lie.
Let’s understand the types of friction that hinder user retention:
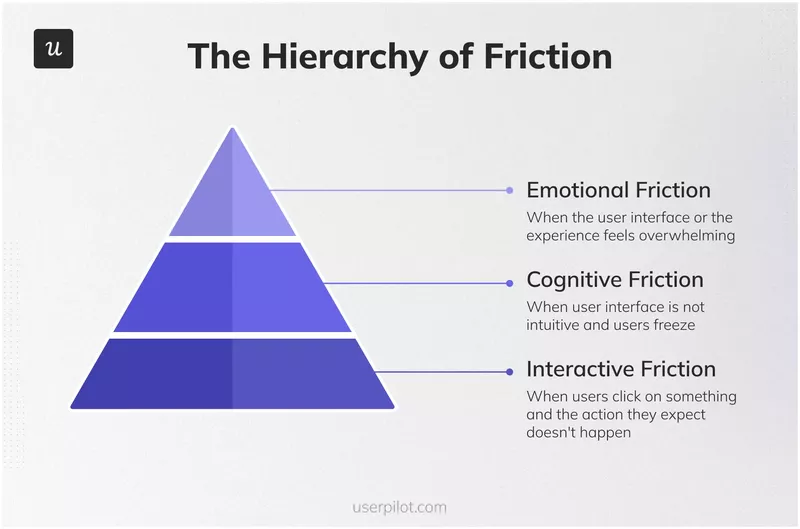
- Interaction friction: Users experience interaction friction when the product resists them physically. One example is when you’re rage-clicking at slow-loading pages, unresponsive buttons, or form fields that stubbornly refuse to accept input.
- Cognitive friction: Cognitive friction happens when users pause, second-guess themselves, or abandon the task because the next step feels unclear. It can occur due to poor labeling, inconsistent design patterns, or workflows deviating from users’ expectations.
- Emotional friction: Emotional friction stems from a mismatch between the product’s pace and the user’s expectations. It often happens in feature-rich products, where too many features compete for attention. For example, when I first signed up for a new note-taking app, I was bombarded with pop-ups. While it’s a great way to learn about the product, I clicked away because I wanted to start recording my meetings immediately.
How to use product analytics to identify friction?
As I mentioned earlier, a little bit of friction can actually be a good thing. This makes “reducing friction” a deceptively tricky concept, especially with the abundance of product analytics data available to product teams today.
So, how do you pinpoint those moments of unwanted friction within your product? It starts with asking the right questions. Before you even open your analytics dashboard, take a step back and consider:
- What are the core jobs to be done that users hire your product for? What are the critical paths they take to achieve those goals?
- Where do you expect users to encounter challenges or confusion? Are there any known complexities in your onboarding flow or key features?
- What feedback have you already gathered from users? Are there any recurring complaints or requests for support related to specific areas of your product?
Having such information in mind, here are the methods you can use for finding friction:
Are You Removing the Right Friction?
Not all friction is bad, but “accidental” friction kills retention. Take this quick check to see if you are using product analytics to remove friction effectively.
How do you currently identify “Rage Clicks” or unresponsive elements?
You see a high drop-off rate in your signup funnel. What’s your immediate fix?
Do you track “Time to Value” for new users?
Smooth Out the User Journey
Don’t let hidden friction kill your growth. Userpilot helps you spot struggle points with analytics and fix them instantly with on-screen guidance.
1. Look at sudden changes in product usage
When you have a good understanding of your users’ jobs to be done, you can start to identify potential friction points by tracking changes in feature usage.
If you see a sudden spike or drop in the usage of a particular feature, it could signal interaction friction. However, you’ll need a robust product analytics tool to monitor these fluctuations effectively.
Here’s how I typically do it in Userpilot:
We have these features called auto-capture and visual labeler that allow you to record meaningful user actions automatically. This means you’ll always have quantitative data readily available for analysis.
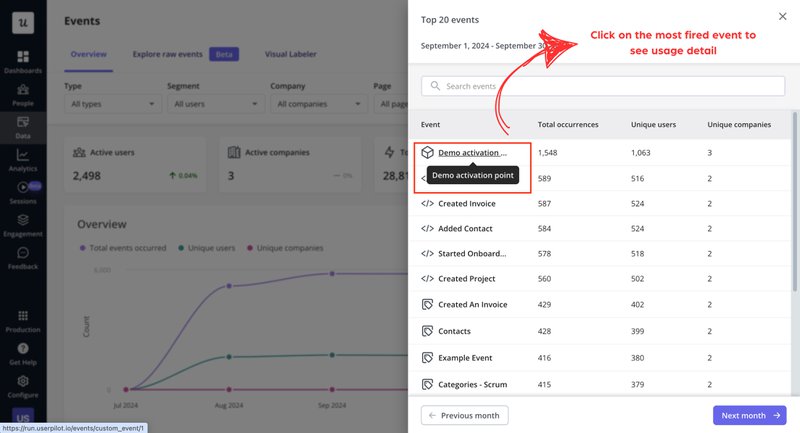
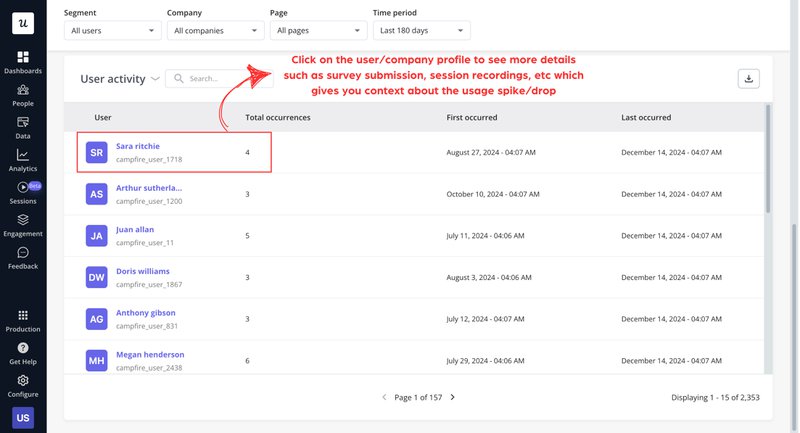
If I ever spot sudden changes in product usage, I can easily click on the spike or drop in the chart to see exactly which event is causing the change. From there, I can explore a list of users who triggered that event and access their profile data, including session replays, survey responses, and more. This gives me valuable context to understand the “why” behind the change and identify any potential friction points.
2. Use path analysis to understand customer journey experience
When we map out the user journey, we often envision an ideal “happy path” – the perfect sequence of steps users should take to achieve their goals. But in reality: Users interact with features in unexpected orders, skip steps, and sometimes forge their own paths entirely.
Take my experience with a note-taking app, for example. I was eager to try out the “recording summary” feature, so I jumped straight into it. I completely bypassed the “how to integrate with Google Calendar” step because I already knew how to do that.
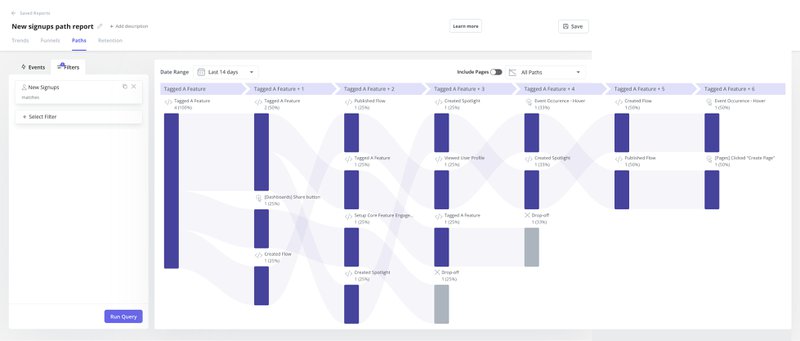
That’s where path analysis comes in. You can uncover those moments of cognitive friction – the points where users get lost, confused, or simply deviate from the intended path.
Userpilot’s path analysis can help you visually map this out. For example, you can group users by sign up dates and see 10 steps users take after signing up.
Sometimes, the path users create for themselves is better than the one you designed. When that happens, listen to your users.
3. Examine major funnel drop-offs for potential friction
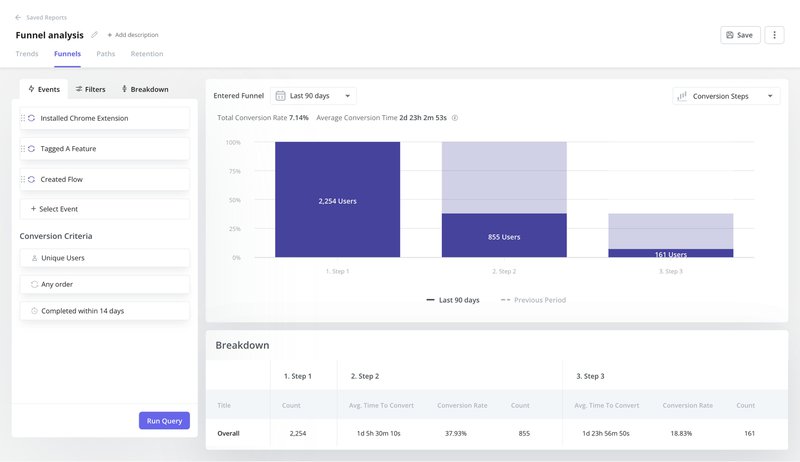
Funnels show you the drop-off points, like signups that never finish onboarding or trial users who don’t even use the key feature.
Userpilot’s funnel analysis helps you identify trends and visualize user interactions. For instance, if 40% of users leave midway through a workflow, something in that stage needs rethinking. Don’t assume the whole process is broken. Focus on the spot where most users give up.
This is exactly the challenge that Beable, a learning platform, was facing: They were struggling to demonstrate the value of their product to students, leading to low engagement and high drop-off rates.
By using Userpilot’s funnel analysis and survey features, Beable was able to pinpoint the friction points in their product flow and make targeted improvements. The result? A remarkable 77% increase in student participation!
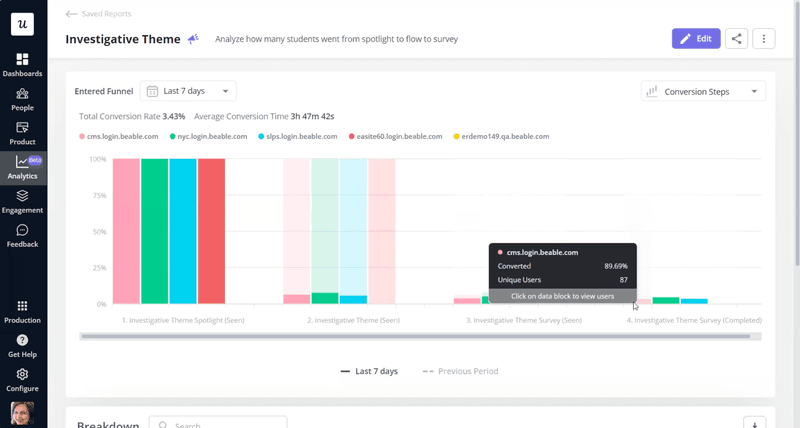
Learn how Beable leveraged Userpilot Analytics to increase app engagement in more detail!
4. Spot bugs and usability issues with session recordings
Path and funnel analysis tell you where users struggle during the customer journey. Session replays give valuable insights into why.
With Userpilot, you can pull up the session history of individual users, watch the exact flow that led to a bug, and even share clips with your engineering team. This way, engineers, designers, and product managers can easily see and fix what went wrong without harming conversion rates.
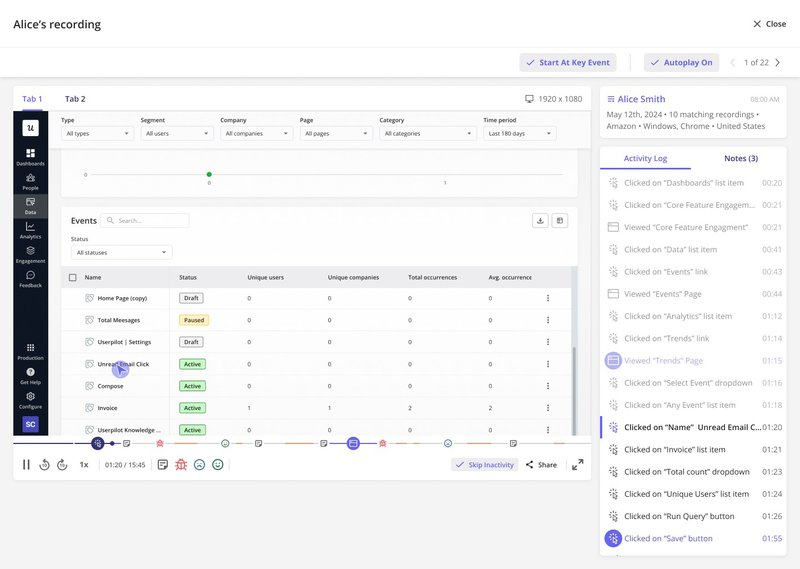
You can even use timestamps and descriptive labels in your session clips. This makes it easier for cross-functional teams to understand the product data and prioritize the bug fix quickly.
What should you do with friction?
Okay, so you’ve identified some friction points in your product. Now what? It’s tempting to jump right into “fixing” things, but I’ve learned that the best approach is to take a breath and gather more information first.
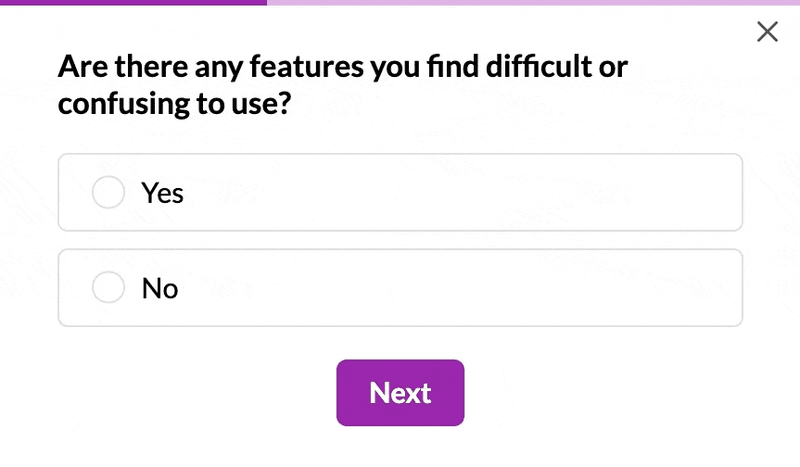
Before you decide whether to remove friction points, talk to your users. With Userpilot, it’s easy to trigger a targeted in-app survey to users experiencing friction, like this one below:
Some friction points signal a deeper product issue that calls for a redesign or added functionality. Other times, your users just need a nudge, like a clearer tooltip or a better CTA. Here’s how to handle both:
Inform product improvements
When I’m investigating user behavior and encounter friction points, I often notice areas where the product itself could be improved.
Here are a few scenarios where friction can help with product enhancements:
- Bugs & performance issues: Let’s be honest. Nobody likes encountering errors, waiting for pages to load, or wrestling with broken features. If I see this happening repeatedly, it’s a clear sign that some bug fixing is in order.
- Complex or inefficient workflows: Remember those path analysis diagrams we talked about? Sometimes they reveal that users are taking the scenic route to reach their goals – and not in a good way. This might mean the current workflow is too complex or inefficient. So you might need to simplify the process and remove unnecessary steps.
- Missing functionality: Sometimes, those friction points you uncover through path analysis or user surveys actually highlight what your product is missing. If you see users consistently jumping to other tools or struggling with workarounds and it makes sense to add such features, do consider adding them. For example, let’s say you have a project management tool, and you notice users frequently exporting data to spreadsheets to create custom reports. This could indicate a need for a built-in reporting feature within your product.
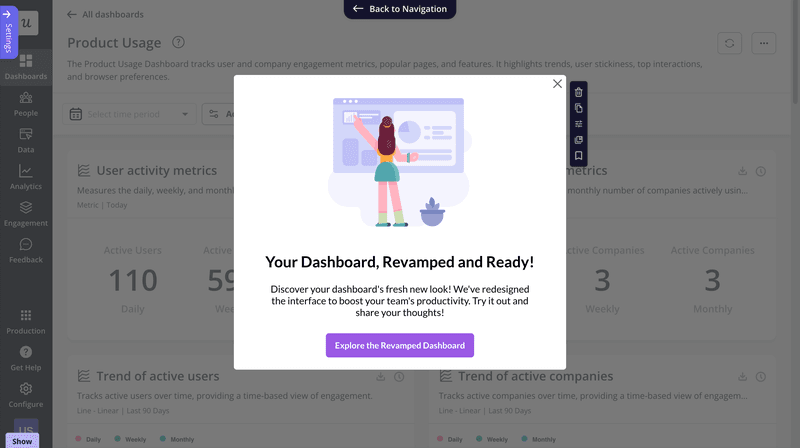
When you’re done with all the improvements, it’s important to keep your users in the loop. A simple in-app notification can do the trick, like this:
Optimize existing in-app guidance
Other times, friction isn’t about bugs or missing features; it’s simply about guiding users effectively through the complexities of your product.
This is especially true for those powerful, feature-rich products that are essential for users’ jobs to be done but might have a steep learning curve.
If you see users dropping off at certain points in the user journey, even though the functionality they need is present, it’s a sign that your in-app guidance might need a tune-up.
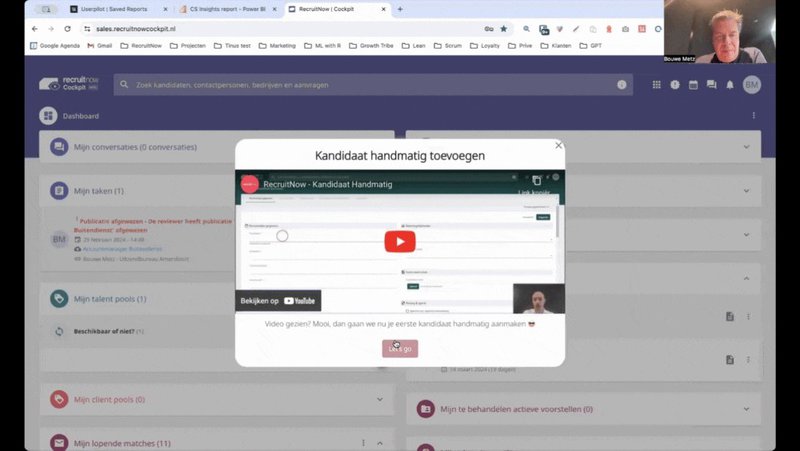
Take RecruitNow, for example. Their product complexity was causing friction for new users, leading to high drop-off rates during onboarding.
Initially, RecruitNow relied heavily on face-to-face training sessions. However, as their customer base grew, this approach became unsustainable. They needed a more scalable solution to combat friction and improve user engagement.
By using Userpilot to create interactive walkthroughs, video tutorials, and a resource center, RecruitNow was able to provide personalized in-app guidance that addressed the specific needs of their users. They even used Userpilot’s localization features to tailor the experience for different regions.
Looking for a solution to manage user friction effectively?
You can’t avoid friction entirely. It’s a natural part of the user experience. But it doesn’t have to be a drag. With the right tools and strategies, you can effectively pinpoint friction to create a better experience for your users.
Userpilot equips you with everything you need to tackle friction head-on. From powerful product analytics software and personalized in-app guidance to user feedback tools, we help you leverage friction for product growth.
FAQ
What is product friction?
Product friction is anything that hinders or slows users from completing tasks. Examples include confusing steps, extra clicks, or complex flows that lead to customer churn and dissatisfaction.
What is an example of good friction?
A confirmation step before deleting data or canceling accounts is good friction. It helps prevent irreversible errors and ensures users consider the consequences of important actions.
What does it mean to remove friction?
Removing friction means eliminating unnecessary steps or barriers that slow users down. However, you should maintain certain essential measures to ensure security, compliance, and thoughtful user decisions.

