
How does tracking your digital experience analytics help you retain users, remain competitive, and grow your business?
In this article, we cover:
- What digital experience analytics is and why tracking these data points is important?
- Who benefits from measuring your digital experience?
- The main method for tracking your customer experience is data analytics.
- How to choose the right digital experience analytics solution for your team.
Let’s get started.
Try Userpilot Now
See Why 1,000+ Teams Choose Userpilot

What is digital customer experience?
Digital customer experience covers the interactions that customers have with your brand online across the entire customer journey.
That can include interactions on mobile apps, your website, social media, or your product dashboard.
What is digital experience analytics?
Digital experience analytics refers to the process of monitoring user behavior across your digital channels, collecting product usage data at multiple touchpoints, and analyzing the results.
The purpose of customer experience analytics is to improve the customer journey at various points along the way in order to drive conversions, reduce friction points, and increase revenue.
Benefits of using digital customer experience analytics
There are three main benefits to tracking digital experience analytics:
Understanding the underlying data and making data-driven decisions
Digital analytics eliminates guesswork and helps you understand what works or what doesn’t from data.
You can analyze how customers engage with your UI. Or see how product placement, content, and pricing are affecting your conversion rates. With those customer insights, you can double down on what works and do less of what doesn’t.
It also helps to prioritize bug fixing, feature updates, and big product tweaks, considering potential revenue growth from each improvement.
Identify and remove roadblocks from customer journeys
Analytics platforms also help you understand where customers are experiencing frustrations and why.
Your goal is to provide a seamless experience for customers that naturally leads them through conversion points. But, it doesn’t always go so smoothly. With the right tools, you can track where things are going wrong and optimize journeys to maintain growth.
Improve customer retention and loyalty
The behavioral customer data you collect during experience analytics can help you understand customer needs better and improve personalization.
By creating experiences that are tailored to each user segment’s needs, you will increase customer satisfaction and ultimately retention and loyalty.
Is your digital experience truly seamless?
Great products don’t just happen. They are built on data. Take this 4-step assessment to see if you’re effectively using digital experience analytics.
Who can benefit from digital experience analytics?
Digital experience analytics helps your entire team inform decisions:
- Product managers: Using digital experience analytics, they can evaluate product performance, identify functional issues, and create a better product roadmap.
- Development teams: To identify technical problems on your site or app, like bugs that need fixing.
- UI/UX designers: Create more user-friendly experiences by using data gathered from past interactions.
- Marketing teams: Understand your target audience better and connect with them through marketing campaigns.
When everyone on your team can monitor the digital CX analytics, customer understanding improves. You can all work together to build a better product for your customers.
What are the main digital experience analytics methods?
There are five main methods you can use to gather digital customer experience data:
Set milestones in the customer journey and track progress
Build a user funnel by establishing milestones in the user journey. Then track how users are completing them.
Understand which percentage of customers successfully move forward through the funnel and how many don’t. Then segment those users who drop off after each stage – have a closer look into their behavior to understand what went wrong.
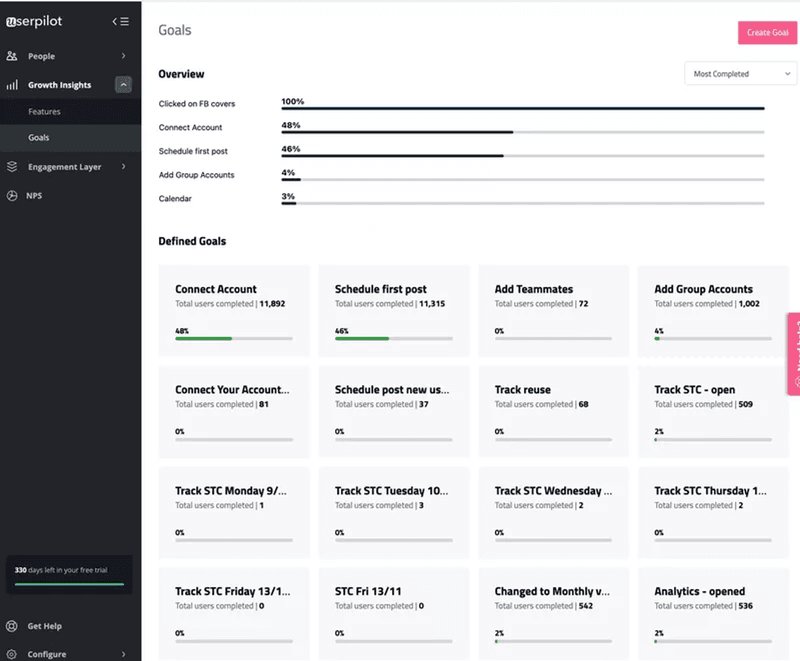
Track in-app feature usage and other customer interactions
Tag UI elements and track how different segments of users engage with them. This helps to identify your killer features so you can prioritize them in the next development cycles.
On the other hand, low engagement can indicate bugs or other usability issues. Keep in mind that you should pair this with usability testing since the engagement rate alone doesn’t tell you the whole picture.
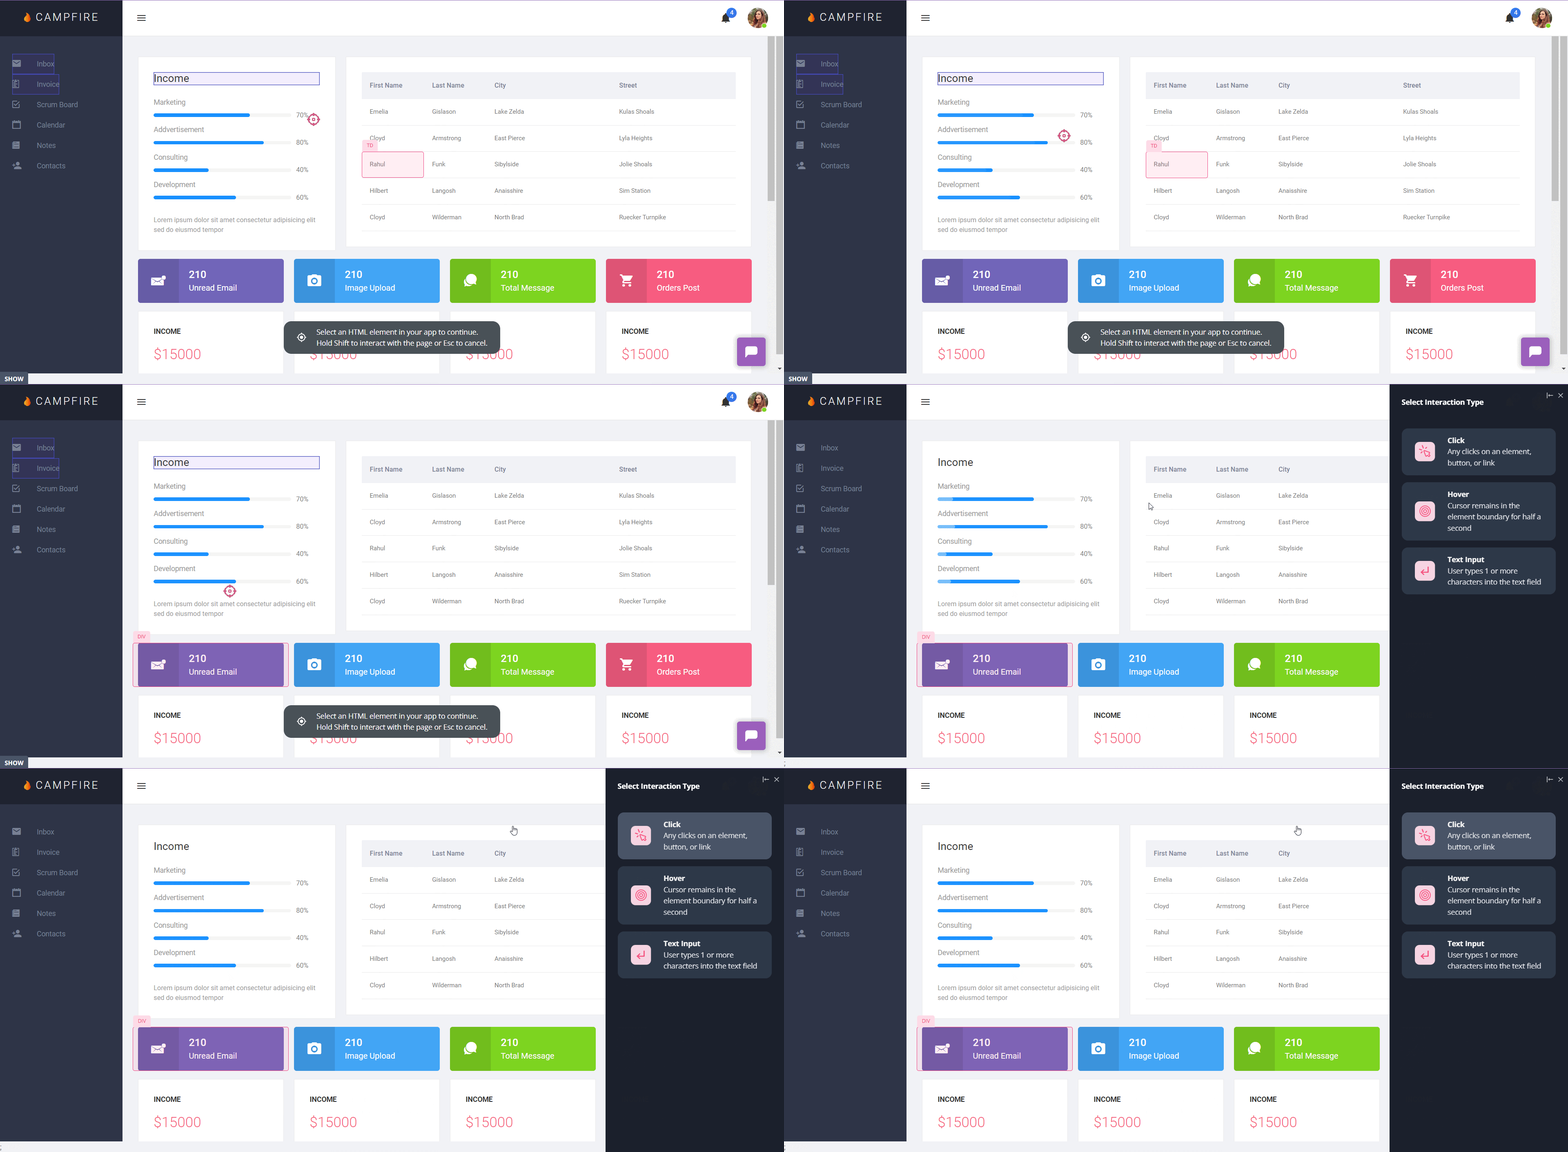
Understand user behavior with session replays
Session replay is a technology that allows you to watch an end user’s session as they experienced it, similar to how you watch a video.
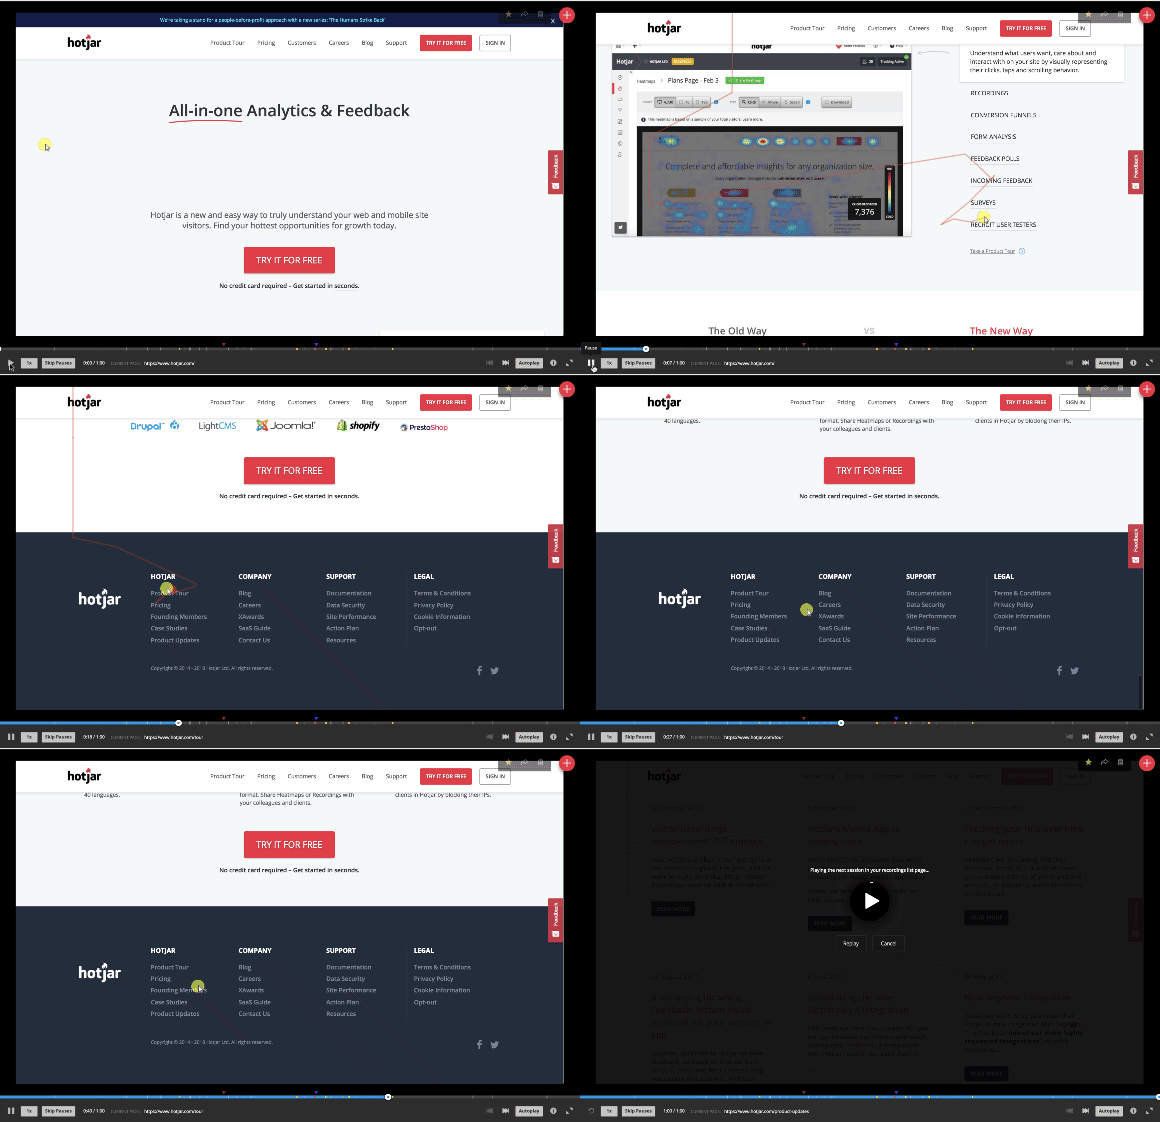
Launch user surveys to collect direct feedback from users
Direct feedback from customers provides you with a better understanding of the parts of the journey that cause frustration or resonates with different visitors.
Use in-app surveys after different interactions. For example, you can use CSAT (customer satisfaction) surveys after a customer uses a new feature for the first time. Or you can trigger cancellation surveys when someone requests to cancel their account.
You can also effectively collect qualitative and quantitative data with NPS surveys. These surveys measure customer loyalty by tracking how likely they are to recommend the product to a friend or colleague.
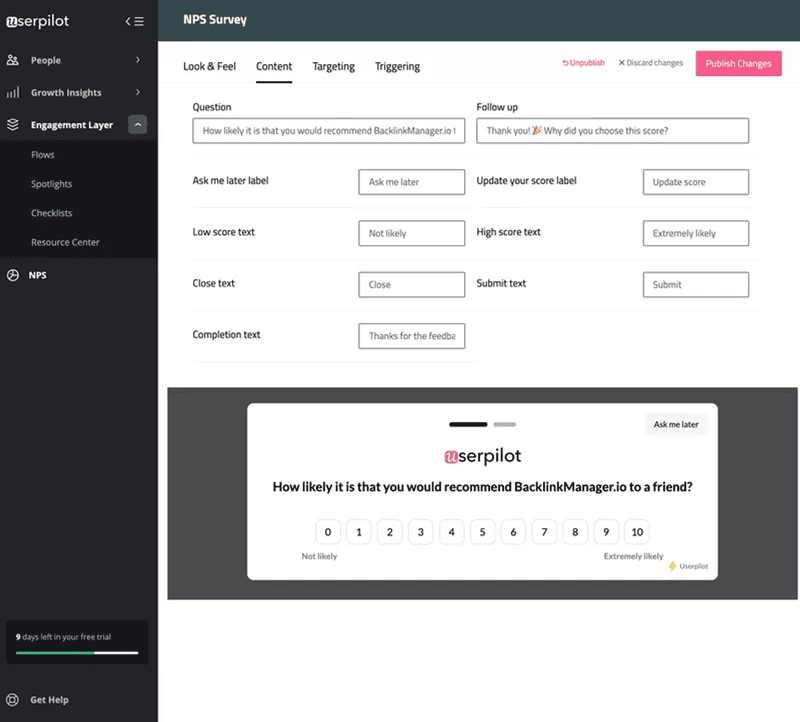
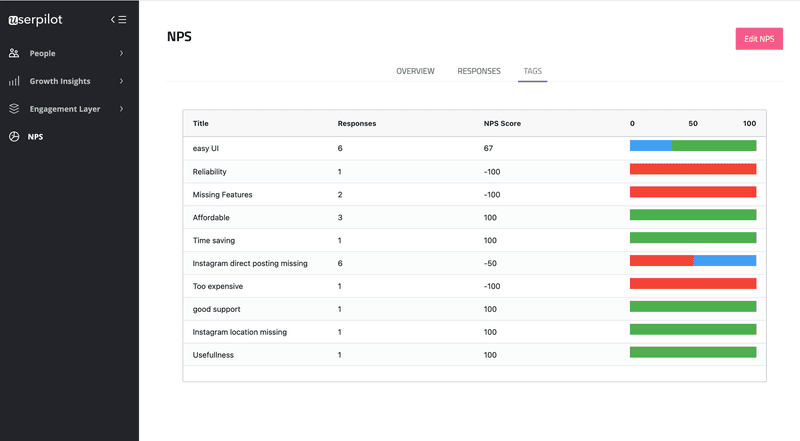
Specialized NPS software tools, like Userpilot, allow you to tag answers by theme or keyword. This makes it easier to analyze the responses and prioritize solutions.
In this example, you can see the color-coded tagging system, where green shows a high average NPS score and red shows a low NPS score.
Best digital experience analytics tools
Here are the best-specialized analytics tools to help you track your customer’s digital experiences:
Userpilot
Userpilot is a product growth platform with tons of valuable solutions that help you increase product adoption.
With its mobile features, Userpilot can also help you create intuitive mobile app KPI metrics and dashboards that provide clear insights into user behavior, engagement, and retention.
Here are some of the key features that help you improve customer satisfaction:
Segment customers based on product usage data
To make data more meaningful, you can segment users with similar goals and characteristics and see how they perform in your app.
This will help identify patterns in different segments. For example, you can identify different issues experienced by new users compared to repeat users.
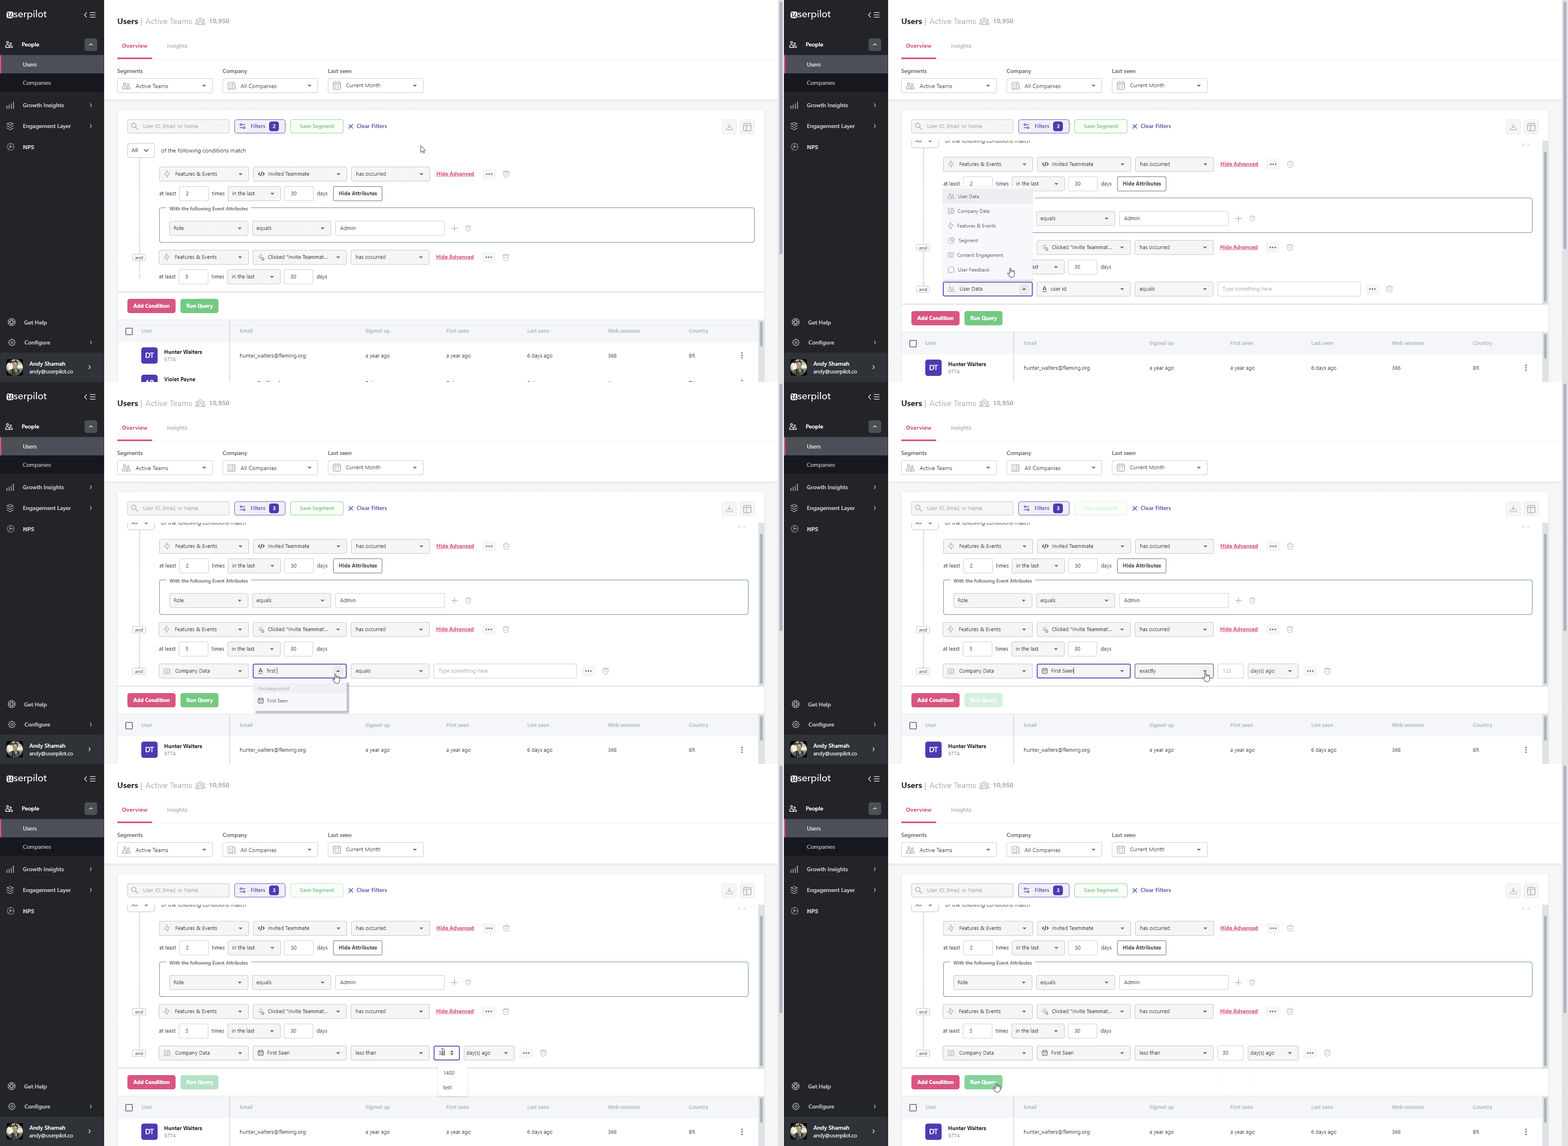
In other words, segmentation helps you identify the best and worst elements of your app for different segments of your user base. Then, you can tailor solutions for those groups individually to excellent effect.
Trigger real-time actions based on user behavior
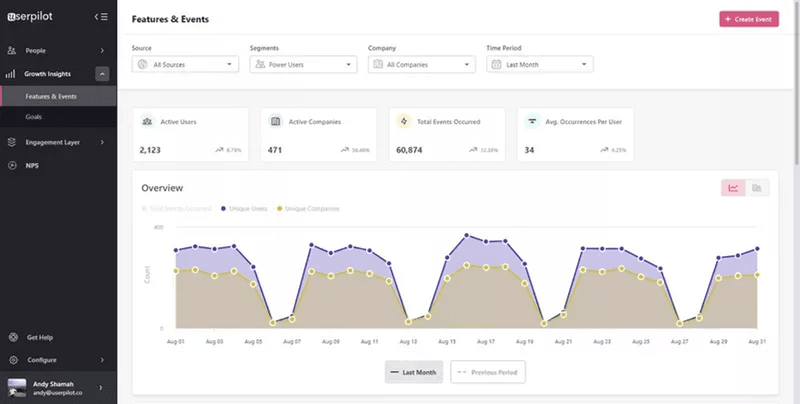
It also has real-time customer journey analytics that helps you understand the impact of your decisions live, enabling you to take quick actions using digital CX data.
Run in-app experiments
Userpilot allows you to test all new hypotheses with A/B testing.
A/B testing lets you find the most effective areas that your users respond to so you can deploy the best-performing elements everywhere.
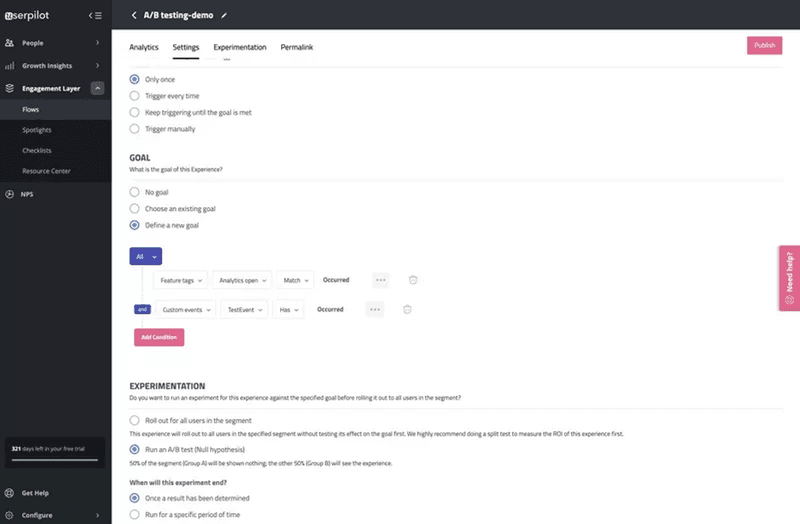
For example, you can build a tooltip and see if that increases feature discovery of a new feature vs. without with A/B tests.
Mixpanel
Mixpanel is one of the leading product analytics tools with custom interactive reports, segmentation, and data management features. It gives you actionable insights into customer behavior, user journeys, and friction points.
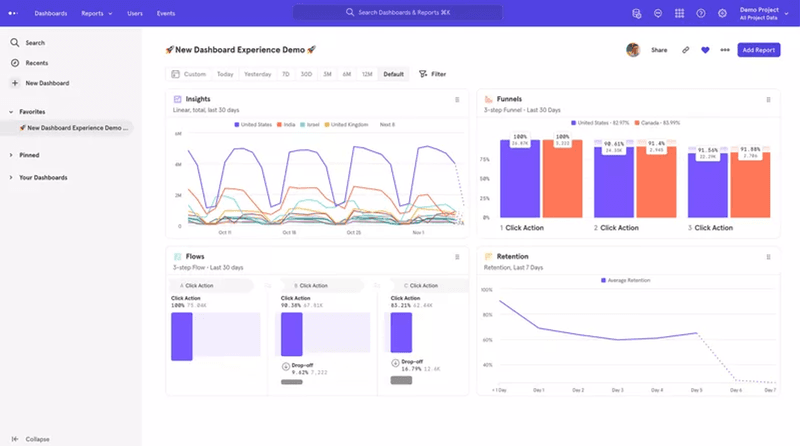
With Mixpanel, you can also analyze conversion funnels, retention, user segments, experiment results, and more.
Google Analytics
Google Analytics is a free web analytics tool that gives you insight into how your web pages are performing, with helpful data on user sessions.
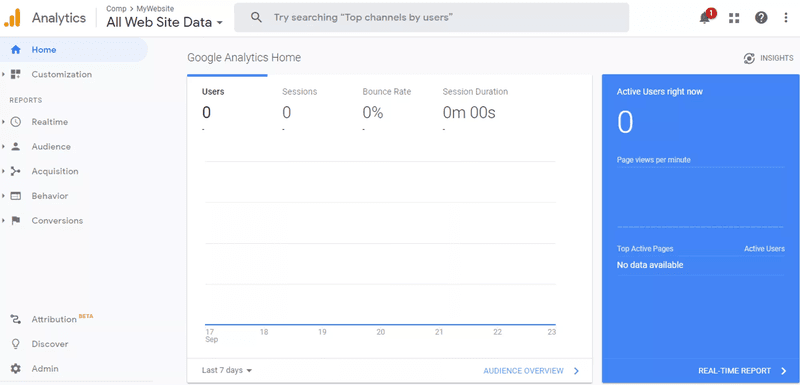
While it doesn’t give you product analytics data, it sheds light on the customer’s journey pre-acquisition. It shows where traffic to your site is coming from, behavioral analytics from website sessions, and the path users take to converting.
Conclusion
Tracking your digital experience analytics is incredibly important to reach your company’s goals and ensure you’re meeting customer needs.
It helps you to:
- Spot areas for improvement (friction points or low engagement).
- See what power users are doing (so you can replicate their process for all users).
- Keep your entire team aligned on priorities and strategies.
Want to get started with tracking your digital experience analytics? Get a Userpilot Demo and see how you can track your product analytics, code-free.
[/vc_column_text][/vc_column][/vc_row][/vc_section]


