Discover 10 Product Analytics Best Practices From Real Experts


Our industry needs to rethink product analytics best practices:
- Companies are flooded with data silos and errors from using many inefficient, fragmented tools.
- Teams rely too much on engineering resources to set up systems, implement a new flashy dashboard, and solve errors.
- There’s low-quality data everywhere, redundant tracking, and metrics that don’t align with business objectives.
All of this just for the product team to get superficial insight without a clear path to action.
This approach to product analytics is broken—it needs change.
That’s why I’m sharing our most fundamental product analytics best practices. These are based on my personal experience as Head of Product Design at Userpilot and the insights from the rest of my team.
1. Keep it simple to avoid analysis paralysis
If I had to give one word of advice for good product analysis, it would be this: simplify.
You see, analysis paralysis is real. You’re probably overestimating your capacity to keep up with product analytics data and you’ll naturally try to do too much at once.
This causes too many obstacles, for instance:
- Being unable to create an action plan in the overwhelming sea of unlabeled data and random metrics.
- Eating up more engineering resources whenever something breaks.
- Wasting resources and time on junk data and empty insights.
The point here is to slow down so you can actually keep up with analyzing data and make valuable decisions for your business.
For this, just focus on one goal or metric when you start. Make sure it aligns with your definition of success and adjust your projections after the first quarter.
Once you start getting insights, you can start adding small layers and track stuff with a clear intention. For example, if you released a new feature and overestimated its adoption rate, start tracking user behavior to spot friction or send CSAT surveys to get more context on it.
Only then will it be a good idea to follow the other best practices.
2. Define your goals and audience before diving into analysis
It may sound cliché to say that you need a goal for your analytics, but people still dive aimlessly into data due to tight deadlines, company culture, etc.
So this is a reminder that no matter the circumstance, invest at least a few minutes into defining what you’re looking for.
Here’s what Sean Cummins (our Senior Product Designer) recommends:
Before diving into analytics, it’s essential to first understand the purpose of what you’re trying to measure. My initial step would be to clarify what I want to learn, often aligned with a specific business objective. Once that’s clear, I can identify my target audience and explore how they achieve that objective.
– Sean Cummins, Senior Product Designer at Userpilot
For this, it’s pretty helpful to use a goal-setting framework to articulate your objective in a clear sentence.
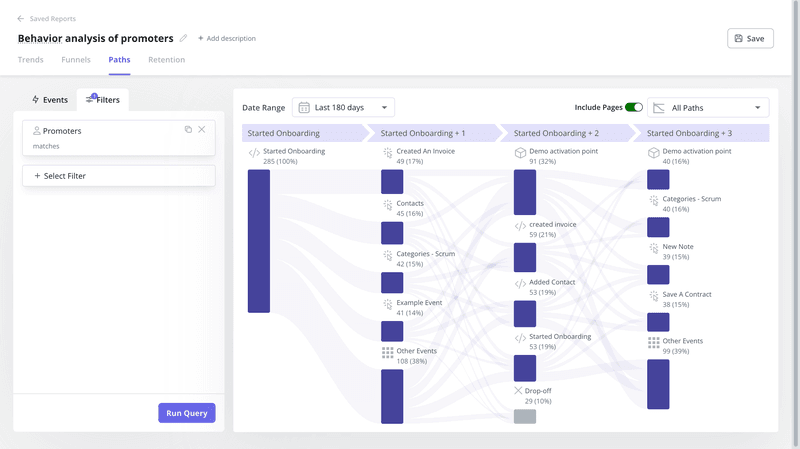
3. Map out the customer journey to avoid overlooking critical touchpoints
As I mentioned before, the reason behind simplifying is so you can start adding layers to your analytics without losing your mind.
One critical step you should prioritize is to map out the customer journey. It will not only give you a clear view of the pages a user interacts with, but will also help you identify what motivates them, which interactions lead to desired action (e.g., activation), and which friction points are affecting the product experience.
Here’s an example from Sean to illustrate this process:
Let’s say we’ve launched a document collaboration feature. I’d create a path report to better understand how users navigate to and from this feature. This would help:
1. Identify the user’s motivation for using the feature, as well as their success rate in doing so.
2. Determine which pages and interactions need to be tracked to reach the goal of collaborating on a document.
3. Pinpoint which user interactions, like commenting, editing, sharing, and tagging others, are most commonly used and help prioritize the most critical touchpoints for optimizing the feature.
– Sean Cummins, Senior Product Designer at Userpilot
This is a great example because it shows how you can spot friction in the customer journey. So if adoption is lower than expected, then improving usability based on these pain points would be the move.
4. Leverage data triangulation for comprehensive user insights
When conducting product analysis, you can’t just rely on one data point to validate a hypothesis.
It’s essential to cross-reference with other data sources (both quantitative and qualitative) to verify something is true. For our UX Researcher, Lisa Ballantyne, data triangulation is a must for exploring hypotheses, features, and projects:
While specific research methods are really helpful in answering a particular question you may have, data triangulation is best to incorporate multiple data sources to verify findings and to get a complete picture of the user experience. You can use a range of different data sources to form your hypotheses or questions and then use a specific data source to explore that hypothesis further.
– Lisa Ballantyne, UX Researcher at Userpilot
For example, let’s say you’re exploring the adoption process of a new feature. You may use funnel analysis to identify an area with high drop-off, but this won’t tell the full story.
Pair this with surveys and/or interviews and you’ll know why users are dropping off and the bottlenecks they are facing.
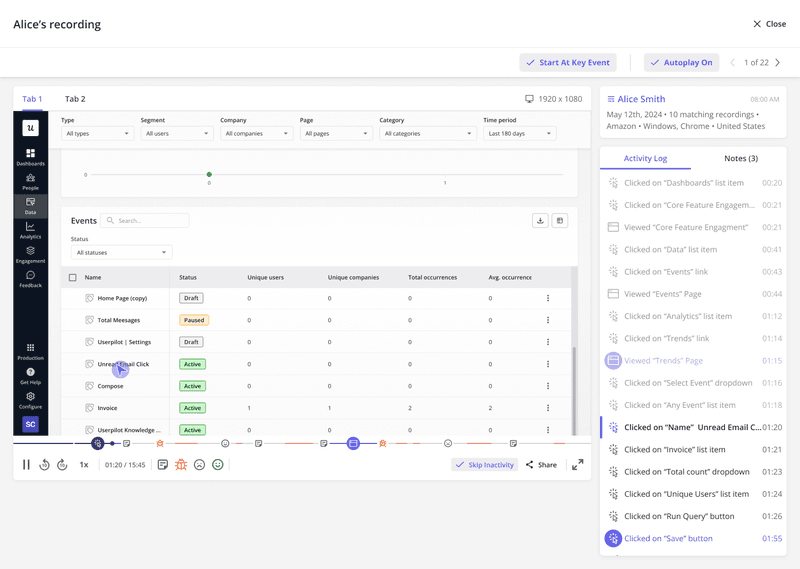
5. Use session replays to your advantage
Among the many analytics techniques, session replays are probably one of the most powerful product analytics features you can invest in, as they give a qualitative perspective to events that would otherwise be only quantitative.
Sure, it is time-consuming to watch a long list of user sessions, but it doesn’t have to be that way.
For Natália Kimličková (our Senior Product Marketing Manager), session replays are an essential part of a product marketer’s job at PLG companies. Here are two instances where she uses session replays:
One, I’d create funnel dashboards when releasing new features to see % of users that discovered the feature and activated it. Then, I’d watch session replays of dropped-off users to discuss with the product team what further activities can boost engagement and upsell.
Second, I’d analyze the activation points for onboarding and how fast we can get users to value. If I see users dropping, I’d analyze the data further by looking into the overall number of trials, or watch session replays to uncover potential bugs.– Natália Kimličková, Senior Product Marketing Manager at Userpilot
📌 Note: For those concerned about using session replays ethically (as you should), you must use a session recording tool that follows privacy best practices and keeps data completely safeguarded. Userpilot, for example, allows you to mask personal data from recordings and is compliant with HIPAA, GDPR, and SOC 2 type II.
6. Use a product analytics solution that lets you act on insights
The major problem in product analytics is the separation between the analysis and the action.
This separation is clearly projected in your tech stack.
Snowflake to store data, PowerBI for visualization, Typeform for user feedback… It’s all separated, all disconnected.
Yes, you can technically use multiple analytics tools that are best at what they do to make proper use of valuable data. But keep in mind four things:
- This is unnecessarily expensive – both in budget and engineering resources.
- It results in more errors (that engineers must fix), data silos, and lost productivity.
- It adds extra steps to your process for data collection, insight analysis, and implementation.
- There’s inevitable cognitive friction when juggling between platforms.
For this reason, I highly recommend using a no-code platform that integrates both quantitative/qualitative data AND also provides the tools to implement product-related solutions (think of in-app messaging, onboarding, upsell prompts, customer loyalty programs, etc.).
As an example, let’s say low upsells are affecting the revenue growth metric. With an all-in-one platform like Userpilot, you can actively analyze the conversion rate of your upsell prompts, analyze the in-app behavior of users who don’t upgrade with path analysis, and send them a targeted survey to understand the root of the problem.
On top of that, you can also iterate your in-app upselling strategy by testing out different upselling prompts at different conditions with A/B testing.
All of this – in one place. No need to code or reach out to other teams.
7. Associate product usage with financial outcomes
We all agree that improving the user experience correlates with increased revenue.
This is why your reports must, in some way, trace back to revenue so they can communicate its value successfully.
Here are three ways I do this:
- Integrate your product analytics software with a CRM: This way, you can directly correlate product usage indicators like feature activity, usage frequency, or in-app milestones with financial outcomes (Userpilot, for instance, integrates with Salesforce and HubSpot).
- Identify high-value interactions (actions that lead to revenue): For example, which features are used the most by power users? What behaviors indicate that a user is ready to upgrade or buy an additional product?
- Track behaviors that represent revenue loss (churn): For example, inactivity with core features, low NPS, negative WOM, etc.
8. Build a data-driven culture in your company
I understand if a data-driven culture sounds challenging or outright impossible in your company.
But there’s no reason not to want a data-driven culture in your company. It aligns every team member toward the same goals, creates an objective definition of how success looks like, and most importantly, makes product analytics worth doing.
So if you’re at least working toward building a data-driven culture in your team, then here are the most valuable tips I wished I had known years ago:
- Include all team members from top to bottom: All stakeholders that make decisions on the product must understand the data and be able to agree on what metrics indicate success.
- Make it easy for the rest: Keeping it clear and simple makes data more inclusive for those who have less technical background. A great way to apply this is to always find a way to tie it back to the product. For instance, what does this retention level mean for revenue growth in the next quarter?
- Celebrate wins and losses: There’s always going to be some losses, sure, but at least you’ll be able to know it. Celebrate the advantage you have over companies who struggle to even know what’s happening.
9. Avoid tracking vanity metrics
When you hear about not getting distracted with vanity metrics, it sounds easy, kinda obvious.
But the whole problem with vanity metrics is that they create a sense of achievement that only distracts you from the important facts.
This makes them inherently dangerous. And if you think you’ve never measured vanity metrics, then you probably have.
Here are some examples of possible vanity metrics:
- Total users: Why does it matter to have a high number of users who never engage with your product? Especially if they’re not paying.
- Signups: If your product has an opt-in free trial, signups don’t mean much if you can’t get new users to become paying customers.
- Session duration: You might assume higher session durations indicate better engagement. But there’s simply no right or wrong session duration time. Some products are more valuable where users can fulfill their JTBDs quicker (thus, reducing their session duration).
A vanity metric is one that is not actionable.
Think of free-to-paid conversion, new user retention rates, monthly active users, or feature adoption. These are metrics with a direct impact on business—focus on these.
10. Ensure your dashboards have a good data user experience
Dashboards are like a control room where you can oversee your product’s performance in real-time and spot potential bottlenecks.
Having a focused dashboard with key metrics that directly impact your business is one thing; aimlessly tracking random metrics and pretending they matter is another.
So my last tip is to improve the data user experience of your dashboards.
And if you’re wondering, these are the components of a positive data user experience:
- Usefulness: Prioritize datasets and dashboards that align with business-critical questions, ensuring they directly address common use cases.
- Usability: Are dashboards intuitive? Do teams struggle to answer common questions? Organize your key performance indicators (KPIs) to make dashboards easier to navigate.
- Findability: Are insights hard to find? Centralize documentation for metrics, definitions, and data sources to make them easily accessible.
- Credibility: Is data accuracy questionable? Ensure definitions are documented to build trust.
With a great data user experience, team members won’t struggle with data, KPIs will be clear, and everyone will be aligned toward the same goal.
Supercharge your product analysis with Userpilot
The point of these product analytics best practices is to bridge the gap between analysis and action.
With Userpilot, you can seamlessly integrate qualitative and quantitative data, eliminate engineering bottlenecks, and act on insights in real-time—all without writing a single line of code.
Why not book a Userpilot demo to try our all-in-one platform with more than 500 5-star reviews on G2?
About the author