10 User Metrics to Track + How to Overcome Common Challenges


Tracking the right user metrics helps you precisely identify issues in the product experience rather than feeling lost in a sea of data.
Emphasis is on the word right. Choosing the wrong KPIs can be more damaging than you think – it drains your team’s resources, shifts focus away from real problems, and ultimately, disrupts the customer experience.
In this article, I’ll cover 10 crucial user metrics every product manager should track to turn data into decisions that increase product adoption. I’ll also discuss common challenges product managers face when monitoring and analyzing metrics and their solutions.
10 Essential user metrics explained
To build a product users love, you need data that reveals how they interact with it. Track these user engagement metrics to get that data so you can measure success, identify friction points, and make informed decisions.
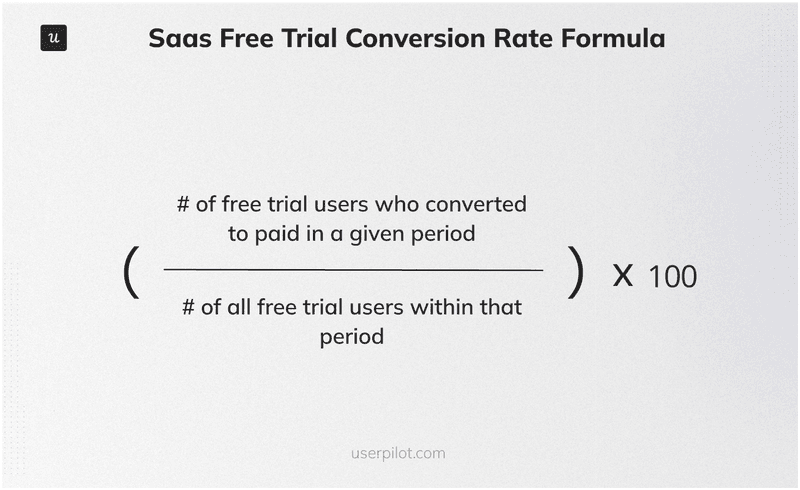
1. Free to paid conversion rate
This user metric measures the percentage of users who upgrade from a free trial to a paid plan.
The free to paid conversion rate is a metric for assessing your onboarding and initial user experience. It provides insight into how effectively your product demonstrates value during the trial phase. Tracking it helps pinpoint areas to improve trial-to-paid transitions and boost overall revenue.
For example, a low conversion rate may indicate friction in the onboarding process or a lack of perceived value. However, a high rate suggests that users quickly understand and appreciate the benefits of your product.
To calculate the free to paid conversion rate, divide the number of free trial users who converted to paid in a given period by the number of free trial users within the same period, then multiply by 100.
2. Time to value (TTV)
Time to value (TTV) measures how long it takes a user to realize the value of your product after signing up. Specifically, it tracks the time from the user’s first interaction to the point where they reach the activation milestone: when they experience a key benefit or achieve their desired outcome.
This user metric is crucial because the faster users perceive value, the more likely they are to stay engaged and adopt your product.
On the contrary, a long TTV may lead to user frustration and drop-offs because the product didn’t meet their expectations.
To calculate it, track the duration from a user’s initial interaction with the product to their activation point.
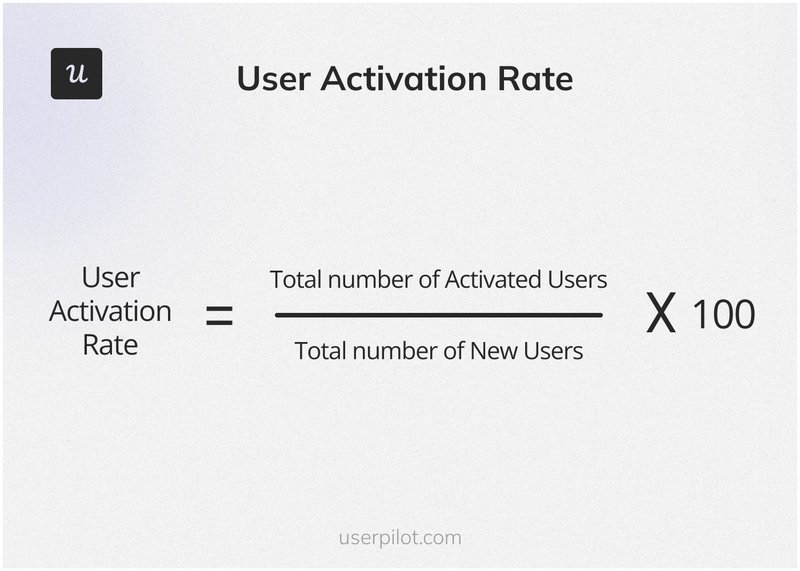
3. Activation rate
Speaking of activation, the activation rate measures the percentage of new users who complete a key action that demonstrates your product’s core value.
This metric reveals how effectively your product delivers the “Aha!” moment to new users, a critical step in turning signups into active users.
A low activation rate could indicate friction points in your onboarding flow or unclear guidance, while a high rate suggests new users quickly find value in your product.
Tracking and improving this metric helps you ensure new users adopt your product and stay engaged successfully. In other words, it results in higher retention and long-term engagement.
To calculate the activation rate, divide the total number of activated users by the number of new users, then multiply by 100.
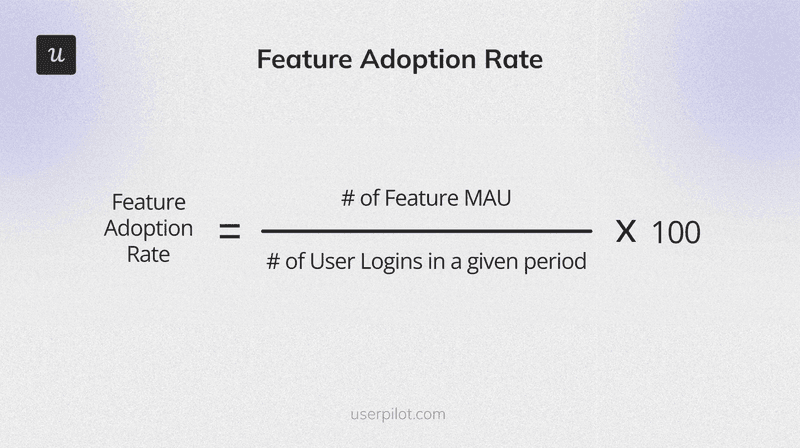
4. Feature adoption rate
This user engagement metric measures the percentage of users actively engaging with a specific feature within a given period. It’s a vital metric for understanding whether your product’s features meet user needs and deliver value.
The feature adoption rate provides insights into how well users integrate a particular feature into their workflows. A high adoption rate indicates that the feature resonates with users and contributes to their success. However, a low adoption rate might signal usability issues, unclear onboarding, or misalignment with user expectations.
Monitoring this metric helps product managers prioritize improvements and identify which features drive the most engagement.
To calculate the feature adoption rate, divide the number of feature monthly active users (MAUs) by the number of user logins in the same period, then multiply by 100.
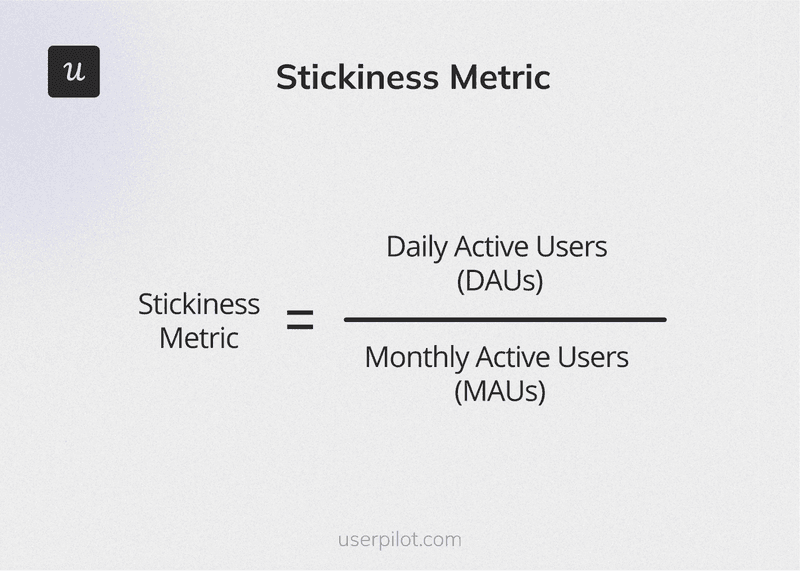
5. User stickiness
User stickiness measures the ratio of daily active users (DAUs) to monthly active users (MAUs). It provides insights into how often users return and interact with your product.
A higher stickiness ratio suggests your product is a regular part of users’ routines. It can indicate loyalty and long-term retention. However, a low stickiness ratio may signal issues with user satisfaction, feature relevance, or overall value, prompting further investigation.
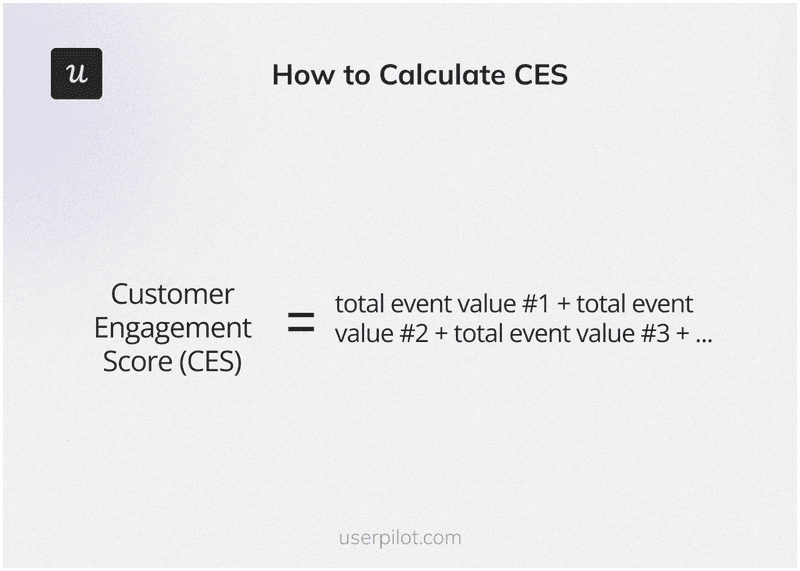
6. Customer engagement score
The customer engagement score quantifies how actively and meaningfully users interact with your product. The engagement score aggregates user actions by assigning values to events, such as logins, feature usage, or support interactions.
This user metric measures users’ overall activity and engagement level so you can identify highly engaged users.
A high user engagement score indicates strong product usage and satisfaction, while a low score suggests that users may not be finding value or experiencing friction. Product managers can prioritize tactics to improve user retention and satisfaction by monitoring this score.
Follow these steps to calculate the customer engagement score:
- Identify user actions and behaviors that signify meaningful engagement with your product.
- Monitor these events throughout the customer journey.
- Assign a score (e.g., 1-10) to each event based on their importance and impact on customer health.
- Multiply the score for each event by the event frequency to calculate its total event value.
- Get the sum of the total event values from all tracked events.
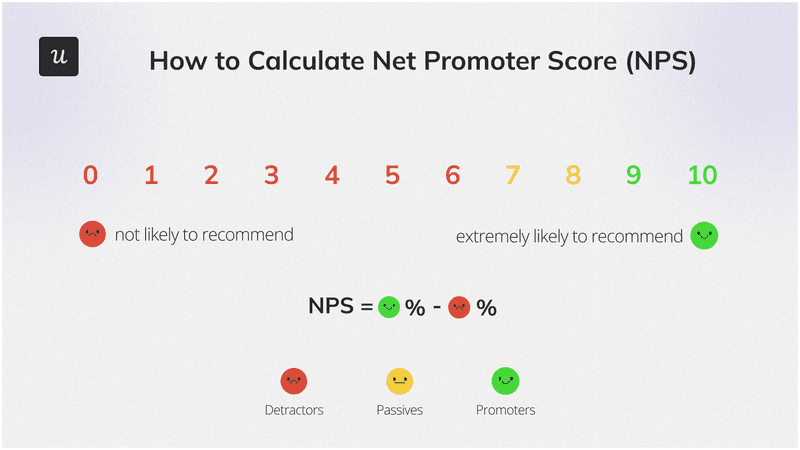
7. Net Promoter Score
The Net Promoter Score (NPS) is a customer loyalty metric that measures how likely users are to recommend your product to others. You can collect data through a survey, where respondents rate their likelihood of recommending your product on a scale from 0 to 10.
The NPS survey categorizes respondents into three groups:
- Promoters (9-10): Loyal users who are likely to recommend your product.
- Passives (7-8): Neutral users who are satisfied but not enthusiastic.
- Detractors (0-6): Unhappy users who may discourage others from using your product.
NPS is important because it highlights user loyalty and provides a clear indicator of customer satisfaction. It also helps identify areas for improvement based on detractor feedback.
To calculate NPS, subtract the percentage of detractors from the percentage of promoters.
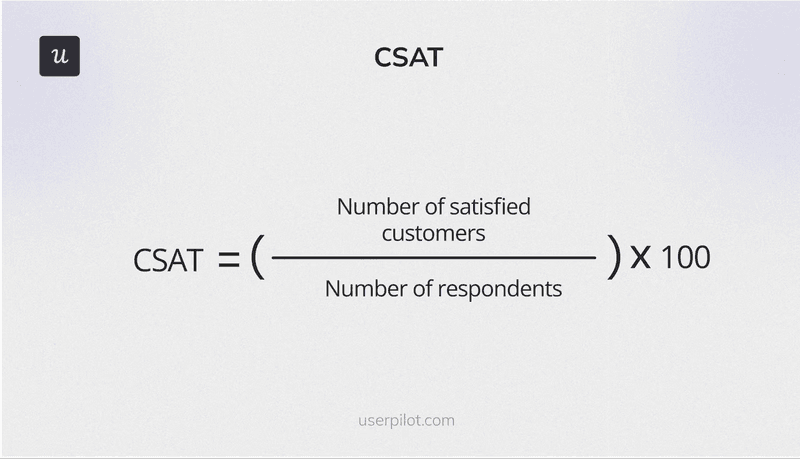
8. Customer satisfaction score (CSAT)
The customer satisfaction score (CSAT) measures users’ satisfaction with a specific interaction, feature, or product. Like NPS, you can collect it through surveys where users are asked to rate their satisfaction on a Likert scale.
This user metric reflects user happiness and helps identify what’s working well and what needs improvement.
High CSAT scores indicate that your product meets user expectations, while low scores highlight dissatisfaction that could lead to churn. It’s a straightforward and actionable way to gauge user sentiment after key touchpoints, like onboarding or support interactions.
To calculate CSAT, divide the number of satisfied customers by the number of respondents, then multiply by 100.
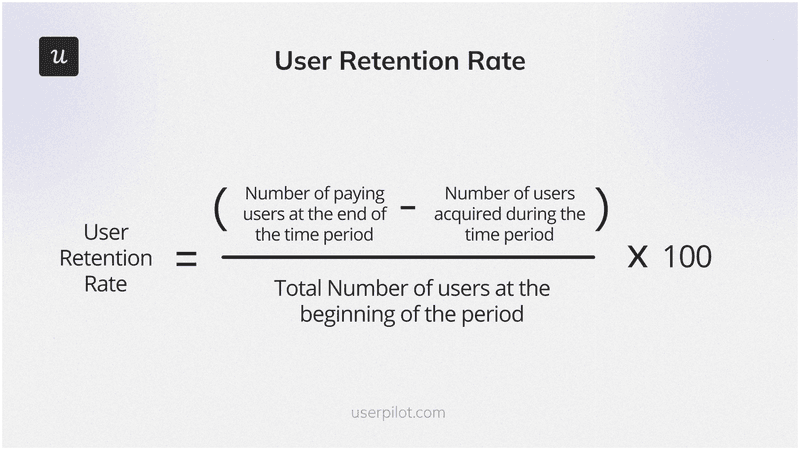
9. User retention rate
The user retention rate measures the percentage of users who continue to use your product over a specific period.
This metric indicates how well your product retains its paying customers, reflecting its long-term value and effectiveness in maintaining user engagement.
A high user retention rate suggests that your product consistently satisfies user experience, while a low rate signals potential issues such as unmet needs, poor usability, or lack of ongoing value. Retention is crucial for sustained growth and reducing customer acquisition costs.
To calculate the user retention rate, subtract how many users were acquired during a period from the number of paying users at the end. Then, divide the result by the total number of users at the beginning of the period and multiply by 100.
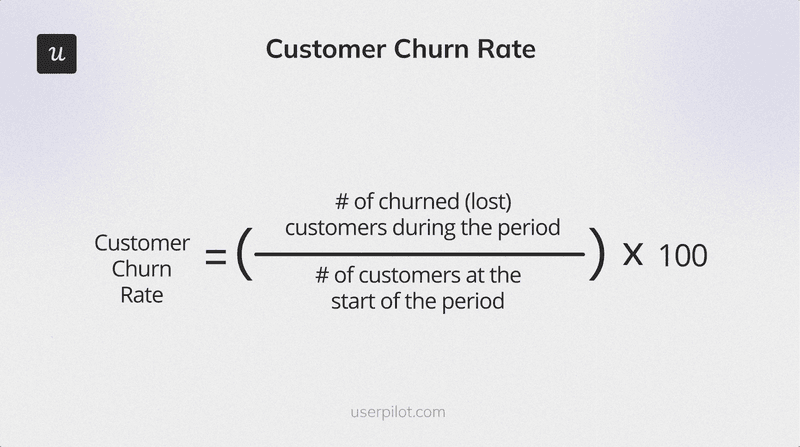
10. Customer churn rate
The user churn rate measures the percentage of users who stop using your product. It’s the flip side of retention, showing how many users you’ve lost. Studying this metric is crucial to understanding (and resolving) serious issues in the product and/or customer experience.
A high churn rate indicates dissatisfaction, poor onboarding, or unmet expectations, while a low churn rate suggests that users find consistent value in your product.
To calculate the user churn rate, divide the number of churned customers during the period by the number of customers at the start of the period, then multiply by 100.
Challenges when tracking and analyzing user metrics (+ how to overcome them)
Here are common challenges and actionable strategies to overcome them so your metrics drive meaningful results.
❌ Data overload because of tracking too many metrics
Tracking too many metrics can quickly lead to data overload.
While it might seem helpful to measure everything, this approach often results in analysis paralysis, where teams struggle to focus on actionable insights.
It becomes harder to see the big picture, with resources wasted on collecting and interpreting irrelevant data. This lack of focus can prevent product managers from identifying the metrics that drive growth and user satisfaction.
✅ Focus on a few key metrics
To avoid data overload, focus on a few metrics (about 3 to 5) that align directly with your business goals. For example, a SaaS product manager aiming to reduce churn might prioritize user churn rate, Net Promoter Score (NPS), and customer engagement score.
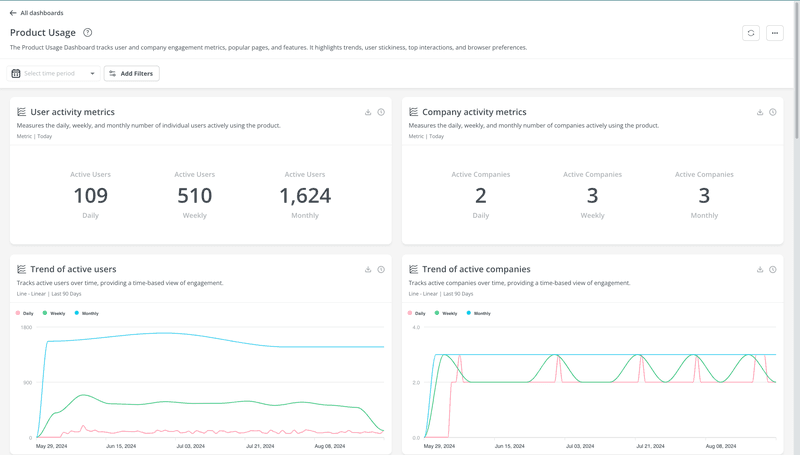
Next, create an analytics dashboard to display these metrics and share it across teams to make sure that everyone is on the same page and can focus on what matters most. Tools like Userpilot make it easy to track and visualize these metrics in one place, helping teams stay on the same page and act decisively.
❌ Failure to tag important events
Many companies rely on event analytics to track user engagement metrics, and the tools they use depend on manually tagging events.
This manual process can lead to gaps in tracking when key events are overlooked. In such a case, decision-making becomes flawed because there is poor visibility into critical user actions. This way, you may miss opportunities to improve user engagement.
✅ Use auto capture to label critical events
Userpilot’s autocapture feature simplifies event tracking by automatically recording all user interactions.
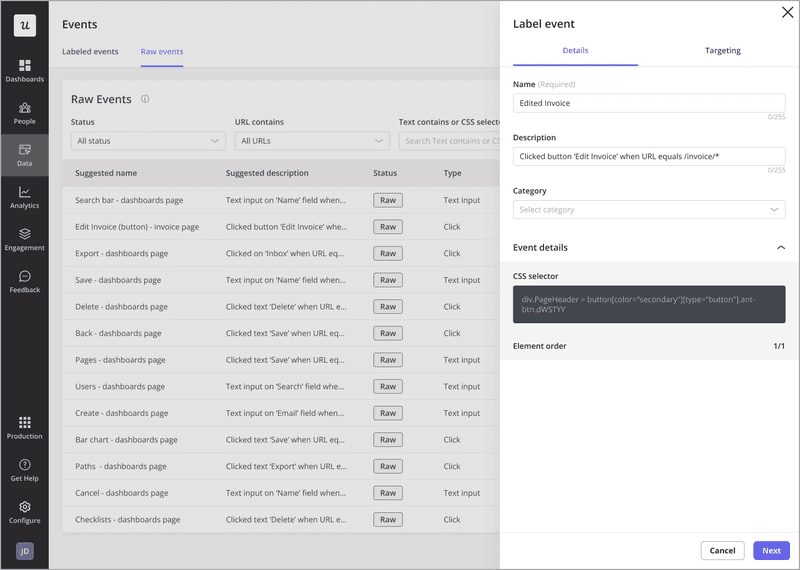
This feature eliminates the risk of missing important events due to manual tagging errors. Once events are captured, you can label and prioritize those most relevant to your product goals, such as adoption milestones.
❌ Inconsistencies while monitoring data
Using multiple tracking tools or relying on manual data entry can lead to inconsistencies in your metrics.
These discrepancies make it difficult to trust your data, as conflicting results from different sources create confusion and misalignment across teams.
For example, one tool may report higher user engagement while another shows lower activity, leaving you unsure which data to act on. Such inconsistencies waste resources and hinder effective decision-making.
✅ Centralize data tracking and create a robust tracking plan
To resolve inconsistencies, centralize your data tracking with an all-in-one tool like Userpilot. It allows you to collect and analyze all relevant metrics within a single platform, ensuring consistency and accuracy.
Additionally, create a robust tracking plan by defining clear objectives for what data to collect and how to gather it. This plan provides a reliable data collection strategy to keep teams focused and eliminate confusion caused by fragmented data.
Follow these steps to make a tracking plan:
- Define your business goals and the purpose of data collection, such as improving user activation.
- Establish key user metrics to track.
- Outline the user journey stages and touchpoints, focusing on actions after user signup to improve activation.
- Compile all data into a document or spreadsheet, organizing it with labeled columns and relevant information (check out the example below).
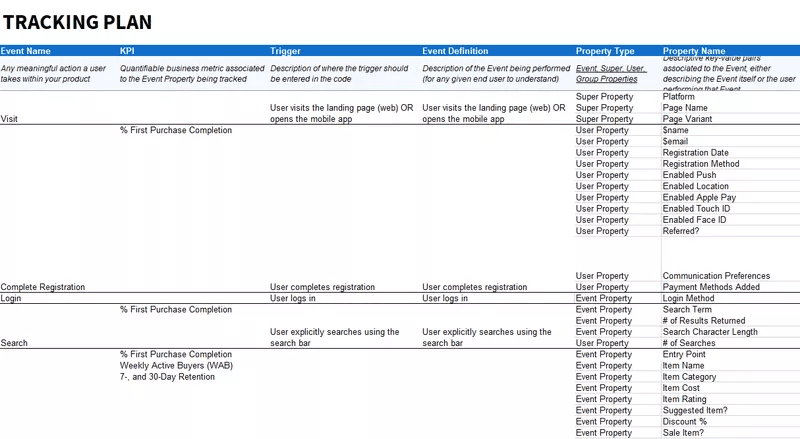
Regularly update the tracking plan to reflect changes, such as adding new events, removing outdated properties, or migrating to a new analytics platform.
❌ Lack of context when interpreting metrics
Metrics provide valuable insights, but they rarely tell the entire story independently.
For example, an increase in churn rate may highlight a problem, but without context, it’s impossible to understand why active users leave.
This lack of clarity can lead to misguided decisions that fail to address the root cause, ultimately wasting resources and frustrating users further.
✅ Leverage qualitative user data to back up findings
Pair metrics with qualitative data to better understand users’ interactions with your products. To get the “why” behind the “what.”
Features like Userpilot’s session replays can show how users navigate your product, while in-app surveys capture direct user feedback.
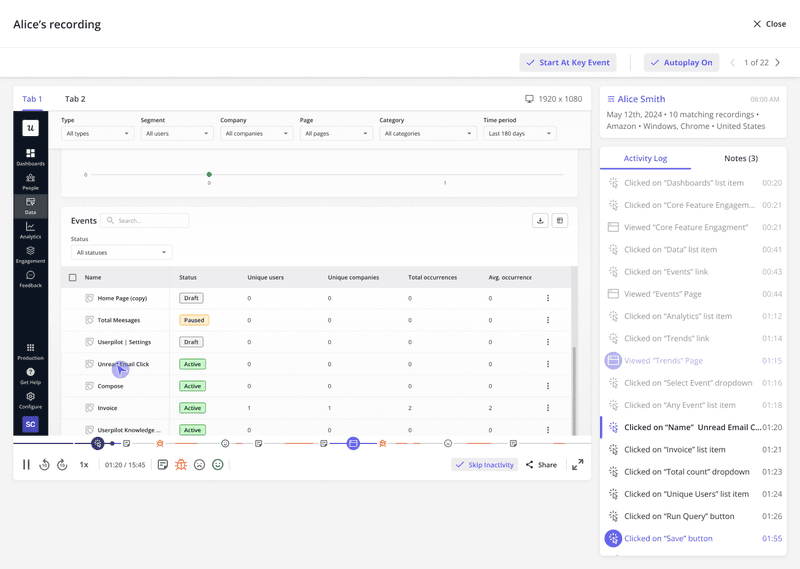
For example, you notice that the churn rate increased for a specific month. You check out session replays of churned users and discover them struggling with using a specific feature. You can then conduct a survey to collect feedback from other users and confirm that the feature is unclear or complicated to use.
Combining these insights helps you address issues effectively and improve user satisfaction.
Next steps to follow
This article should equip you with the knowledge to identify the key user metrics that align with your business goals and start tracking them effectively.
Want to simplify data collection and make better decisions? Book a Userpilot demo and see how to turn metrics into meaningful results.
FAQ
What are user metrics?
User metrics are data points that track how users interact with a product. They measure user behavior, engagement, and satisfaction. These metrics help you understand user needs and product performance to optimize experiences, increase retention, and drive growth.
Why is it important to track user metrics?
Tracking user metrics is vital for creating a product that meets user needs and fosters loyalty.
User engagement metrics can also help you predict and prevent churn by identifying at-risk active users early and implementing targeted interventions.
They also guide product development by revealing which features users value most, enabling you to prioritize improvements and align efforts with customer expectations.
Paying attention to user metrics ensures your product evolves to deliver value and keep users engaged in the long term.
About the author