Your product team isn’t lacking data. They’re drowning in it. Each platform spits out its own stream of numbers, charts, and metrics, but no one seems to have the full story. Product managers feel the strain of guessing user intentions and wasting valuable dev hours on misjudged bets.
49% of product managers pinpoint low-quality data as the biggest obstacle to smart feature prioritization. And as confusion grows, so does user churn.
Amplitude Analytics claims to clear this confusion. It promises clarity on user behavior, deeper user segmentation, and a unified view of customer journeys. But does Amplitude really deliver? Or should you be looking at alternatives like Heap, Mixpanel, or Userpilot?
Read on to examine Amplitude’s features, strengths, and weaknesses, and determine whether it’s the right fit for your business.
When considering the Amplitude product analytics platform, what’s your primary goal?
How important is having a no-code solution for your team?
Do you need to combine product analytics with in-app guidance and user feedback tools?
It looks like Userpilot could be a great fit for you.
See how you can analyze user behavior and act on those insights instantly with in-app guidance, all in one platform. Discover a powerful alternative to Amplitude’s features.
Try Userpilot Now
See Why 1,000+ Teams Choose Userpilot

What is Amplitude Analytics?
Amplitude Analytics is a digital optimization platform that helps you understand what users are doing inside your product and why. Every click, scroll, and action is logged as an event, giving product teams a real-time, end-to-end view of user behavior across web and mobile.
It captures raw behavioral data, stitches together user journeys, and turns chaos into clean, navigable dashboards. Instead of guessing why users drop off or which features actually drive retention, Amplitude shows you.
The platform is trusted by small businesses and industry-leading companies like Dropbox, PayPal, DoorDash, and Disney to guide product decisions, reduce churn, and drive feature adoption.
Amplitude Analytics: Core features and capabilities
Amplitude gives product teams a complete view of how users interact with their app or site. Here’s a closer look at the platform’s key capabilities:
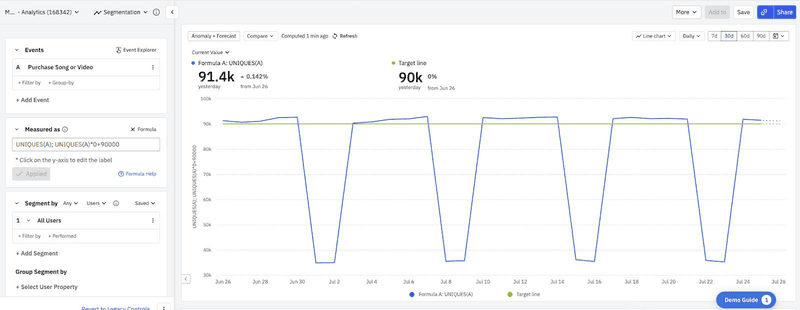
1. Event segmentation and charts
Event segmentation tracks every user action, such as “Signed Up,” “Played Video,” or “Added to Cart,” and lets you slice that data by properties like location, device, or plan type. These event-based charts help product teams understand usage patterns across segments to identify which features are sticky and which are being ignored.
This feature is available across all plans and is the foundation of nearly every Amplitude feature.
2. Behavioral and predictive cohorts
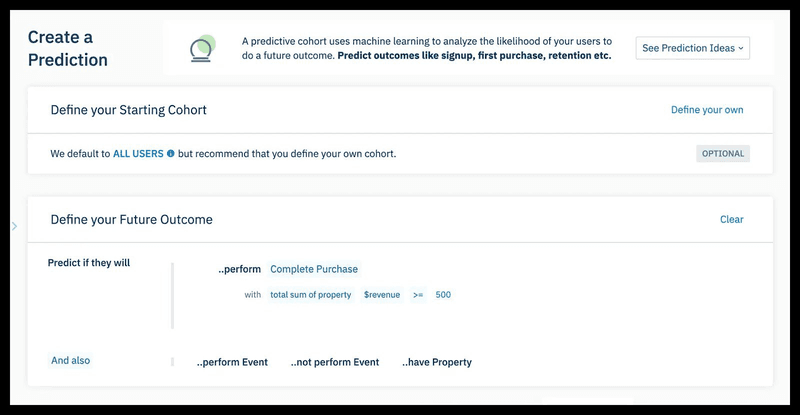
Amplitude lets you group users into cohorts based on what they did (or didn’t do) within your product. For example, you could create a segment of users who completed product onboarding in the last 7 days, or who haven’t logged in since upgrading.
More advanced users can create predictive cohorts, i.e., groups of users that Amplitude thinks are likely to perform a specific action, like making a purchase. These are powered by machine learning and are especially useful for proactive lifecycle campaigns and churn prevention.
Behavioral cohorts are available on all plans, while predictive ones require Growth or Enterprise.
3. Funnel analysis and Pathfinding
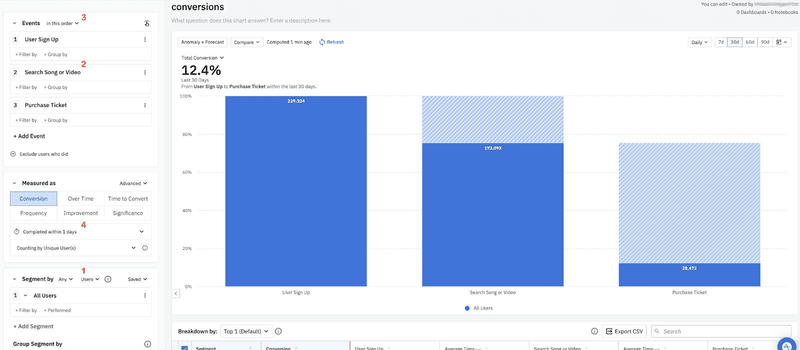
Funnel analysis helps you visualize how users progress through critical flows like sign-up, onboarding, or checkout. You can measure conversion rates between each step, identify where drop-offs happen, and segment the data by user type or platform.
Pathfinding also builds on this by showing users’ actual paths through your product, not just the ideal ones you designed. This is key for spotting friction points that aren’t obvious in a static funnel view.
Both features are included in standard plans and are essential for improving retention and conversion.
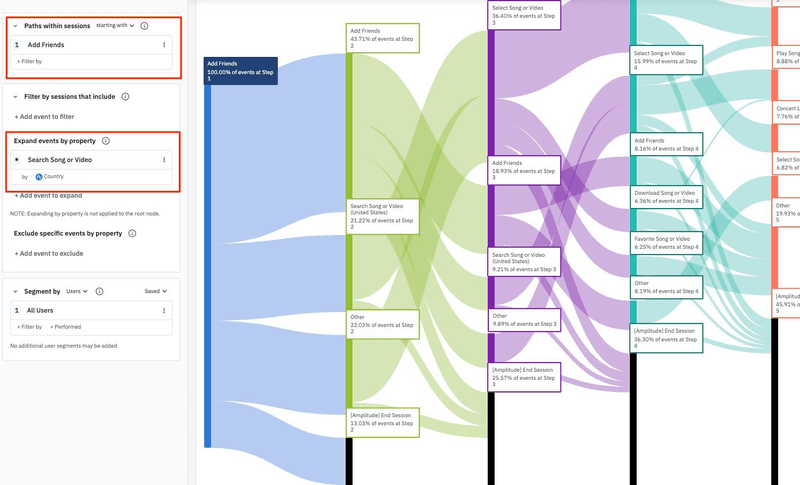
4. Dashboards and cross-project views
You can compile multiple charts, cohorts, and funnels into custom dashboards to keep key metrics front and center. These dashboards are shareable and customizable, so teams across product, growth, and leadership can align on the same data.
Amplitude also supports cross-project views through its Portfolios feature. If you manage multiple products or environments, this gives you a unified lens without having to switch between accounts.
Dashboards are available on all tiers. Portfolios are limited to Enterprise plans only.
5. Experimentation (A/B testing and feature flags)
Amplitude Experiment combines feature flags and A/B testing into a single platform. You can launch controlled experiments to see how users respond to new features or UI changes, then measure outcomes like engagement, conversion, or retention, all within the same ecosystem.
It’s beneficial for teams regularly pushing out new features as they need data-backed confidence before scaling changes.
Experimentation is currently only available on higher-tier plans like Growth and Enterprise. It’s a powerful add-on, but one best suited for teams already mature in their testing culture.
Pricing overview
Amplitude offers tiered pricing structures tailored to different business sizes and needs. Here’s a breakdown of their plans:
| Plan | Monthly Price (Billed Annually) | Monthly Tracked Users (MTUs) | Key Features |
| Starter | Free | Up to 50K | Out-of-the-box analytics, session replay, unlimited feature flags, web experimentation |
| Plus | Starting at $49 | Up to 300K | Behavioral cohorts, feature tagging, segmentation for web experimentation, custom audiences |
| Growth | Custom Pricing | Custom | Advanced behavioral analysis, causal insights, real-time streaming, predictive audiences |
| Enterprise | Custom Pricing | Custom | Cross-product analysis, advanced data controls, multi-armed bandit experiments, dedicated support |
Note: Pricing for the Plus plan starts at $49/month and scales with the number of MTUs.
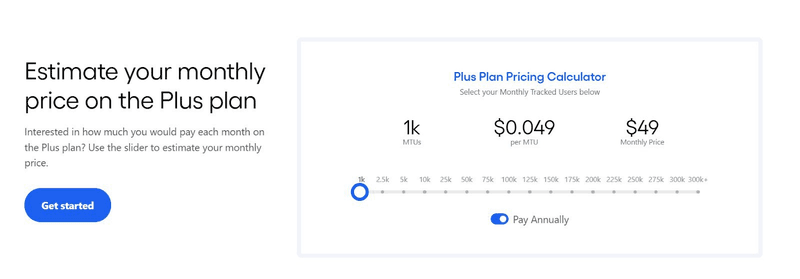
In case of an early-stage SaaS company with 5000 MAUs, the cost would be $99/month.
For a growth-stage SaaS, it’d be between 10,000 and 50000 MAUs, and the price could go upward of $149/month.
For enterprise companies, the pricing could go well over $2500 if they have more than 300K MTUs.

This flexible MTU-based pricing is great when you’re in the early stages of building your product. However, as you scale, the platform gets more expensive.
In this case, we suggest using a tool like Userpilot. We offer a Starter plan of $299/month for 2000 monthly active users, which is ideal for SMBs.
Userpilot’s growth plan is customized and intended for growing teams needing more advanced product analytics and feedback mechanisms.
What real Amplitude users say: Pros and cons
Amplitude is trusted by 1000+ businesses around the world, and every user has their unique view on the product. We’ve scoured through G2, Capterra, and TrustRadius to give you the key pros and cons of using the platform:
Amplitude Analytics pros
1. Lightning-fast query speeds and real-time analytics
Amplitude users repeatedly praise the platform’s responsiveness and speed, noting that rapid insights significantly boost productivity.

2. Robust cohort and segmentation tooling
Many reviewers highlight Amplitude’s advanced cohort analysis and segmentation features, which help teams precisely identify user behaviors and engagement patterns.
3. Enterprise-grade security and support
Users frequently mention their confidence in Amplitude’s comprehensive security protocols and responsive customer support, which are crucial for larger organizations handling sensitive data.
Amplitude Analytics cons
1. Steep learning curve for non-technical teams
Despite its intuitive UI, users consistently point out that fully mastering Amplitude’s depth and complexity can require substantial time investment, especially for less technical users.

2. Complex event taxonomy and manual tagging overhead
Amplitude’s detailed event structure often results in cumbersome manual tagging, leading reviewers to express frustration around setup complexity and data management overhead.
3. Cost at scale, especially for high-event volumes
Reviewers frequently highlight concerns about pricing transparency and escalating costs as their event volume grows, which can quickly exceed budget expectations.
Amplitude Analytics alternatives comparison
When choosing a product analytics tool, Amplitude is one of the first names that comes up. However, depending on your team’s needs, it might not be the best fit. Here’s how Amplitude stacks up against Mixpanel, Userpilot, and Heap on core criteria that matter to product teams:
| Criteria | Amplitude | Userpilot | Mixpanel | Heap |
| Mobile SDK support | ✅ iOs and Android | ✅ iOS, Android, React Native & Flutter | ✅ iOs and Android | ✅ iOs and Android |
| Event tracking schema | ❌ Rigid naming conventions; manual event definition | Auto-capture key events with minimal setup | Flexible custom schema | Auto-capture all interactions by default |
| Session replays | ✅ Supports Session Replay via chart and Mobile SDK plugin | ✅ Offers Session Replay as add-on to visualize user interactions | ✅ Offers Session Replay to watch playbacks of user experiences | ✅ Provides Session Replay to replay user sessions |
| A/B testing | ✅ Supports A/B testing through AB Test View and Experiment | ✅ Provides A/B testing methods to compare flow variations | ✅ Provides Experiments report for A/B testing analysis | ✅ Supports A/B testing for usage analysis |
| Product analytics | ✅ Provides out-of-the-box product analytics with feature insights | ✅ Combines product analytics with user onboarding and in-app surveys | ✅ Provides product analytics features through Insights, Funnels, Flows | ✅ Provides comprehensive product analytics platform with autocapture |
| User feedback | ✅ Offers in-app feedback collection with Guides and Surveys | ✅ Provides no-code in-app surveys for user feedback (NPS, CSAT, CES) | ❌ No native user feedback collection feature | ❌ Does not natively support user feedback collection |
| In-app guidance | ❌ | ✅ Fully no-code interactive product tours (tooltips, modals, slideouts, carousels) on web and mobile | ❌ | ❌ |
| Mobile push notifications | ❌ | ✅ | ❌ | ❌ |
Choose your data analytics tool
Confused about choosing the right product analytics tool? Fear not! We’ll guide you through a handful of quick questions to help you make a decision:
1. Do you only need raw event analytics?
Raw event analytics means logging every click, page view, or tap. It gives you hard numbers on drop-off points, allowing you to spot churn triggers quickly.
- If you choose Yes, go to Question 2.
- If you choose No, skip to Question 5.
2. Is zero-setup auto-capture your top priority?
Auto-capture means you never miss a single user interaction. It uncovers hidden friction that drives users away.
- If you choose Yes, Heap is your tool; its SDK retroactively captures every interaction.
- If you choose No, go to Question 3.
3. Do you need deep, predictive cohort analysis at enterprise scale?
Predictive cohorts use machine learning to surface which users will convert or churn before you can see it in your reports.
- If you choose Yes, Amplitude delivers best-in-class behavioral and predictive cohorts.
- If you choose No, go to Question 4.
4. Do you want a generous free-tier with robust funnels & cohorts?
A big free plan lets you experiment with funnels and segmentations without risking your budget. More experiments mean more chances to plug retention leaks.
- If you choose Yes, Mixpanel is the right choice because it gives you 20 million free events and a flexible schema.
- If you choose No, go to Question 5.
5. Do you need analytics plus in-app guidance, push, and surveys all in one SDK?
If you want to track behavior and then nudge users with in-app guidance like carousels, slide-outs, push messages, or micro-surveys without stitching tools together, there’s only one choice.
Userpilot is the only platform that bundles analytics, onboarding flows, push notifications, and surveys into a single, no-code mobile SDK.
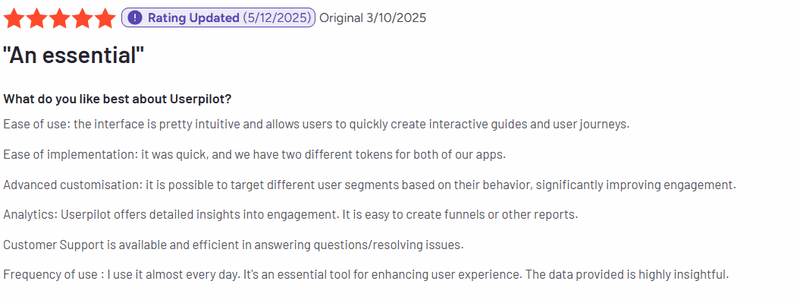
Check out what our users say about our platform:
💡Spotlight: Userpilot Analytics
Unlike other tools, Userpilot gives you a unified view of user engagement data, proactively helps prevent churn, and allows you to optimize your product strategy while increasing user satisfaction. Here are the features that make it happen:
Feature tagging
Want to quickly understand user interactions without bugging your dev team for every small tweak? With Feature Tagging, you can effortlessly tag any UI element and instantly track how different user segments interact with specific features.
It’s fast, intuitive, and requires no coding, so your product team can swiftly make data-backed decisions and improve user experience faster than ever.
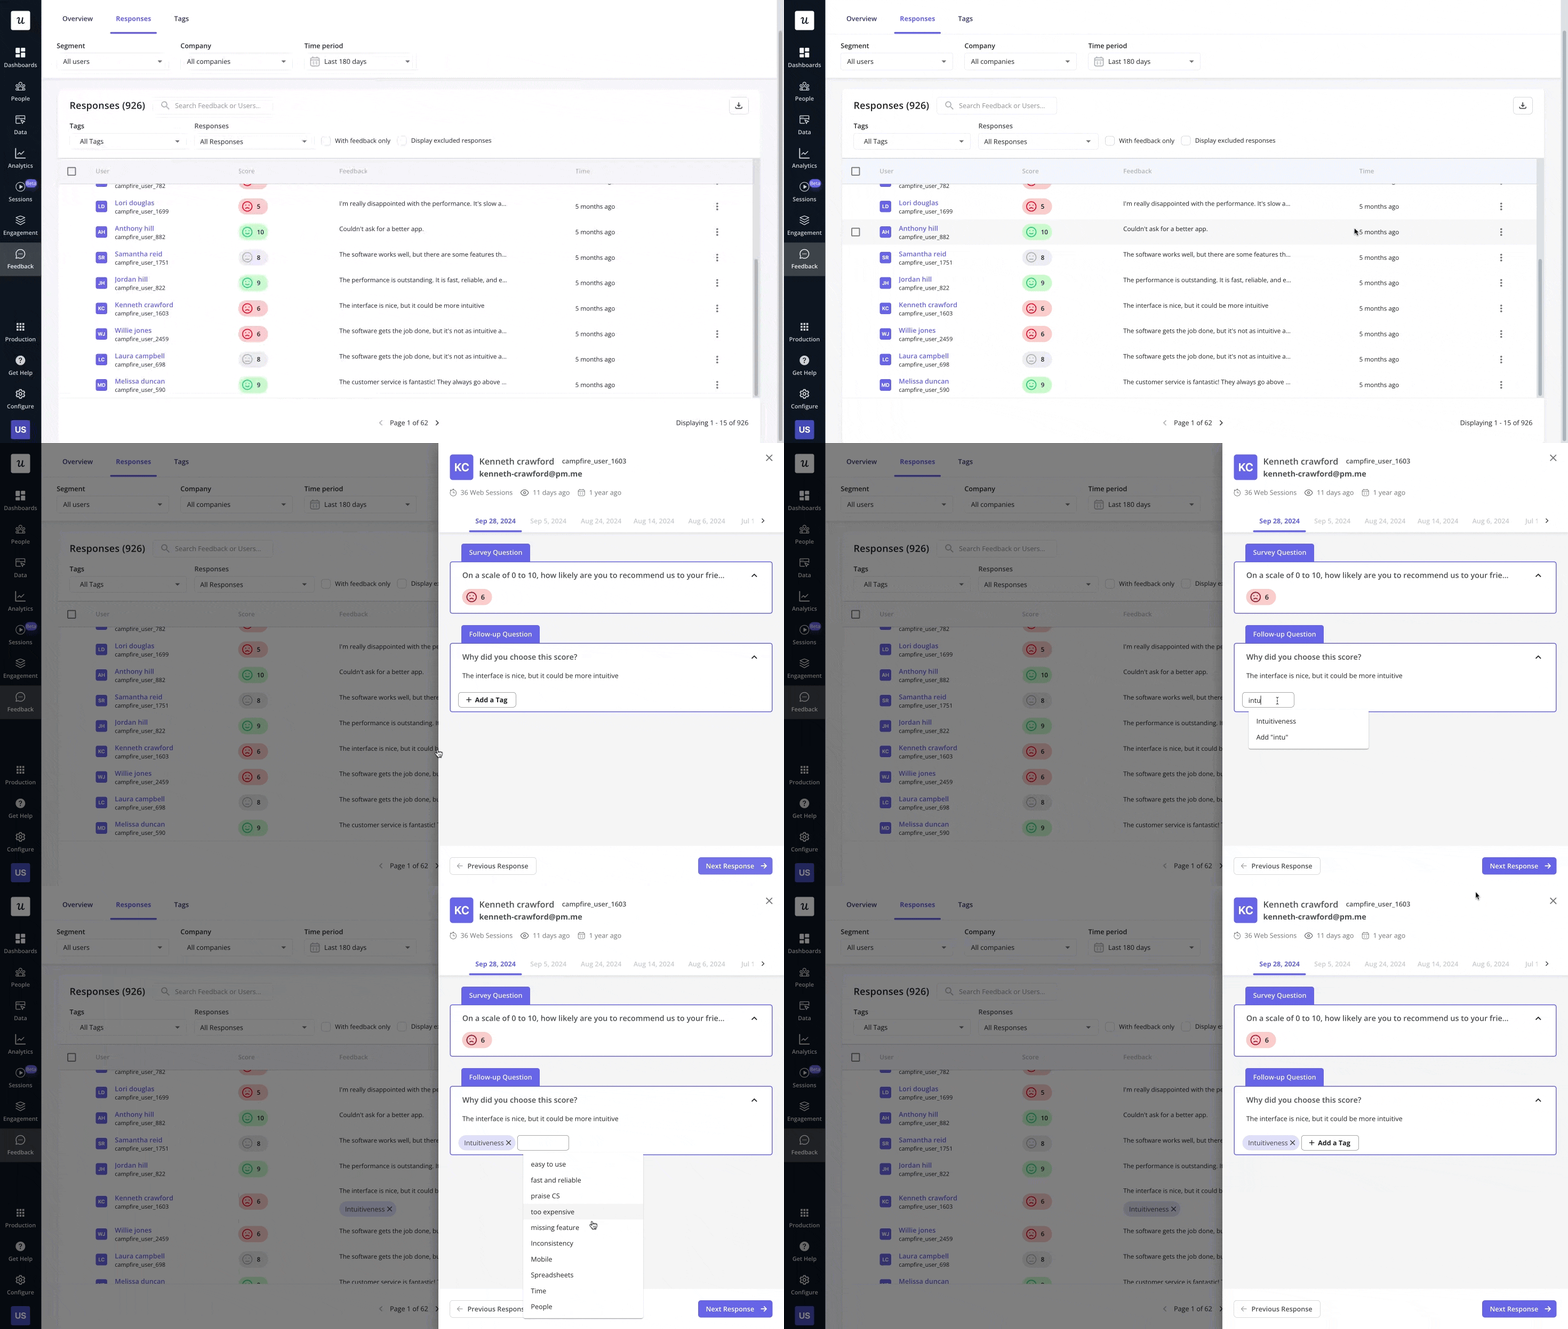
User sentiment analysis and NPS response tagging
Find out whether your product and marketing efforts resonate with your users by embedding customizable in-app microsurveys. By tagging NPS responses and linking user feedback directly to feature usage, your product team can spot unhappy users early, reduce churn, and consistently deliver features your customers love.
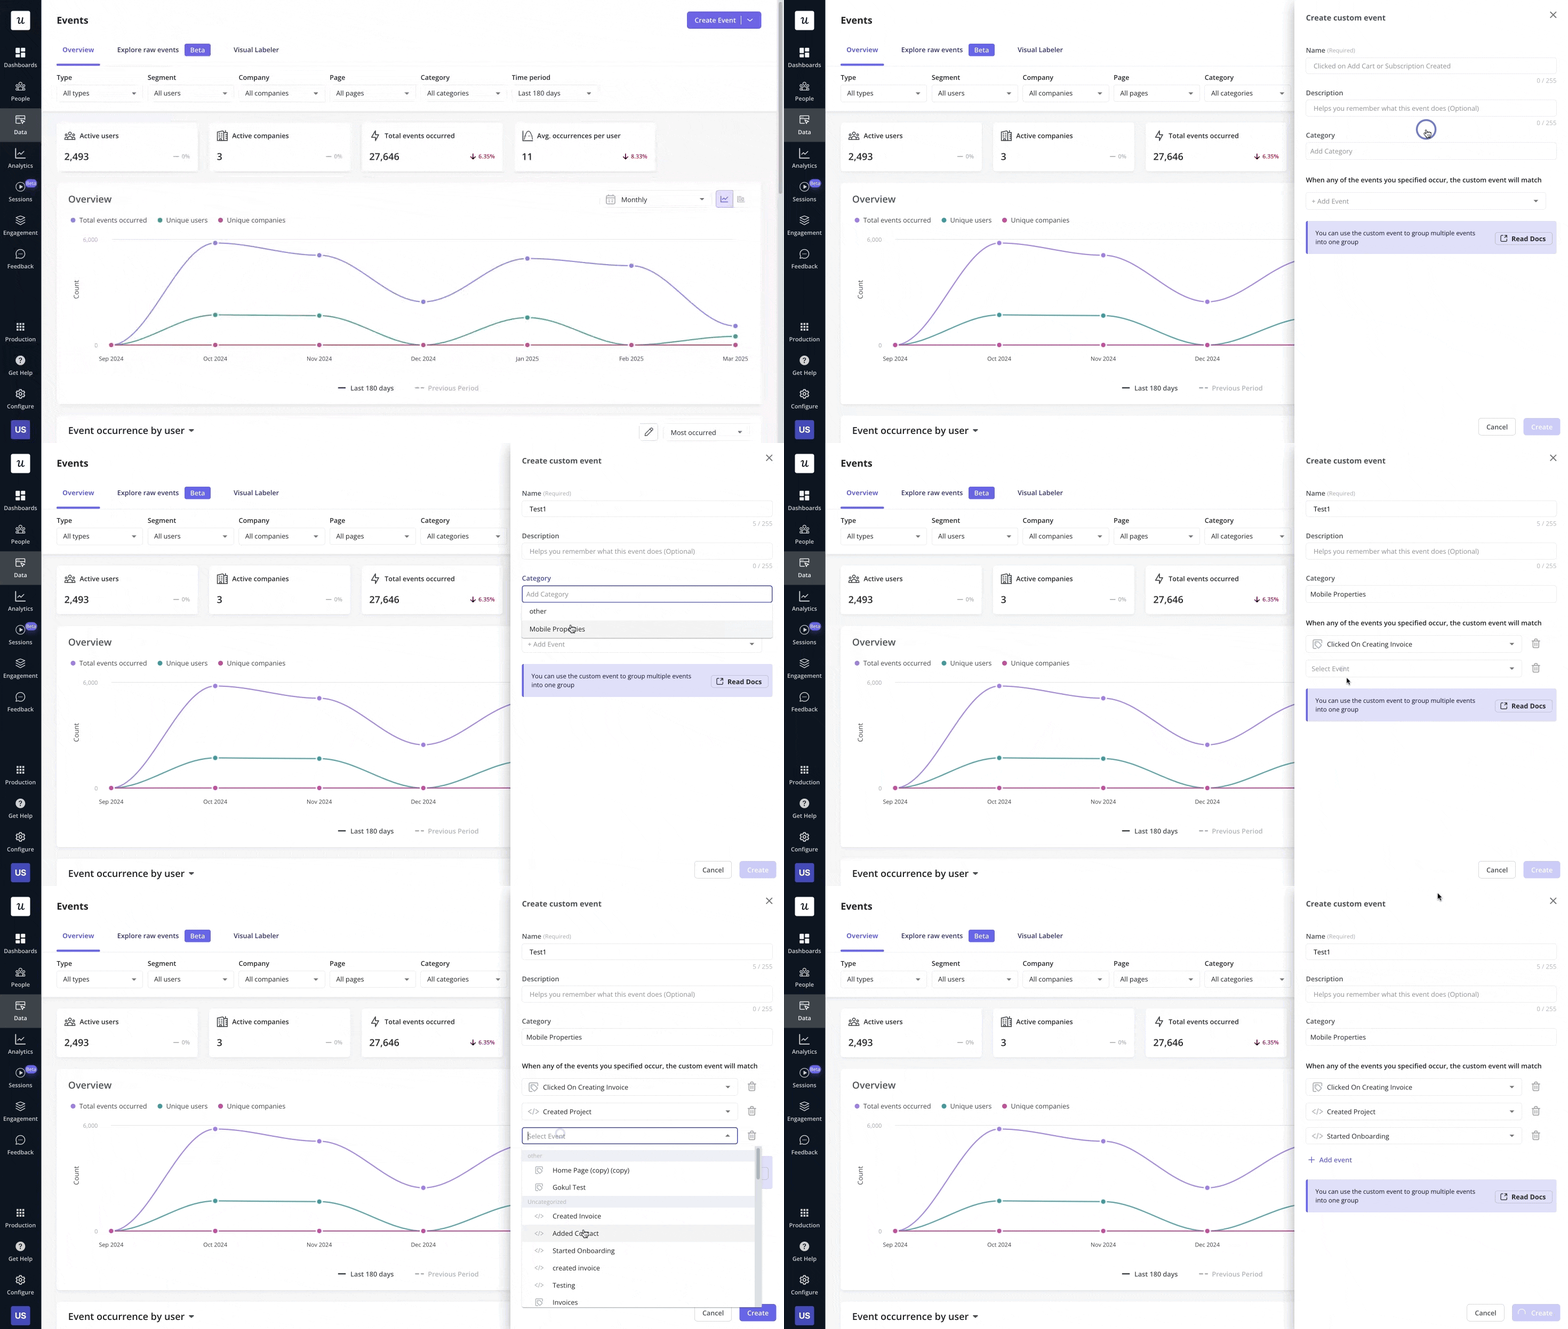
Custom events
Custom Events let you define and monitor crucial in-app behaviors with an intuitive UI or seamless REST API integration. You’ll instantly know when users achieve important goals like upgrades or milestones, helping your team proactively boost conversions and enhance user satisfaction.
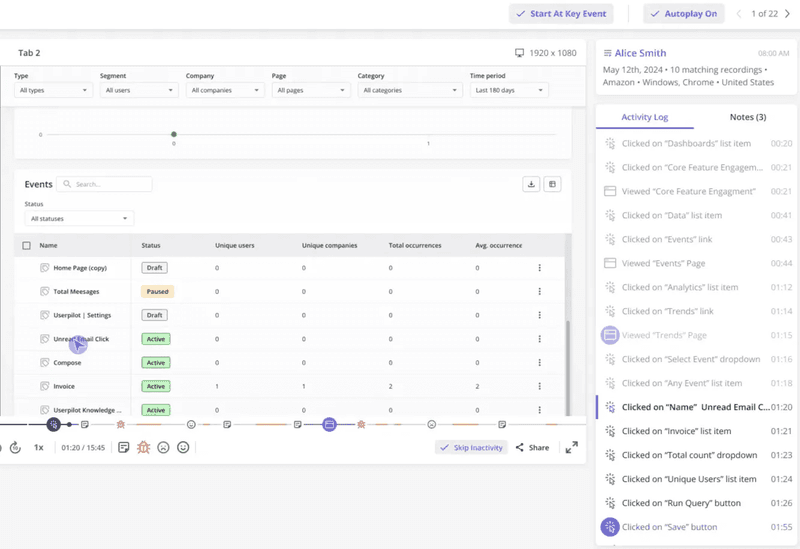
Session replay-powered analytics
Wondering why users drop off at critical points? Session replays let you dive straight into user sessions, pinpointing exactly what stops them from succeeding. This real-time insight equips your product and dev teams to quickly address friction points, streamline improvements, and deliver a smoother user experience.
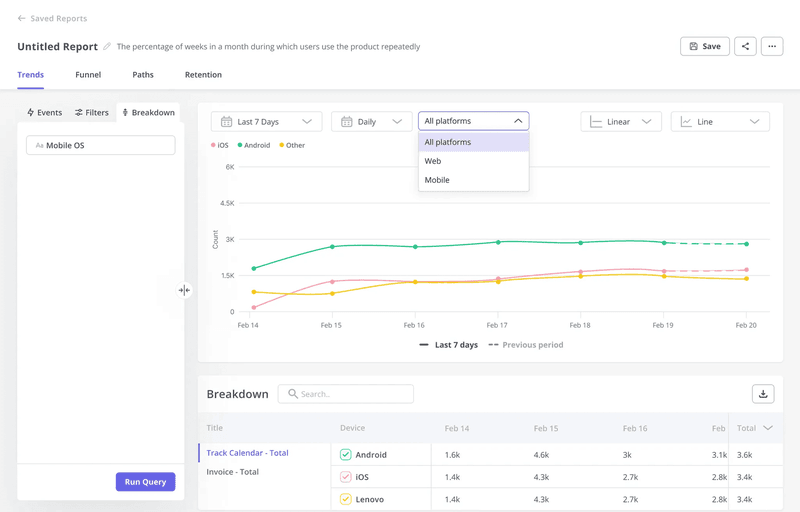
Unified analytics across mobile and web
With unified analytics, you bring all your mobile and web data into one clear, comprehensive dashboard. This cohesive overview helps your product and development teams understand the complete user journey, enabling smarter, unified decisions that elevate your entire product experience.
These combined capabilities save you integration headaches and boost retention by letting you see, hear, and respond to your users in one place. Learn how Beable unlocked 20% less churn with this approach.
Userpilot pricing
Userpilot and Amplitude take very different approaches to pricing, so here’s how they compare (all figures are billed annually):
Amplitude Analytics
- Starter: Always free for up to 50,000 Monthly Tracked Users (MTUs). You get core product analytics, templates, session replay, unlimited feature flags, and web experimentation.
- Plus: From $49 / mo for up to 300,000 MTUs, adding behavioral cohorts, feature tagging, custom audiences, and online support.
- Growth & Enterprise: Custom-priced based on MTU volume and advanced needs, feature experimentation, predictive audiences, cross-product analysis, dedicated support, etc.
Userpilot
- Starter: From $299 / mo for up to 2000 Monthly Active Users (MAUs). Includes in-app engagement, user segmentation, usage trends, and an NPS survey
- Growth: Custom-priced for growing teams, adding product analytics, retroactive event autocapture, in-app surveys, a resource center, and mobile support as an add-on
- Enterprise: Custom-priced for large teams, with premium integrations, bulk data export/import, SAML SSO, and enterprise-grade security
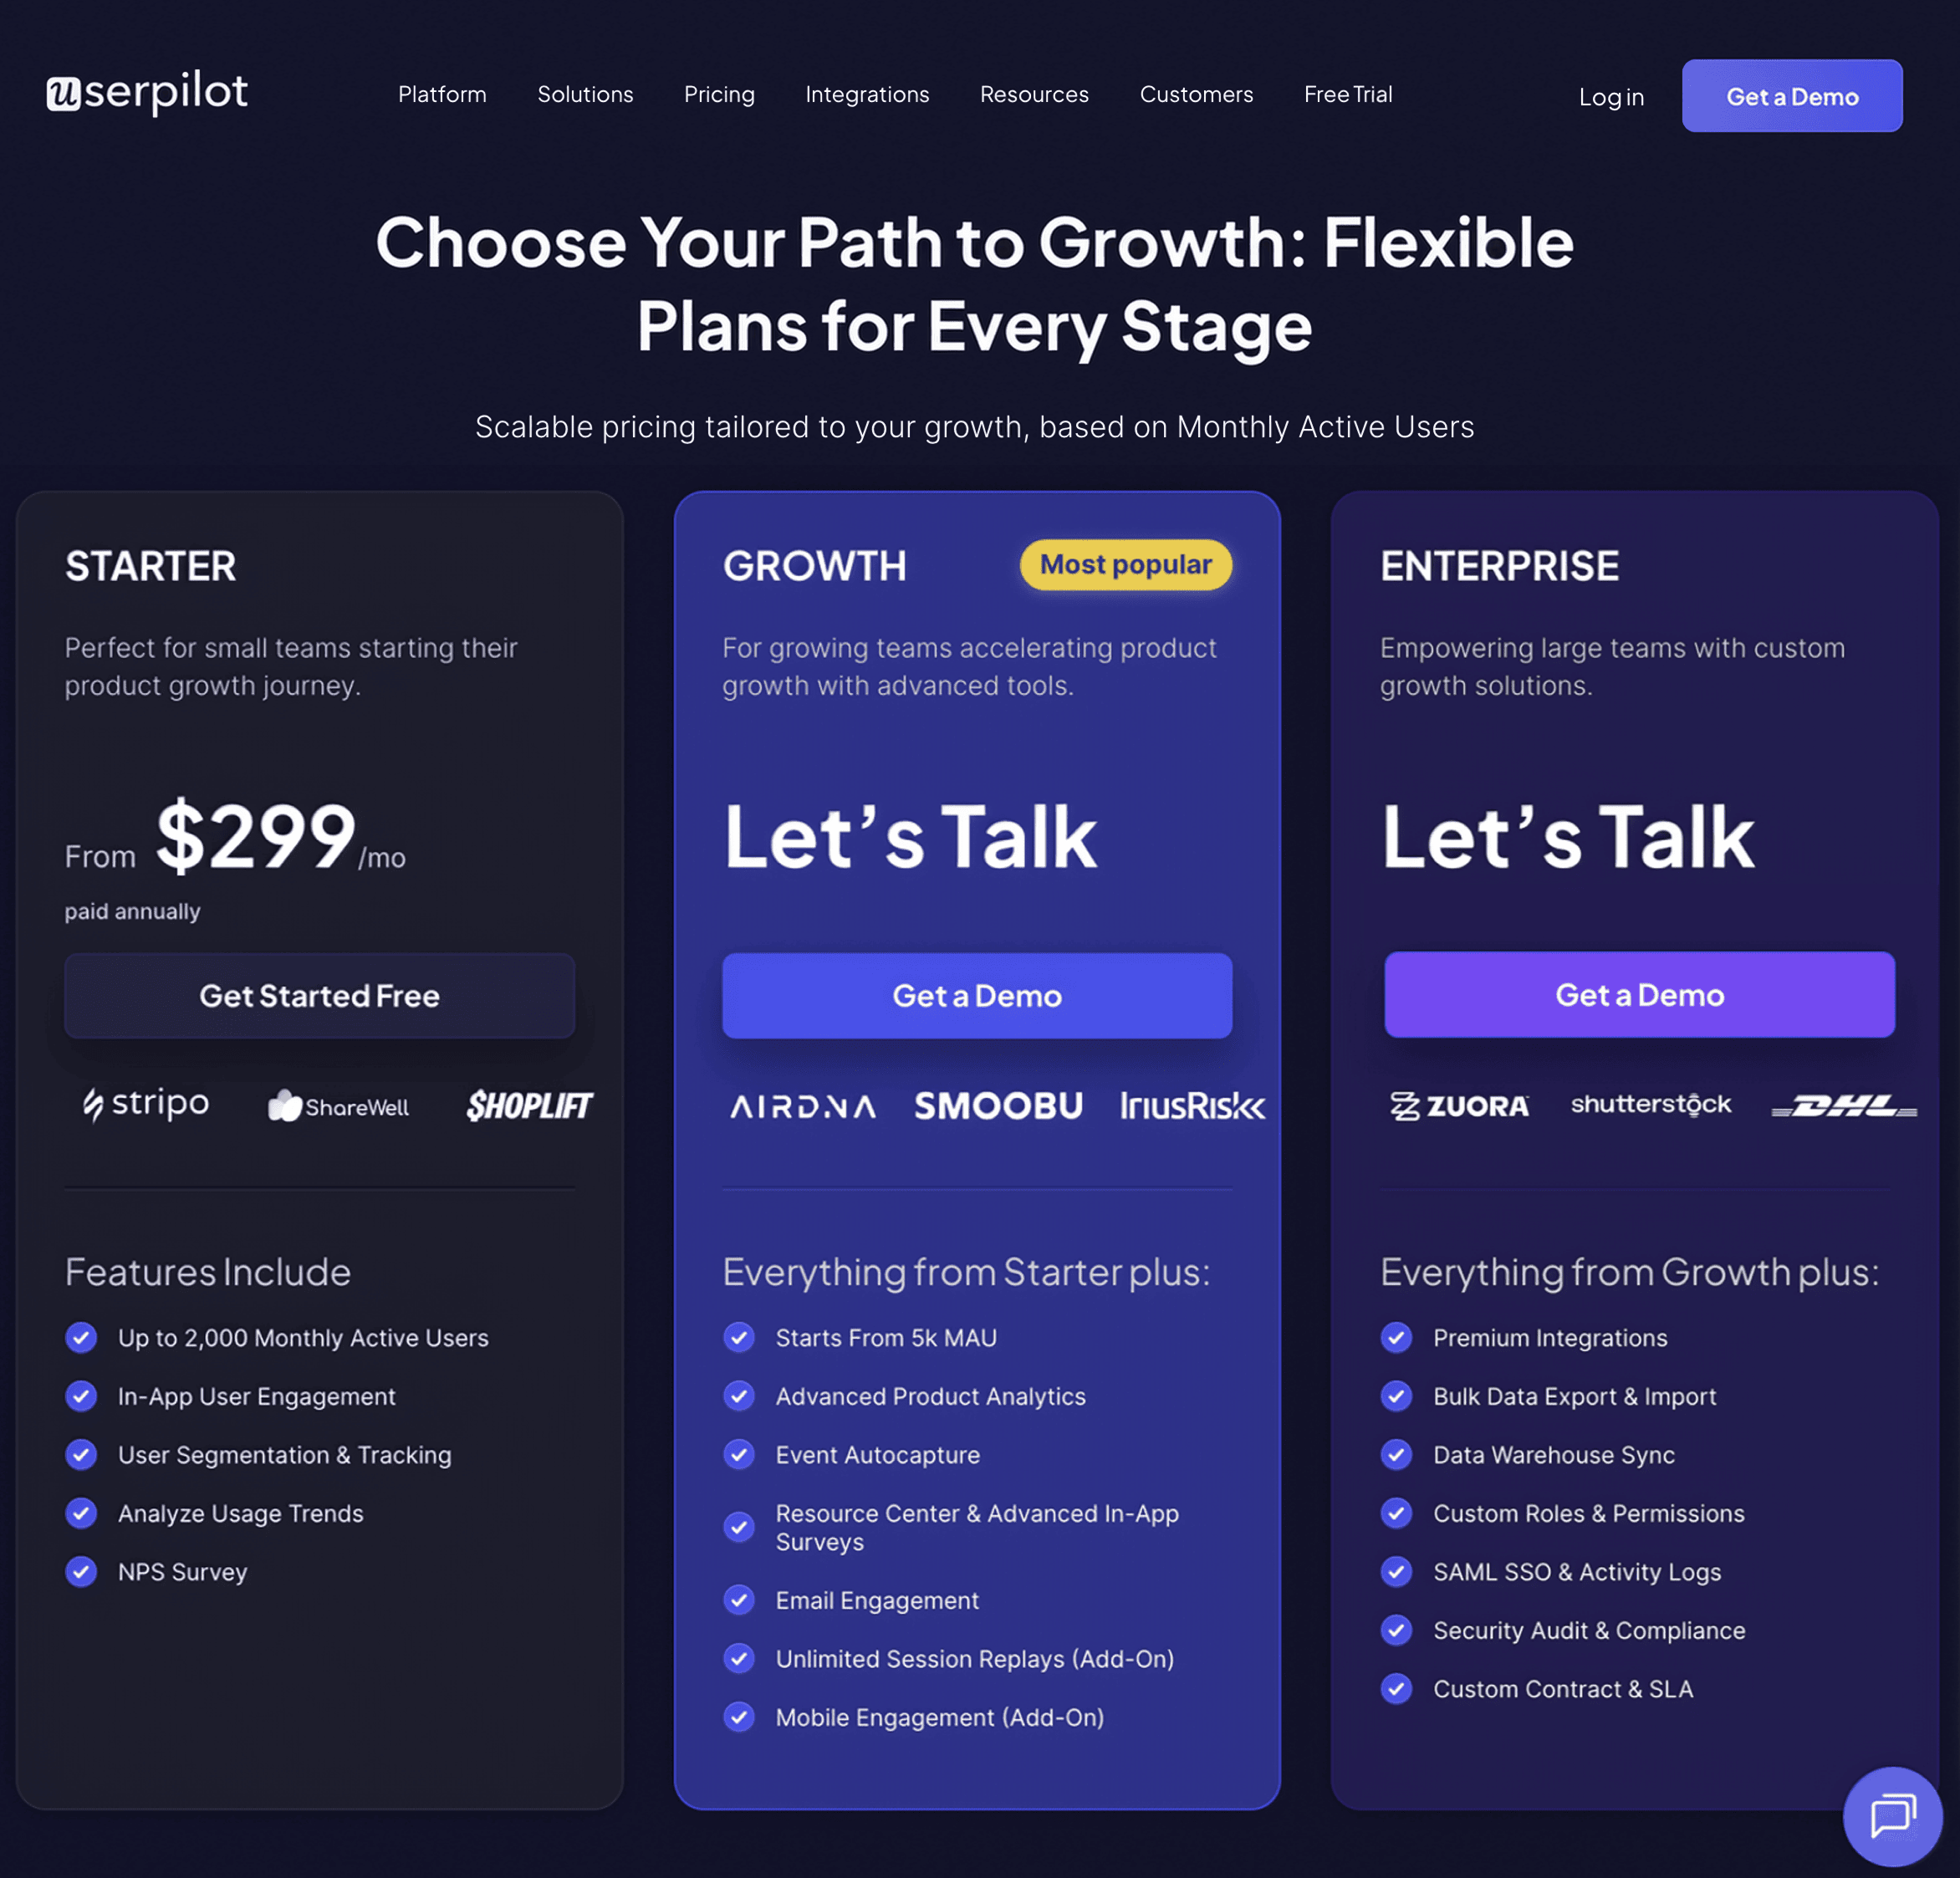
Since Amplitude’s free tier covers up to 50,000 MTUs, it’s the most cost-effective way to start if you only need behavior analytics. Userpilot’s pricing begins at $299/mo and scales with MAUs. Given that Userpilot uniquely bundles analytics, in-app guidance, push, and surveys into one SDK, the extra cost may be justified if you’re looking to replace multiple tools with a single solution.
Move the needle with powerful analytics
Amplitude surfaces deep insights into user behavior and helps teams make data-backed decisions faster. But when you want analytics that tie directly into onboarding flows, in-app messaging, and feedback loops without writing a line of code, Userpilot is the right choice.
Ready to see how you can track every touchpoint and guide users toward value in one place? Book a demo with Userpilot today.
FAQ
Is Amplitude better than Google Analytics?
They serve different needs: GA4 excels at web traffic and marketing metrics, while Amplitude specializes in deep, event-based product analytics, funnels, cohorts, and pathfinding, making it the stronger choice for understanding in-app behavior.
Who is the CEO of Amplitude Analytics?
Spenser Skates is the co-founder and CEO of Amplitude.
Which companies use Amplitude?
Amplitude powers analytics at thousands of organizations, from startups to Fortune 100 enterprises. Notable customers include Dropbox, PayPal, DoorDash, Disney, NBC Universal, Capital One, and Atlassian.


