A/B Testing Analytics: Definition, Process, and Examples


What is A/B testing?
A/B testing is a data-driven method to optimize the performance of a product or landing page. It’s a form of statistical hypothesis testing. It involves testing a variation of a product, marketing campaign, or ad against a control group to see if the variation outperforms the original version.
This process helps determine, with statistical significance, which elements bring better results, such as identifying the headline that leads to a higher click-through rate
Types of A/B testing method
There are several types of A/B testing methods, each suited to different scenarios and objectives.
Let’s go over each of them:

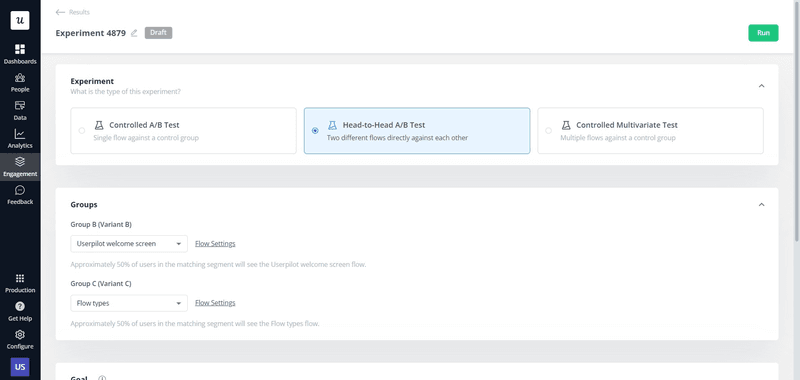
Controlled A/B testing
Controlled A/B testing (often called split test) is a straightforward method where a different version of a variable is tested against a control, which is often the current version of the variable.
For example, you might test an interactive walkthrough in your product onboarding to see if it improves feature adoption rates. In a controlled test, the control (the version without the walkthrough) shows up to half of your audience, while the other version (the variation) shows up to the other half.
The performance of the variation is then measured against the control to determine if it’s worth using.
Head-to-head A/B testing
Head-to-head A/B testing is similar to controlled testing but is used to compare two distinct variations, such as two different signup pages.
For instance, you could test two different upselling messages to see which one has higher conversion rates without having a control group. This makes it a great method to test two different ideas at the same time without having to go through multiple controlled tests.
Multivariate testing
Multivariate testing involves testing multiple variables at the same time (hence multi + variate), putting every possible combination against each other. It follows a factorial structure, which means that the total number of variations is the result of multiplying the number of iterations of each element.
For example, if you’re going to optimize the same web page with:
- 3 headlines.
- 2 body copies.
- 2 information forms.
The number of combinations possible would be 3×2 ×2 = 12
This way, you can find out what combination of individual elements brings the ultimate best results.
A/B/n testing
A/B/n testing is an extension of traditional A/B testing, where you test multiple variations against the control simultaneously.
This method allows you to compare multiple versions of a single element, such as different call-to-action buttons, to determine which one performs best. It’s particularly useful when you have several ideas to test and want to identify the most effective option quickly.
For example, if you’re testing call-to-action buttons on a signup page, you could test the original button (control) against three new variations: one with different text, one with a different color, and one with a different size.
This way, you can see which variation leads to the highest signup rate, and improve your product performance more efficiently.
How A/B testing analytics works
A/B testing analytics involves a systematic process to ensure that the tests are set up correctly, the data is accurate, and the results are reliable.
That said, here’s a three-step framework to perform significant A/B tests:
Form a hypothesis
The first step in A/B testing is to form a hypothesis. This involves creating a clear statement that you want to test, which usually comes from identifying a problem or an area for improvement.
However, for A/B testing, there needs to be a null and alternative hypothesis.
A null hypothesis is a claim that we’re trying to disprove. And the alternative hypothesis, which is the claim that we’re trying to prove with statistically significant data.
In CRO, the null hypothesis claims that there’s no significant difference or relationship between the control and the testing subject—indicating that the sample observations result purely by chance—While the alternative hypothesis states that the variant does represent a significant improvement.
For instance, you might hypothesize that an interactive flow on your onboarding process will increase user engagement more than a static welcome screen. The null hypothesis would be that there is no difference in user engagement between the two versions, while the alternative hypothesis is that the interactive flow will lead to higher engagement.
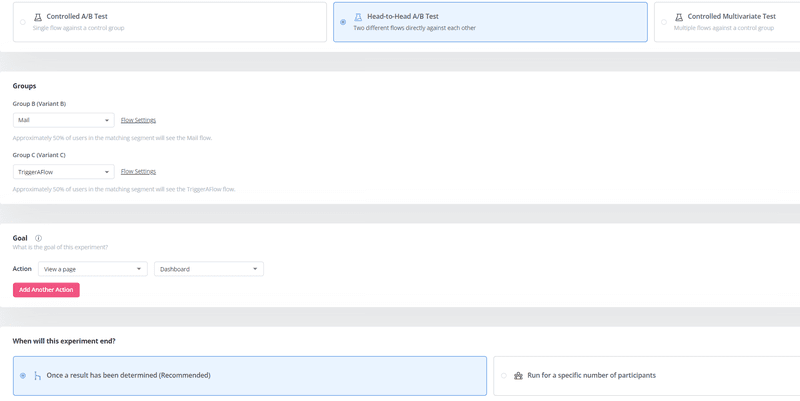
Choose an A/B testing method
Once you have a hypothesis, you must choose an A/B testing method.
This can depend on your hypothesis, the variant you are testing, and the volume of data you can collect. So, if you have a simple test with two variations, for example, a controlled A/B test or head-to-head test might be sufficient. Or, If you have multiple variations of a single element, A/B/n testing can help you identify the best option.
However, if you’re testing multiple variables simultaneously, multivariate testing might be more appropriate. For instance, if you want to test different combinations of headlines, images, and call-to-action buttons on a landing page, multivariate testing would allow you to evaluate all possible combinations.
Note: You should also consider the amount of data you can collect, as more complex tests like multivariate testing require larger datasets for statistical significance.
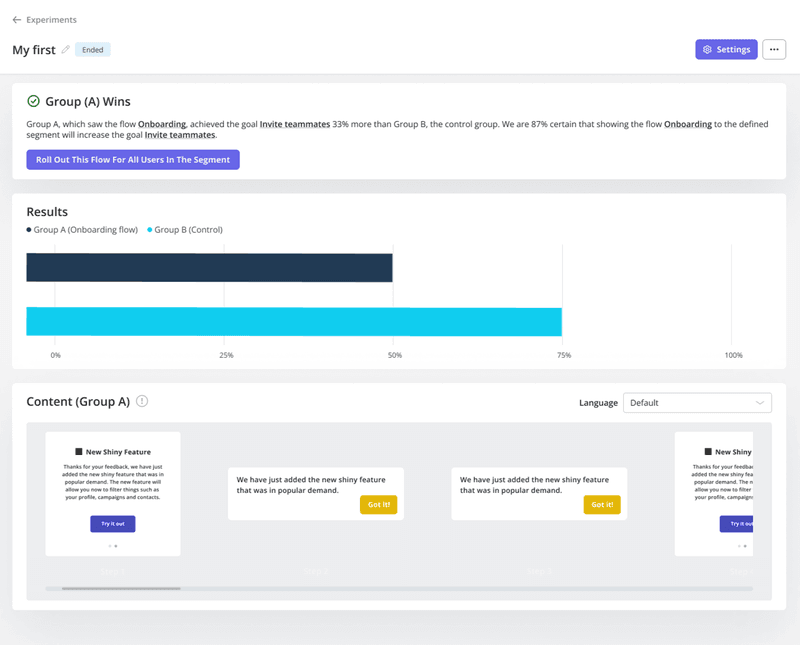
Determine which version has statistically significant results
After your tests are ready to run, you’ll need to collect data and perform statistical analysis to get significant results. This is to prove that the difference in performance between the control and the variation is not due to random chance.
To achieve statistical significance, you need a minimum sample size, which depends on the expected effect size and the baseline conversion rate.
For example, if you expect a 10% increase in conversion rate and your baseline is 20%, you can use statistical calculators to determine the required sample size (or calculate it manually using other formulas that require more data, such as the P value).
Once you collect the necessary data, you can use statistical tests like chi-square or t-tests to determine if the results are significant.
A/B testing examples for SaaS
Now that we know the overall process to perform effective A/B testing analytics. Let’s go over some real-world examples of successful A/B testing in SaaS companies.
Test different upsell prompts to drive conversion rates
With tools like Userpilot, you can test different ways to trigger upsell prompts that lead users to upgrade their plans. For instance, you might test a pop-up prompt against an in-app message to see which one drives more upgrades.
The goal metric here is the trial-to-paid conversion rate, specifically the number of users upgrading their plans. The testing method used can be a head-to-head or controlled test, where the two prompts are shown to different samples of users.
As a result, by comparing the conversion rates of these segments, you can determine which upsell prompt is more effective in driving conversions—and generating more revenue.
Instagram tests unskippable ads
Instagram has been performing an infamous test that adds unskippable ads to its platform, requiring users to watch an ad before they can continue scrolling.
This test aims to provide more opportunities for advertisers and increase ad revenue, but will users accept it?

The goal metric here is probably user engagement and ad visibility. The testing method is controlled testing, where some users see the unskippable ads while others do not.
In the end, by analyzing the controlled tests, Instagram can determine the impact of unskippable ads on user behavior and ad effectiveness.

YouTube tests limiting logged-out access to its videos
YouTube tested limiting the number of videos users can watch without signing in. This test aims to increase the number of signed-up users and reduce bot activity and exploits on the platform.
In this case, the goal is not to engage more users directly but to increase the number of authenticated users, thereby enhancing security and reducing unwanted activity. Also, the testing method is controlled testing, where logged-out users are divided into groups with different viewing limits.
By comparing the sign-up rates between these groups, YouTube can assess the effectiveness of this strategy in increasing user registrations.

Conclusion
A/B testing analytics are the most scientific way to achieve business goals.
But it doesn’t have to be unique to data scientists. You should always be on the lookout for areas of improvement within the product. So, develop your hypotheses, conduct multiple tests, and make the most evidence-based decisions available.
Plus, if you’re a product manager who needs to run in-app A/B tests without code, book a demo call with our team and get our help!
![]()
Try Userpilot and Take Your Product Experience to the Next Level

About the author