
What Are Attitudinal Metrics and How To Use Them To Measure User Experience?
Wondering which attitudinal metrics you should track to measure the effectiveness of your UX?
Along with numerous operational metrics (cost per acquisition) and business metrics (revenue per month), you should also pay attention to user experience metrics. These help you understand:
- how users feel about your product
- whether or not the user interface is easy to use
- how much time users spend on a feature
- where users are facing the most issues
In this article, we talk about four key attitudinal metrics you can monitor to create a better user experience and a UX strategy that works.
Ready? Let’s get started!
Try Userpilot Now
See Why 1,000+ Teams Choose Userpilot

Summary of attitudinal metrics
- UX metrics are numeric data points that help you measure, analyze, and monitor user experience.
- You should track both behavioral and attitudinal metrics as they help you identify friction points and optimize the user experience throughout the user journey.
- The most used attitudinal metrics to measure the effectiveness of your UX through the Net Promoter Score (NPS), Customer Effort Score (CES), Customer Satisfaction Score (CSAT), System Usability Scale (SUS), and Usability Metric for User Experience (UMUX).
- Userpilot helps you optimize attitudinal metrics and improve customer satisfaction by offering a completely code-free solution.
- It helps you get quantitative and qualitative feedback with different microsurveys.
- You can use response tagging and segment survey responses into different themes.
- You can create automated in-app experiences based on response tags. Book a demo to see it in action.
What are UX metrics?
UX metrics are quantifiable data points that allow you to measure, analyze, and monitor the user experience of your product over time. They are crucial for ensuring that your UX design is evaluated by using fair evidence and not just opinions.
Types of UX metrics
There are two types of UX metrics: behavioral (what users do with your product) and attitudinal (how users feel about your product).
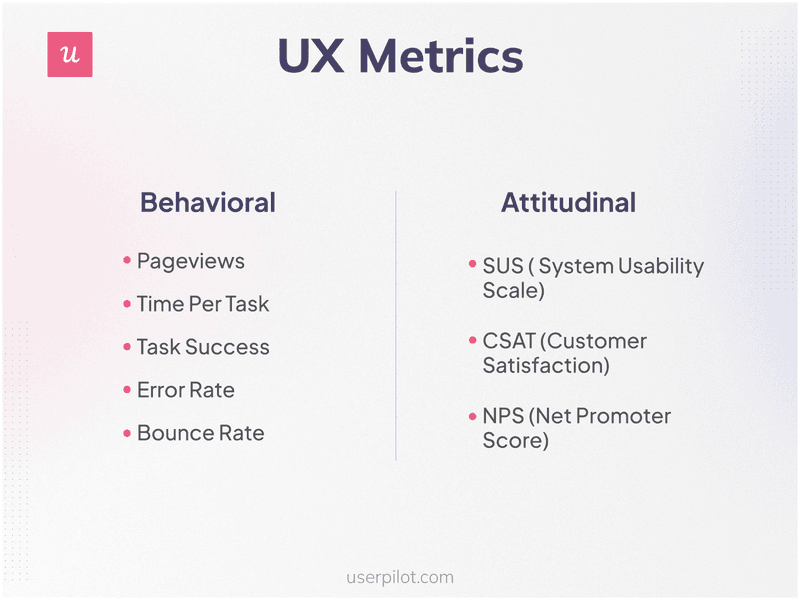
Now let’s go into details and see what and how different they are.
What are behavioral metrics?
Behavioral metrics reflect how users interact, what they do, and what problems they face with your product. This consists of user activities such as:
- pageviews
- time users spend on a task
- task success rate
- error rate
- the bounce rate
Most behavioral metrics mentioned above are relevant to product usability, or how easy it is to use your product. Remember that users quickly locate an alternate option when they can’t achieve their goals using your product.
What are attitudinal metrics?
Attitudinal metrics involve using quantitative data to explain how users feel and what they say about your product, i.e. user attitudes toward your product. You can use these metrics to gauge user loyalty, trust, and satisfaction.
Some examples of attitudinal measures include the System Usability Scale (SUS), Customer Satisfaction (CSAT), and Net Promoter Score (NPS).
Why should you track both behavioral and attitudinal metrics?
With UX metrics, you can assess how well users are connecting with your products. They gather a ton of data, which can help you validate product designs. While they can show what is going on, they can’t explain the reasons behind them.
This is where your UX team comes in. Using the right UX metrics, you can solve a myriad of problems. Such as:
- Identifying friction points: Finding out customer pain points and common user errors can help you improve user satisfaction and user engagement, along with creating a better app interface.
- Optimizing the user experience: Reducing user error rates can help you deliver greater value to your customers. This can boost user retention and also increase your product’s conversion rate.
- Tracking users throughout the customer journey: To fully understand a user’s experience and improve your user research efforts, you must track user activities and collect customer feedback across different touchpoints.
How to measure UX effectiveness with attitudinal UX metrics?
Here are five attitudinal metrics you should track to measure the effectiveness of your UX designs:
- Net Promoter Score (NPS)
- Customer Effort Score (CES)
- Customer Satisfaction Score (CSAT)
- System Usability Scale (SUS)
- Usability Metric for User Experience (UMUX)
Net Promoter Score (NPS)
The Net Promoter Score is a metric that involves asking your users how likely they are to refer your product to others on a scale from 0 to 10 (not likely at all to extremely likely).
Users are divided into three groups based on their ratings:
- detractors (scoring between 0 and 6)
- passives (scoring 7 or 8)
- promoters (scoring 9 or 10)
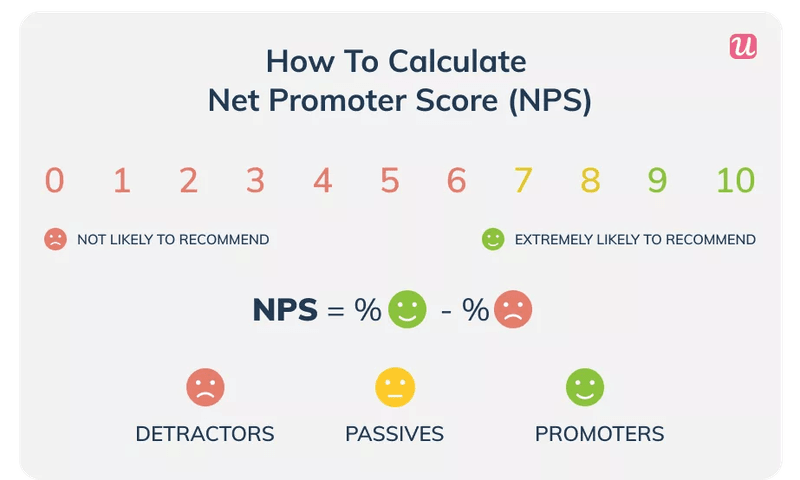
To calculate the score, you have to divide the percentage of promoters by the percentage of critics, which can range from -100 to 100. A higher score indicates high levels of user loyalty and customer advocacy for your product.
When to use NPS surveys?
It’s recommended to send NPS surveys at various stages in the user journey, such as shortly after onboarding or after the user has spent a long time with your product.
One of the best ways to conduct this survey involves setting up triggers for specific user behavior, actions, or in-app experiences.
Here are some examples:
- After users have spent a specific amount of time: You can send NPS surveys after your customer has used your product for a while. For example, you can schedule it to be sent out a day before the trial period is over.
- After a ‘success’ milestone: ‘Success’ can be defined in multiple ways depending on your product’s use case. For example, an important milestone for a product analytics tool can be when users publish their first survey.
- After users completely adopt your product: This happens when your users engage with all the core features of a product.
Customer Effort Score (CES)
Customer Effort Score (CES) is a metric that measures how much effort is required by a user to interact with your product. This includes how easily they can resolve a problem, request a new feature, or simply ask you a question.
Measuring this metric can lead to less friction, as you can determine where a user needs help. It helps you answer questions such as:
- Are they facing problems using a new feature?
- How effortlessly can they contact customer support?
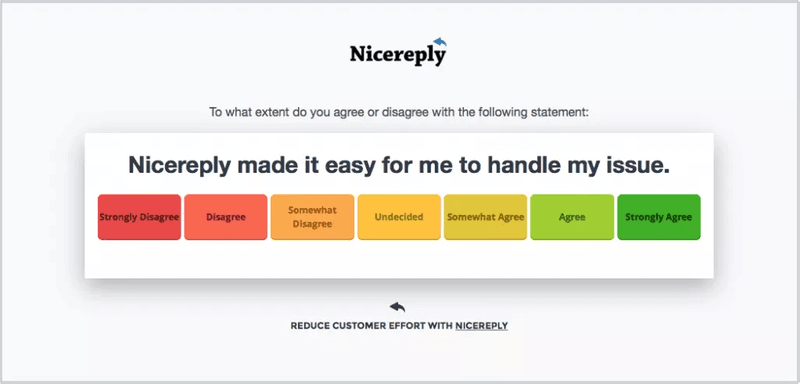
Here’s how Nicereply conducts a CES survey.
How to measure Customer Effort Score?
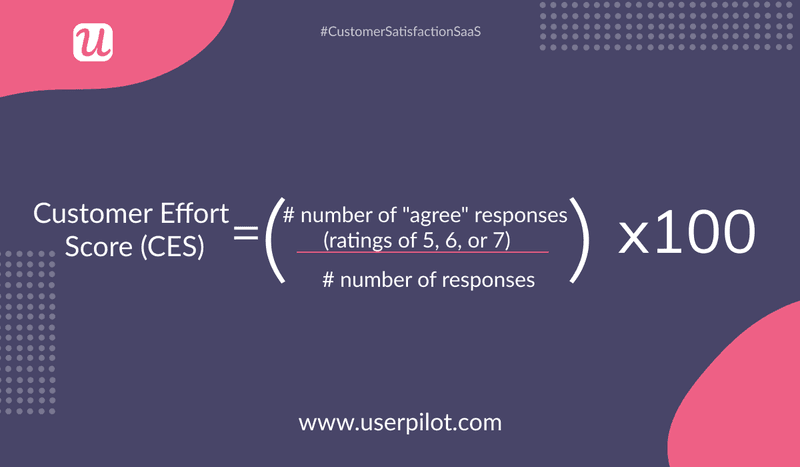
To calculate the CES score, you need to divide the number of responses where users “agree” with you by the total number of responses.
Customer Satisfaction Score (CSAT)
The Customer Satisfaction Score survey, like NPS, asks your users one question only: “How satisfied are you with our product?”. You can either give users the option to rate it by using a numeric scale, emojis, or texts.
Here’s how Hubspot conducts a CSAT survey.

How to measure Customer Satisfaction Score?
To calculate your CSAT score, you need to divide the number of positive responses (satisfied customers) by the total number of responses and multiply it by 100 to express it as a percentage.
For example, if you have a total of 100 responses and 55 of them are positive, your CSAT score will be 55%.
System Usability Scale (SUS)
SUS delves more deeply into the actual user experience of a product than NPS and CSAT, which are more customer experience measures.
The main purpose of SUS is to conduct usability testing, and you can assess that by using this questionnaire.
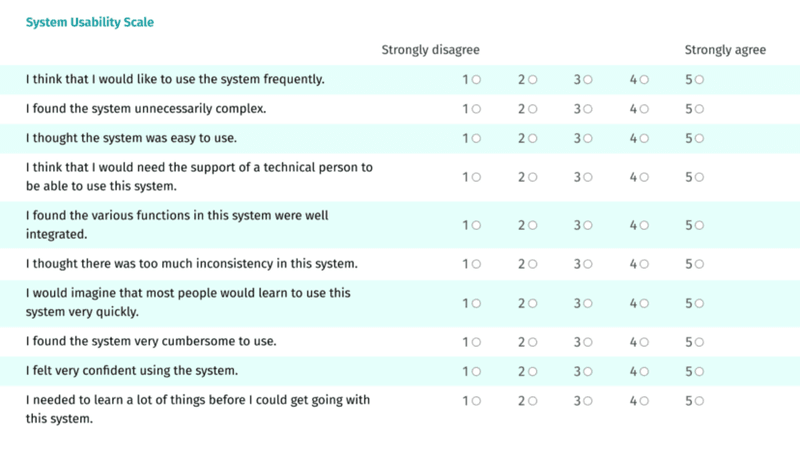
Ten questions make up the survey, five of which have positive language (“I felt very confident using the system”) and five of which have negative wording (“I found the system unnecessarily complex”). Users respond to the questions on a scale from 1 (strongly disagree) to 5 (strongly agree).
The final score is always between 0 and 100 and is calculated by adding and subtracting the answers following certain rules.
When to use SUS?
SUS is most frequently used after a test person has assessed a product, software, or website. The score works much better if the test subject has used the system for a while, either by completing particular tasks or a longer excursion.
Usability Metric for User Experience (UMUX)
UMUX is often viewed as a shorter version of SUS. It has four statements, two positive and two negatives, along with a seven-point response scale, from 1 to 7 (strongly disagreeing to strongly agreeing).
UMUX evaluates usability across three aspects: effectiveness, efficiency, and satisfaction. On the other hand, SUS places more importance on perceived usability and learnability.
Here are some sample questions for a UMUX survey.

Also, there is UMUX-Lite, a shorter version of UMUX that only includes two affirmative questions.
When to use UMUX?
You can use UMUX throughout the customer journey as they are very compact and simple, but you can consider using it in the following times for maximum effect.
After onboarding: As a SaaS product owner, your goal should always be to make a user’s initial experience with your product simple and seamless. First impressions are important. They should feel that your tool is simple to use and can help them do their tasks fast.
Following a usability test: The results of a questionnaire like UMUX after a usability test might help you understand your users’ opinions and attitudes. If your product isn’t easy to use, people aren’t likely to adopt it at the rate you need for your business to expand.
When you test the usability of your prototype, you can identify problems early on. You can even conduct usability tests on products that are already on the market, allowing you to make better upgrades.
Testing New Features: As a product manager, you would want to know if users find a new feature easy to use once you’ve introduced it. UMUX helps you answer questions such as:
- Will users be able to swiftly accept the new feature?
- Will it be simple for them to use, comprehend, and incorporate into the way they currently use your product?
How can Userpilot help you optimize attitudinal metrics and improve customer satisfaction?
Userpilot is a comprehensive product growth platform. It focuses on delivering personalized in-app experiences to increase growth metrics at every stage of the user journey.
It helps you track and measure attitudinal metrics and increase the number of satisfied users of your product. Userpilot is very easy to use and requires no coding at all.
Get quantitative and qualitative feedback with different microsurveys
Userpilot allows you to create multiple types of microsurveys like NPS, CES, and CSAT. You can set them up pretty fast using the available templates.
And with Userpilot’s new mobile features, customers can now trigger their existing and new NPS surveys directly within their mobile app, effortlessly gathering valuable user insights on the go.
You can also add follow-up questions to get better insights and qualitative data behind your scores. This helps you understand what issues customers are facing.
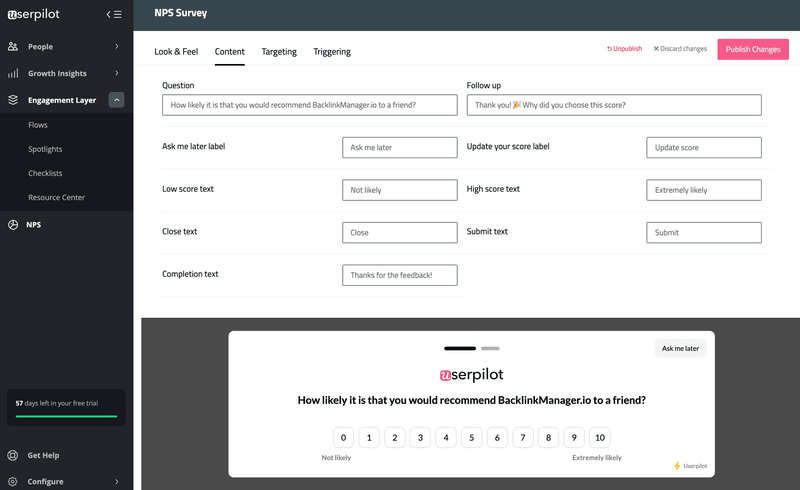
Microsurveys offer a very fast and convenient way of collecting user sentiment and acting on it to modify your product.
Use response tagging and group survey responses into separate themes
As your customers have different needs and use cases, you must learn to segment them and identify them properly.
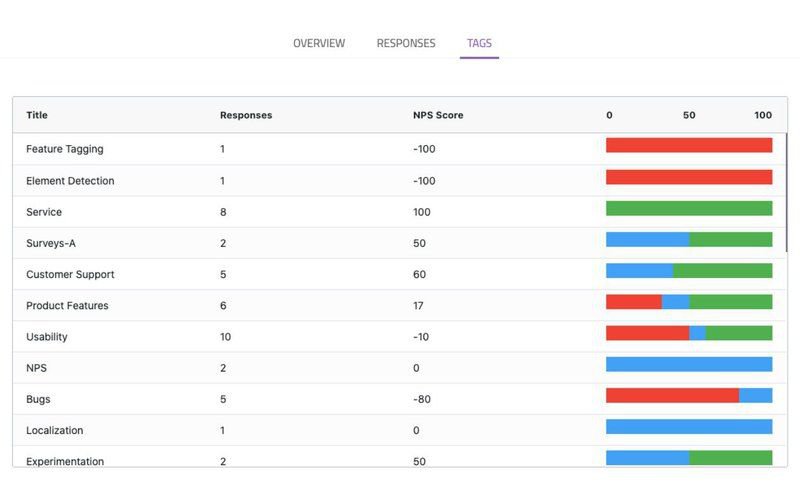
Userpilot lets you group survey responses into separate themes so that you can learn what specific features of your product they enjoy the most and what makes them satisfied and loyal.
Segmenting the responses lets you quantify the results and give context to the numbers. For example, you may find that 80% of the promoters love your product’s user interface or that 50% of the detractors have faced difficulties with customer support.
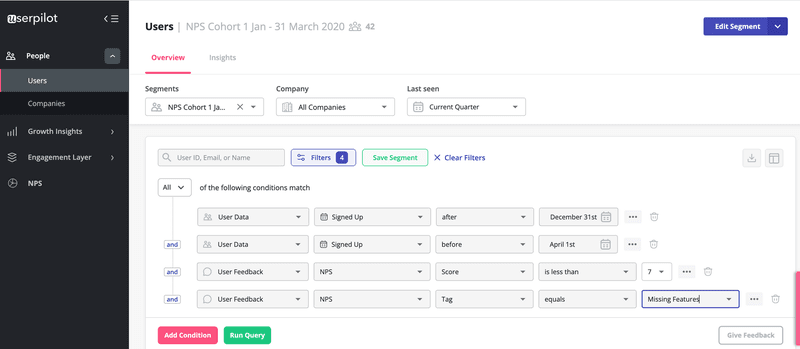
With Userpilot’s advanced segmentation feature, you can dive deep to get a complete picture of your users. You can use numerous and/or conditions to create finely defined segments, which creates room for more thoughtful marketing campaigns.
Create automated in-app experiences based on tags
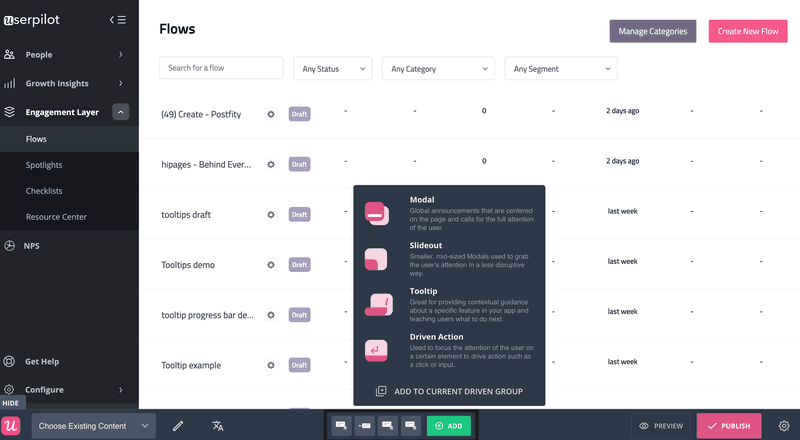
You can create in-app experiences and improve customer experience based on the response tags. Using different modals, slideouts, tooltips, and driven action prompts, you can engage customers in different ways.
As customers get contextual in-app experiences, they become more engaged, which in turn improves your retention rate.
Conclusion
Choosing the right UX metrics and constantly tracking them is the key to your SaaS success.
While tracking metrics is great, you need to act on the collected data if you want to see improvements in your UX.
Want to track attitudinal metrics and collect customer insights? Get a Userpilot Demo and see how you can use the right metrics to minimize the user error rate, design engaging user experiences, and deliver greater value to your users.


