![Business Intelligence Analyst Salary [+ Resources to Advance]](https://blog-static.userpilot.com/blog/wp-content/uploads/2024/07/Business-Intelligence-Analyst-Salary-Resources-to-Advance-450x295.png)
Understanding the salary landscape for business intelligence analysts is crucial whether you’re entering the field or looking to advance your career.
In this guide, we’ll provide an overview of typical business intelligence analyst salaries, explore factors that can influence earnings, and share valuable resources to help you progress in your career.
Let’s get started!
Try Userpilot Now
See Why 1,000+ Teams Choose Userpilot

What is a business intelligence analyst?
A business intelligence (BI) analyst is a data specialist who helps businesses translate raw data into actionable insights. They act as a bridge between the world of numbers and the world of business decisions.
Business intelligence analyst’s main responsibilities
A business intelligence (BI) analyst’s core duties revolve around transforming data into knowledge that fuels better business choices. Here’s a quick rundown of their key tasks:
- Data Acquisition and Sorting: They help gather information from various sources like sales figures, customer surveys, and in-app behavior. This data often needs cleaning and organizing to ensure it’s accurate and usable.
- Data Analysis and Storytelling: Once the data is prepped, they leverage their analytical skills and tools to uncover trends, patterns, and hidden insights. They don’t just crunch numbers; they translate their findings into clear and compelling stories through reports, dashboards, and presentations.
- Strategic Decision Support: Ultimately, such data-driven insights can empower informed business decisions. They provide recommendations for product development, marketing strategies, resource allocation, or customer service improvements.
How much does a business intelligence analyst make?

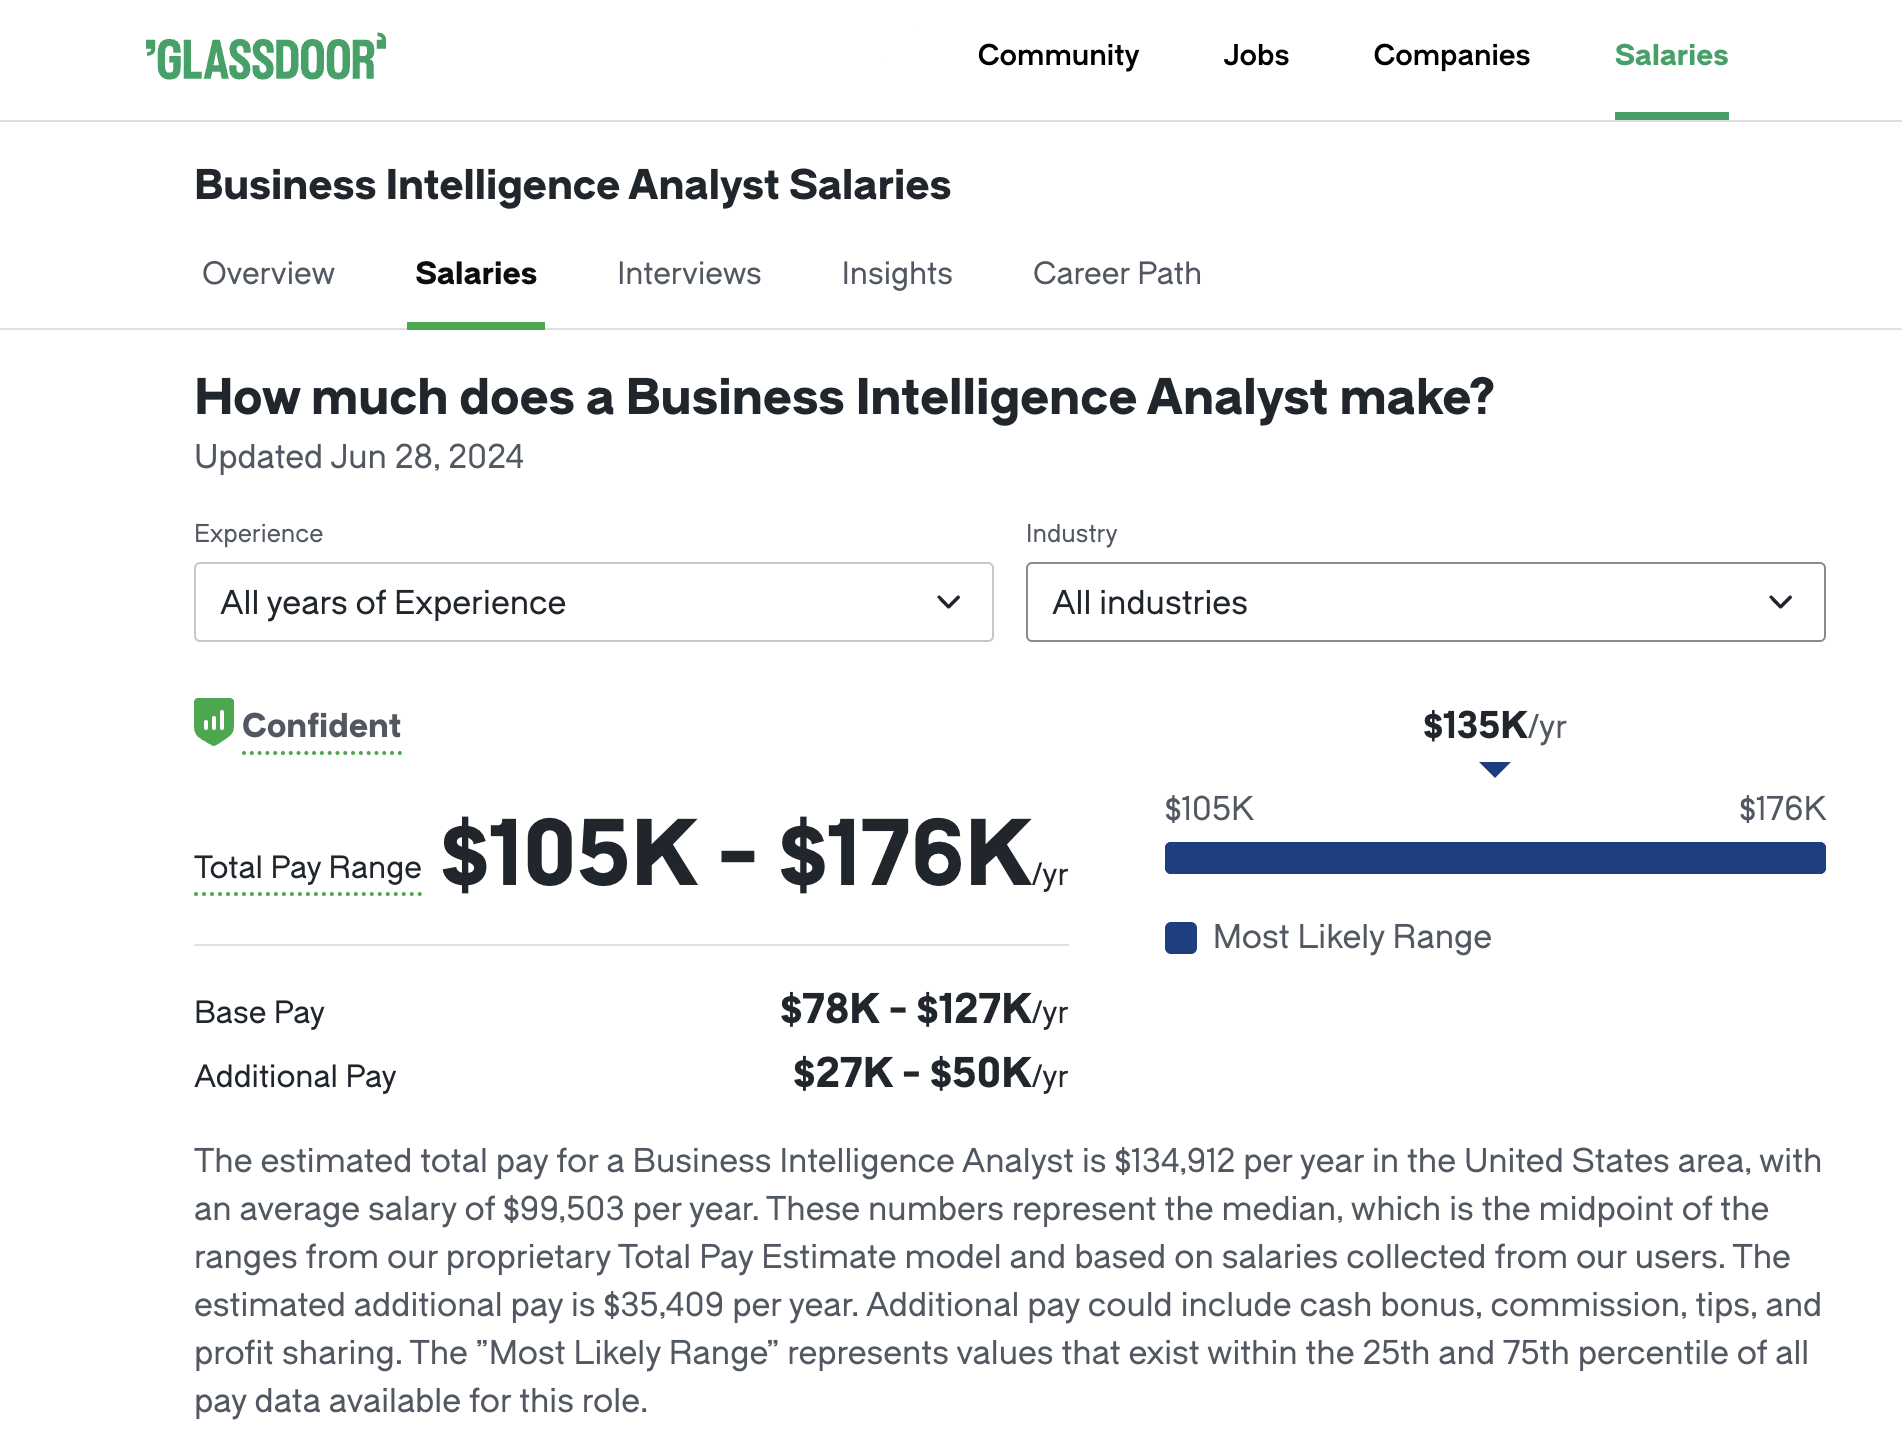
According to Glassdoor data, the estimated total pay for a Business Intelligence Analyst in the United States is $134,912 per year, with a base salary of $99,503 and additional pay of $35,409. The most likely range for total pay is between $105,000 and $176,000 annually.
However, your actual earnings can also depend on several factors, as below:
- Company: Top paying companies include Google, Meta, and NVIDIA, with average total pay exceeding $195,000.
- Industry: Industries like Energy, Mining & Utilities, Real Estate, and Telecommunications often offer higher salaries for BI Analysts.
- Experience: Seniority and experience level play a significant role in determining salary.
- Location: Salaries may vary depending on the cost of living and demand for BI talent in specific regions i.e. San Francisco Bay Area, CA stays on top of the list with payment going up to $167,700 per year.
Business intelligence analyst career path

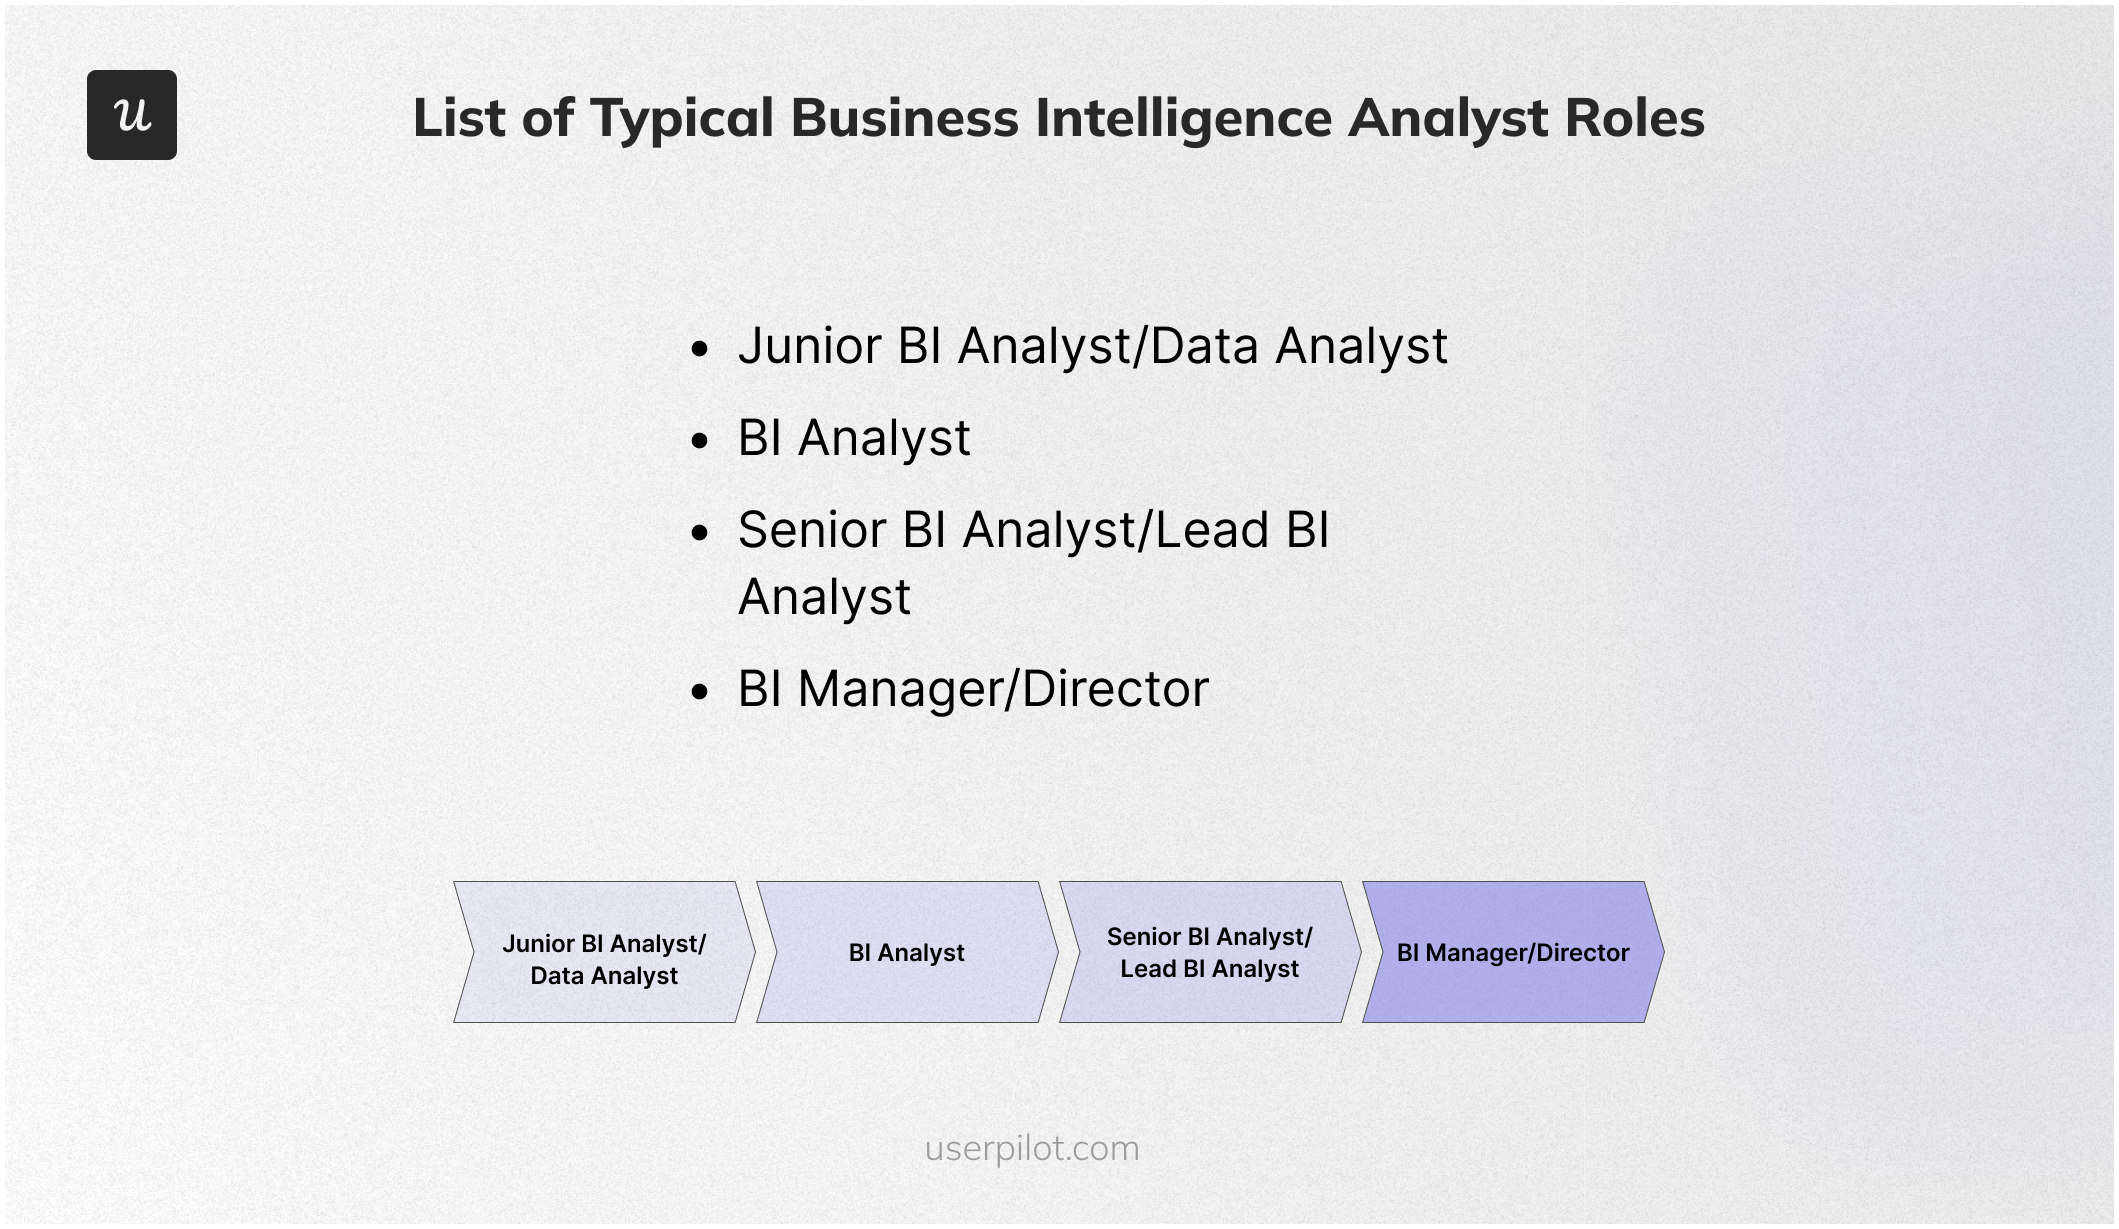
The career path of a business intelligence analyst is not linear, but there are common stages you can expect as you gain experience and expertise. Here’s a breakdown of the typical career progression:
- Junior BI Analyst/Data Analyst (0-3 Years): At this stage, you’ll typically work under the supervision of senior analysts, assisting with data cleaning, report generation, and basic data analysis.
- BI Analyst (3-5 Years): You’ll take on more responsibility for independent data analysis, report creation, and dashboard development. You’ll likely work closely with business stakeholders to understand their needs and translate them into actionable insights.
- Senior BI Analyst/Lead BI Analyst (5-10+ Years): You’ll lead a team of analysts, oversee complex projects, and develop strategic BI initiatives. You’ll be responsible for ensuring data quality, defining KPIs, and driving data-driven decision-making across the organization.
- BI Manager/Director (10+ Years): You’ll be responsible for overseeing the entire BI function, managing a team of analysts and developers, and setting the overall strategic direction for data-driven initiatives.
As you advance to this position, you can also choose to transition into a data analyst or BI consultant role depending on your interest:
- Data Scientist: If you’re passionate about statistics, machine learning, and predictive modeling, you may transition into a data scientist role.
- BI Consultant: As a consultant, you’ll work with clients to develop and implement BI solutions. This path requires strong business acumen and consulting skills.
Best practices to be a great business intelligence analyst
Becoming a great Business Intelligence (BI) Analyst involves more than just mastering technical skills. It also requires communication and a proactive approach to problem-solving. Here are some best practices to excel in this role:
- Understand the business: A great BI analyst isn’t just a data cruncher; they’re a strategic partner. For instance, if you’re working for an e-commerce company, understand metrics like customer acquisition cost, average order value, and churn rate. This knowledge will help you frame your analysis and deliver insights that directly impact the bottom line.
- Master your tools: Technical proficiency is a must. Become an expert in SQL to efficiently query and manipulate data. Learn to create compelling visualizations using tools like Tableau or Power BI, and leverage advanced features like calculated fields and custom visualizations.
- Data quality is key: “Garbage in, garbage out.” Ensure the accuracy and reliability of your data by establishing robust data cleaning and validation processes. Address missing values, outliers, and inconsistencies before proceeding with analysis. Collaborate with data engineers to implement data governance practices that ensure data integrity, security, and compliance. Remember, your insights are only as good as the data they’re based on.
- Focus on actionable insights: Don’t just present data; tell a story that resonates with stakeholders. Highlight the key findings, their implications for the business, and actionable recommendations. For example, instead of saying “Churn rate increased by 5%,” say “We’ve identified a 5% increase in churn, primarily among customers acquired through social media channels. We recommend focusing on improving onboarding for these customers to increase their lifetime value.”
- Foster collaboration and communication: Building strong relationships with stakeholders is crucial. You should regularly communicate with business users to understand their needs, gather feedback on your reports, and ensure your analyses are relevant and useful.
Best resources for business intelligence analysts
Here’s a curated list of resources to empower business intelligence analysts at all stages of their careers:
Best books for business intelligence analysts
Here are some of the best books for business intelligence analysts, categorized by learning level:
For Beginners:
- “Data Analytics Made Accessible” by Dr. Anil Maheshwari: This book provides a comprehensive overview of data analytics concepts and techniques, including real-world examples and case studies. It’s suitable for those with little to no prior experience in the field.
- “SQL for Data Analysis: Advanced Techniques for Transforming Data into Insights” by Cathy Tanimura: This book dives into the essential SQL skills needed for data analysis, covering advanced topics like window functions and common table expressions.
For Intermediate Learners:
- “Python for Data Analysis: Data Wrangling with Pandas, NumPy, and IPython” by Wes McKinney: This book is a comprehensive guide to using Python for data analysis, covering essential libraries like Pandas, NumPy, and Matplotlib.
- “R for Data Science: Import, Tidy, Transform, Visualize, and Model Data” by Garrett Grolemund and Hadley Wickham: This book teaches how to use R for data analysis, covering data wrangling, visualization, and basic modeling.
For Advanced Practitioners:
- “Advanced Data Analytics Using Python” by Sayan Mukhopadhyay: This book delves into advanced data analysis techniques using Python, including machine learning, deep learning, and natural language processing.
- “Designing Data-Intensive Applications” by Martin Kleppmann: This book provides a comprehensive overview of designing and building data-intensive applications, covering topics like data storage, processing, and scalability.
Best webinars for business intelligence analysts
Webinars offer a convenient way to gain insights from industry experts, learn about new tools and technologies, and explore emerging trends. For business intelligence analysts, the following webinars are particularly valuable:
- Userpilot: While Userpilot primarily focuses on product analytics and user behavior, their webinars often touch upon broader aspects of business intelligence, particularly how to leverage product data for decision-making. They are an excellent resource for analysts interested in the intersection of data and user experience.
- BrightTALK: This platform hosts a massive selection of webinars on various business intelligence topics, including data warehousing, reporting, dashboards, and advanced analytics. You can easily filter by your interests and level of expertise.
- Gartner Webinars: Gartner, a leading research and advisory company, frequently hosts webinars on the latest trends and best practices in business intelligence and analytics. Their webinars often feature industry experts and thought leaders.
- TDWI (The Data Warehousing Institute): TDWI offers a wealth of resources for BI professionals, including webinars on data architecture, data integration, analytics, and data governance. Their webinars often delve into technical aspects of BI implementation.
Best blogs for business intelligence analysts
Blogs offer a wealth of information, from how-to guides and tutorials to thought leadership pieces and industry news. For business intelligence analysts, these blogs are a must-read:
- Userpilot Blog: Userpilot’s blog is an excellent resource for BI analysts who want to leverage product data for insights. Their articles dive into topics like product analytics, user behavior analysis, and data-driven decision-making, providing actionable advice for improving user experiences and driving business growth.
- Mode Analytics Blog: Mode Analytics is a popular BI platform, and its blog offers in-depth articles and tutorials on data analysis, visualization, and reporting. They also share case studies and examples from real companies, demonstrating how BI is used to solve business problems.
- Tableau Blog: Tableau is a leading data visualization tool, and its blog features a wide range of content, including tutorials, tips, and inspiration for creating impactful dashboards and reports.
- Google Cloud Blog – Looker: Looker, now part of Google Cloud, offers a powerful BI platform for data exploration and analysis. Their blog provides insights into data modeling, advanced analytics, and embedding BI into applications.
Best podcasts for business intelligence analysts
Whether you’re commuting, exercising, or just relaxing, podcasts provide a convenient way to stay updated on the latest developments in the BI world. Here are some of the top podcasts that cater to business intelligence analysts:
- The Data Chief Podcast: Hosted by Cindi Howson, The Data Chief Podcast features interviews with Chief Data Officers (CDOs) and other data leaders from various industries. It covers topics like data governance, data strategy, and the evolving role of data in business.
- Analytics on Fire: This podcast, hosted by BI Brainz, brings together BI leaders and practitioners to share their insights and experiences. The discussions cover a wide range of topics, from data visualization and analytics best practices to the latest trends in BI tools and technologies.
- Data Engineering Podcast: Hosted by Tobias Macey, this podcast focuses on the technical aspects of data engineering. It features interviews with experts in the field, covering topics like data pipelines, data warehouses, cloud infrastructure, and emerging technologies.
- Data Science at Home: Hosted by Francesco Gadaleta, this podcast offers bite-sized episodes on a variety of data science topics. It covers everything from machine learning and artificial intelligence to statistics and data visualization. The episodes are concise and easy to digest, making them perfect for busy BI analysts who want to stay informed.
Best tools for business intelligence analysts
Here’s a breakdown of the top tools for business intelligence analysts, with insights on what each is best for and how it benefits those in this role:
- Userpilot – Best for understanding user behavior within your product: Userpilot‘s comprehensive analytics tools enable BI analysts to track user journeys, identify patterns in behavior, and uncover insights that can inform product development and marketing strategies.
- Tableau – Best for data visualization and creating interactive dashboards: Tableau’s intuitive drag-and-drop interface empowers BI analysts to transform complex datasets into visually compelling stories.
- Power BI – Best for data analysis, reporting, and dashboard creation within the Microsoft ecosystem: Power BI’s seamless integration with other Microsoft tools like Excel and Azure makes it a powerful choice for BI analysts working within the Microsoft ecosystem.
- Amplitude – Best for product analytics and tracking user behavior across different platforms: Amplitude provides in-depth analytics on user interactions with web and mobile applications.
- Mixpanel – Best for analyzing user behavior and tracking events within digital products: Mixpanel allows BI analysts to track user actions, measure the impact of product changes, and segment users based on their behavior.
- Heap – Best for auto-capturing user interactions and analyzing the entire customer journey: Heap automatically collects data on every user interaction, eliminating the need for manual event tracking.
- ChurnZero – Best for identifying and addressing churn risks proactively: ChurnZero utilizes machine learning algorithms to predict customer churn.
- Google Charts – Best for creating simple and interactive charts for web applications: Google Charts offers a straightforward way to embed charts and graphs directly into web pages or reports.
Conclusion
Now that you have a better understanding of the salary range for a business intelligence analyst position, you can take steps to improve your earning potential.
Consider pursuing relevant certifications, developing your skillset, or negotiating effectively during the job offer stage.
Looking into tools for business intelligence analysts? Userpilot is an all-in-one product platform with engagement features and powerful analytics capabilities. Book a demo to see it in action!


