Mixpanel Pricing: Is It Worth the Cost? (+ Better Alternatives)


Is Mixpanel pricing competitive enough to make it a viable analytics tool for SaaS companies?
That’s what we try to figure out in this article. We look at its pricing structure, what’s included in each plan, and its strengths and weaknesses. We also explore some alternatives that might be of interest to you.
Let’s dive in!
What is Mixpanel?
Mixpanel is a powerful product analytics tool that allows product teams to track and analyze in-app product engagement. It supports both web and mobile apps and it’s used by small and large organizations in different industries.
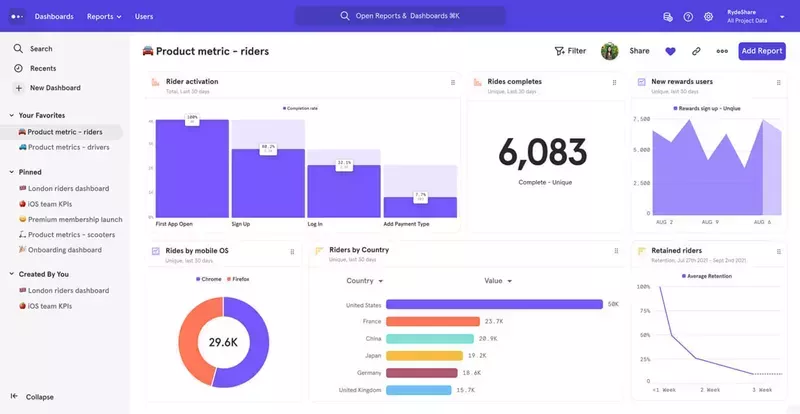
What you can do with Mixpanel?
Mixpanel helps companies measure and improve product engagement with a range of analytics features. The key ones include:
- Flows analytics for tracking user paths and drop-off points
- Impact analysis for assessing the impact of new releases and updates
- Query-time data modeling, including custom events or custom sessions
- Custom analytics dashboards
- Live events, for real-time data access
- User segmentation and cohort analysis
- Funnel analysis
- Retention analysis
- A/B experimentation
Is Mixpanel paid?
Yes and no. Mixpanel uses the freemium model, so customers can take advantage of the fairly generous free plan. Early-stage companies can also benefit from the Mixpanel for Startups program.
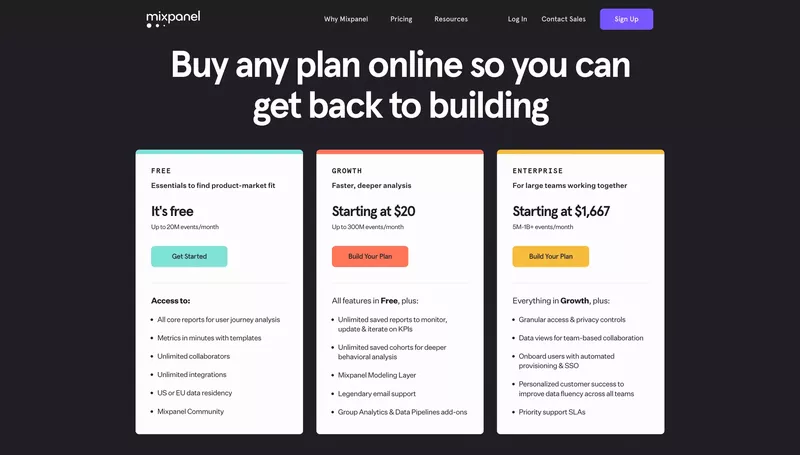
However, these come with caps and are available for limited periods. If you need to track more than 20M events a month or need some of the more advanced features, you will need to upgrade to the Growth plan, which starts at $20/month, or the Enterprise plan, which is available from $1,167 a month.
What does Mixpanel offer in its free plans?
Let’s start our overview of Mixpanel’s pricing strategy with the free plans.
Mixpanel Free
The free plan offers access to essential features:
- Up to 20M events/month
- All core reports for user journey analysis (Insights, User Flows, Funnels, Retention, and Cohorts)
- Query-time data modeling (statistical operators, behavioral frequency analysis, custom session, custom events, limited custom properties, limited lookup tables)
- Live events
- Custom dashboards
- Metrics in minutes with templates
- Unlimited collaborators
- Unlimited data history
- US or EU data residency
- Unlimited integrations, including data warehouse integrations
- Advanced security: GDPR, CCPA, and SOC2 type II compliance
- Mixpanel community and email support
Mixpanel for Startups
Mixpanel Startup Program is designed to give early-stage companies access to premium analytics features to help them find product-market fit and secure future funding.
To apply for the plan, your SaaS business can’t be older than 5 years and shouldn’t have raised more than $8M in funding. Companies that are already on Mixpanel paid plans are not eligible though.
What does the program offer?
If your application is successful, you get $50,000 credit to use on Mixpanel Growth and Enterprise plans, as well as Group Analytics and Data Pipelines.
This applies to plans up to 150M events/month, and the only things that are not included are the dedicated CSM and priority SLA in the Enterprise plan.
The program lasts 12 months after which the company can choose one of the standard plans that suits best their needs and usage.
What are the paid plans that Mixpanel offers?
So what exactly is included in the paid plans that Mixpanel offers?
Growth plan
The Growth plan includes all the features included in the Free plan plus a bit more:
- Custom pricing, starting at $20/month
- Up to 300M events/month
- Unlimited saved reports to monitor, update and iterate on KPIs
- Unlimited saved cohorts for deeper behavioral analysis
- Mixpanel Modeling Layer
- Email support
- Group Analytics and Data Pipelines add-ons
Enterprise plan
The Enterprise plan comes with all the bells and whistles that you can imagine, and probably more:
- Custom pricing, starting at $1,667/month
- 5M-1B+ events/month
- Everything in Growth
- Granular access and privacy controls
- Data views for team-based collaboration
- Onboard users with automated provisioning and SSO
- Personalized customer success to improve data fluency across all teams*
- Priority support SLAs*
* Not available for the Startup program participants
What are the pros and cons of using Mixpanel?
Mixpanel is a versatile analytics platform with lots of strengths:
- ✅ Sophisticated features enabling teams to easily analyze data in detail.
- ✅ Real-time data display.
- ✅ Powerful interactive and easily accessible data visualization.
- ✅ High levels of customization.
- ✅ A generous free plan that is sufficient for small SaaS companies.
- ✅ A Startup program promoting early-stage companies.
It comes with a few downsides though:
- ❌ Steep learning curve.
- ❌ Costly Enterprise plan.
- ❌ Complex setup, requiring engineering team support.
- ❌ No user feedback or engagement functionality, so you need 3rd party tools.
What do users say about Mixpanel’s pricing?
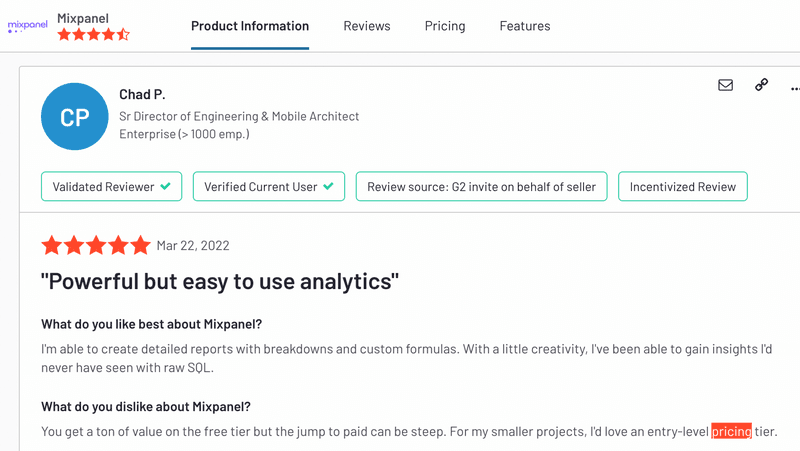
Mixpanel is highly rated by G2 users. It’s currently enjoying an average rating of 4.5.
Users praise it for its advanced reporting features and usability. However, when it comes to Mixpanel cost, reviewers do have some reservations:
You get a ton of value on the free tier but the jump to paid can be steep. For my smaller projects, I’d love an entry-level pricing tier.
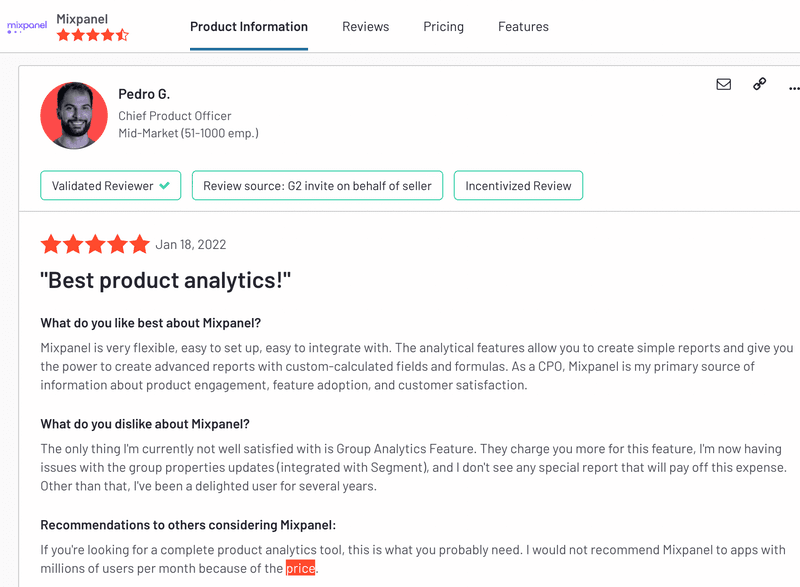
The price seems to be a particular issue for companies with lots of users or requiring custom features:
The only thing I’m currently not well satisfied with is Group Analytics Feature. They charge you more for this feature… and I don’t see any special report that will pay off this expense.
…I would not recommend Mixpanel to apps with millions of users per month because of the price.
Are there better product analytics tools than Mixpanel?
Even though Mixpanel is a brilliant analytics tool, you may want to consider some alternatives. This could be because you want a more affordable solution or one that enables you to also act on the insights.
Here are two alternatives that are worth looking at: Userpilot and Amplitude.
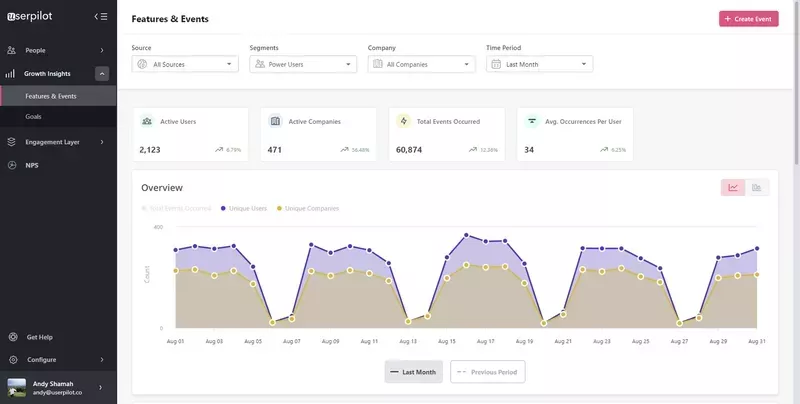
Userpilot – Mixpanel alternative
Userpilot is not just an analytics tool but a product adoption platform. This means it enables you to gather user feedback and design onboarding experiences to drive product adoption.
Userpilot analytics features are pretty robust:
- Real-time product usage data display, so you can trigger contextual in-app guidance in response to events
- Native mobile SDK
- Integrated NPS score analytics, including qualitative response tagging
- Quantitative survey analytics
- Feature tagging (tracks clicks, hovers, and text inputs)
- Goal tracking
- Custom events
- Advanced user segmentation
- Integrations with analytics tools
- A/B testing for in-app experiences
- Checklist and resource center analytics
It works on both web and mobile applications and it’s the former that we highly recommend it for.
Userpilot pricing vs Mixpanel pricing
Userpilot’s transparent pricing ranges from $299/month on the entry-level end to an Enterprise tier for larger companies.
Furthermore, Userpilot’s entry-level plan includes access to all UI patterns and should include everything that most mid-market SaaS businesses need to get started.

Userpilot has three paid plans to choose from:
- Starter: The entry-level Starter plan starts at $299/month (billed annually) and includes features like segmentation, product analytics, reporting, user engagement, NPS feedback, and customization.
- Growth: The Growth plan uses custom pricing and includes features like resource centers, advanced event-based triggers, unlimited feature tagging, AI-powered content localization, EU hosting options, and a dedicated customer success manager.
- Enterprise: The Enterprise plan uses custom pricing and includes all the features from Starter + Growth plus custom roles/permissions, access to premium integrations, priority support, custom contract, SLA, SAML SSO, activity logs, security audit, and compliance (SOC 2/GDPR).
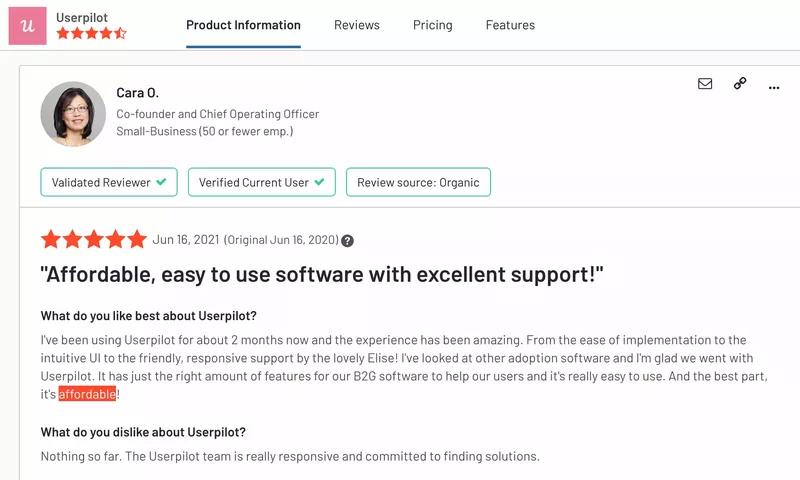
Userpilot reviews
Userpilot is another product with great user reviews. Its current G2 rating is 4.6 and is attributed to its ease of use, customization and personalization options, and high-quality customer support. G2 reviewers also mention its affordability:
I’ve been using Userpilot for about 2 months now and the experience has been amazing. From the ease of implementation to the intuitive UI to the friendly, responsive support by the lovely Elise! I’ve looked at other adoption software and I’m glad we went with Userpilot. It has just the right amount of features for our B2G software to help our users and it’s really easy to use. And the best part, it’s affordable.
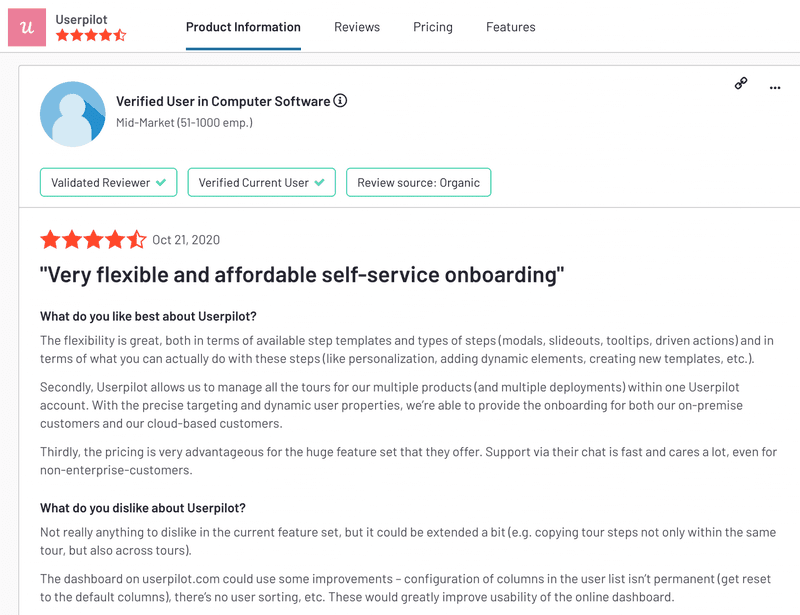
Another user witnessed a positive experience using Userpilot:
The pricing is very advantageous for the huge feature set they offer. Support via their chat is fast and cares a lot, even for non-enterprise-customers.
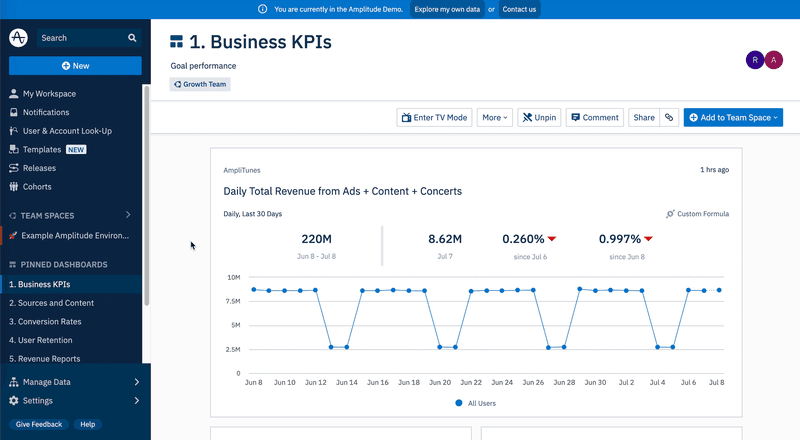
Amplitude – Mixpanel alternative
Amplitude is another powerful analytics solution and one of Mixpanel’s greatest competitors at the moment. Its customers include companies like Atlassian and Canva.
As a specialist analytics tool, it supports a plethora of analytics features that product managers can use to make data-driven decisions to improve the user experience at all touchpoints on the customer journey.
Amplitude Analytics features include:
- Milestone analysis
- Retention analysis
- Custom dashboards
- Predictions
- User segmentation
- Pathfinder (Flows equivalent)
- Funnel analysis
It works on both web and mobile applications and it’s the latter that we highly recommend it for.
Amplitude pricing vs Mixpanel pricing
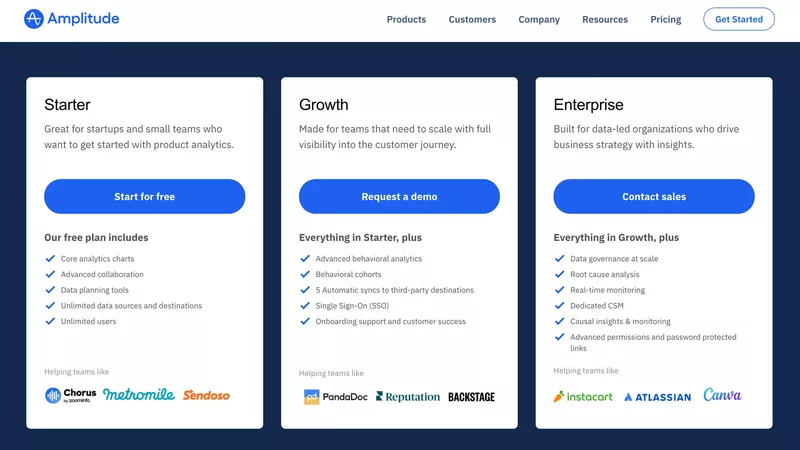
The overall Amplitude pricing structure resembles that of Mixpanel. Even the names are the same. There are three plans, including a free one. Apart from the Starter plan, there are Growth and Enterprise plans. Here’s what they offer:
Starter
- Free
- Up to 100K MTUs/month and unlimited events (as opposed to 20M events in Mixpanel)
- Core analytics (Funnels, Retention, Segmentation, User Sessions, User Timelines, Stickiness, Pathfinder, and Pathfinder Users)
- Custom dashboards
- Advanced collaboration (Team Spaces, Notebooks, and collaboration integrations, like Slack or Miro)
- Data planning tools
- Unlimited data sources and destinations
- Role permissions
- EU data residency
- Security: GDPR, CCPA/CPRA, SOC2 Type II compliance
- Self-service and community support
Growth
- Custom pricing
- up to 1M MTUs/month and unlimited events (as opposed to 300M events in Mixpanel)
- All Starter features
- Advanced behavioral analytics (Impact Analysis, Lifecycle, Revenue LTV, Journeys, A/B Test Analysis, Conversion Drivers, Retention Predictions/Compass, Acquisition Channels, Personas, and Forecasting)
- Behavioral cohorts
- Dashboard templates
- Single Sign-On (SSO) (need Mixpanel enterprise for that)
- Email support and customer success
Enterprise
- Custom pricing and usage limits
- Data governance at scale (Transformations, Derived Properties, Taxonomy API)
- Root cause analysis
- Real-time monitoring (available for free in Mixpanel)
- Dedicated Customer Support Manager
- Causal insights & monitoring
- Advanced permissions and password-protected links
Amplitude reviews
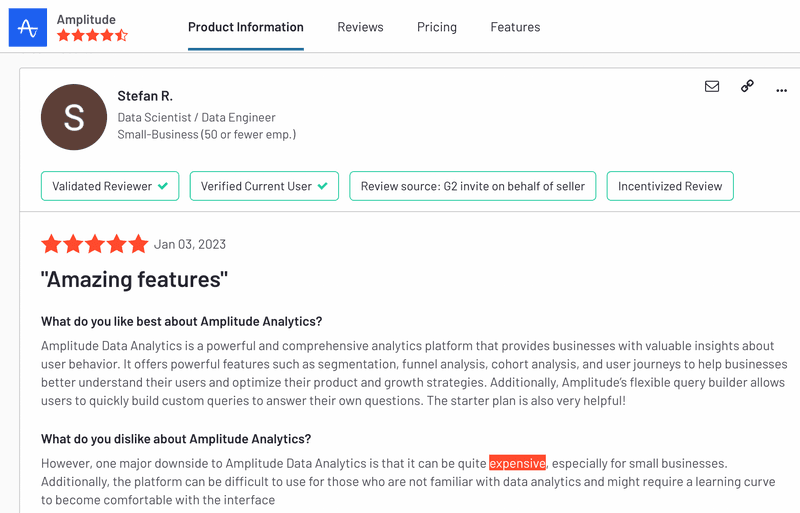
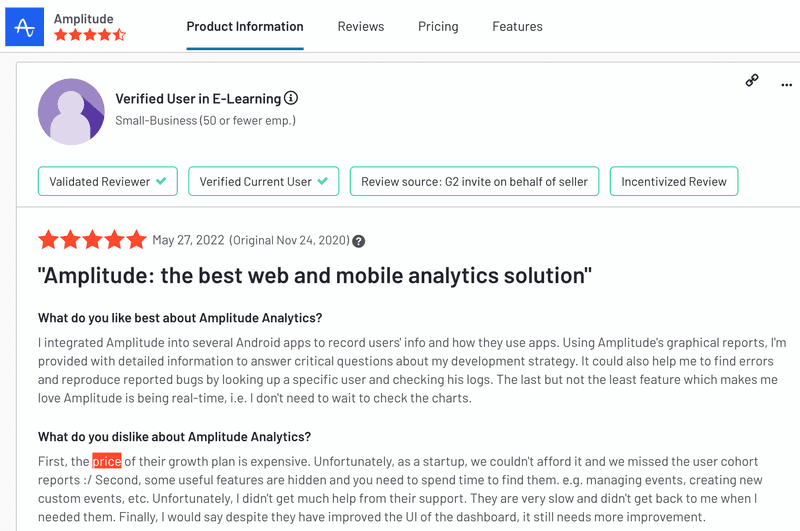
Amplitude has currently an average G2 rating of 4.5, which is exactly the same, as Mixpanel.
Reviewers rate Amplitude mostly for its vast array of advanced analytics tools and automation. They mention the price as one of its downsides though:
…one major downside to Amplitude Data Analytics is that it can be quite expensive, especially for small businesses.
The price of their growth plan is expensive. Unfortunately, as a startup, we couldn’t afford it and we missed the user cohort reports.
Conclusion
Mixpanel is the real deal when it comes to product analytics. The Mixpanel pricing strategy allows small companies to benefit from its key features for free, and new startups have access to the Startup Program which gives them access to the higher plans for free.
Whether Amplitude is a better product or not may depend on your use case. Its pricing strategy caps monthly tracked users rather than events, so this may be a factor to consider.
Userpilot’s analytics features are good enough to satisfy the needs of most small and medium-sized companies. Even its Enterprise plan may work out to be less expensive than the Growth plans of the other two tools.
If you want to see how Userpilot analytics work first-hand, book the demo!
About the author