
Try Userpilot Now
See Why 1,000+ Teams Choose Userpilot

What are customer experience KPIs?
Customer experience KPIs (key performance indicators) are metrics that track various aspects of the customer’s interaction with your business. They demonstrate how well your product satisfies customer needs and can help you identify areas for improvement.
A good CX is especially critical for SaaS companies since the subscription model relies on happy customers renewing their accounts.
PwC’s Future of CX report shows that 32% of customers would leave a brand they love after just one bad experience. While your customer churn rate may differ, this statistic shows the importance of prioritizing customer experience.
Why should you track customer experience metrics?
Keeping an eye on your customer experience metrics comes with several benefits. Perhaps the most obvious is that it helps you understand and optimize your net revenue.
- The average payback period for SaaS is around 8-22 months. This means that if yours is 8 months, you’ll only break even on the money you spent acquiring a user if they enjoy your product enough to consistently renew their subscription for 8 months.
- By tracking your customer experience metrics, you can analyze customer satisfaction levels, identify the factors responsible, and make more data-driven decisions to improve their experience. This approach will help you exceed customer expectations, retain existing customers, and make more profit.
But with so many CX metrics to track, how do you determine the most important to your business?
The key is to focus on those that provide actionable insights. This guide will help you identify the most important KPIs in the below categories (feel free to read through or click a link to jump to a desired category):
11 CX metrics to track for SaaS companies
Ready to begin? For each metric, we’ll cover why it’s important and how to calculate it.
Customer satisfaction and customer loyalty metrics
Satisfied and loyal customers are your most valuable assets.
They drive recurring revenue, act as brand advocates through word-of-mouth marketing, and provide a significant competitive advantage.
Here are the core satisfaction and loyalty metrics to track:
1. Customer satisfaction score (CSAT)
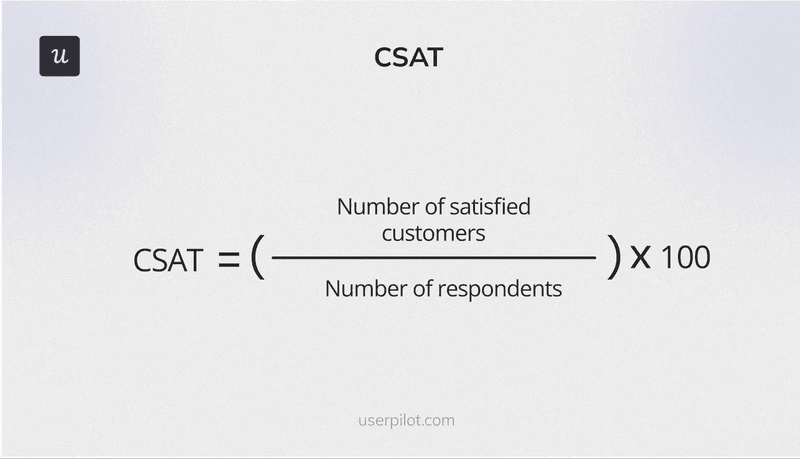
CSAT scores provide a direct measure of how satisfied customers are with specific interactions, features, or overall experiences with your product. They help identify pain points and equip you to proactively address issues that arise along the customer journey.
This metric is typically measured through 5- or 7-point surveys triggered after key interactions (e.g., product purchase, support ticket resolution).
Formula: Divide the number of satisfied customers by the total respondents and multiply by 100.
2. Net Promoter Score (NPS)
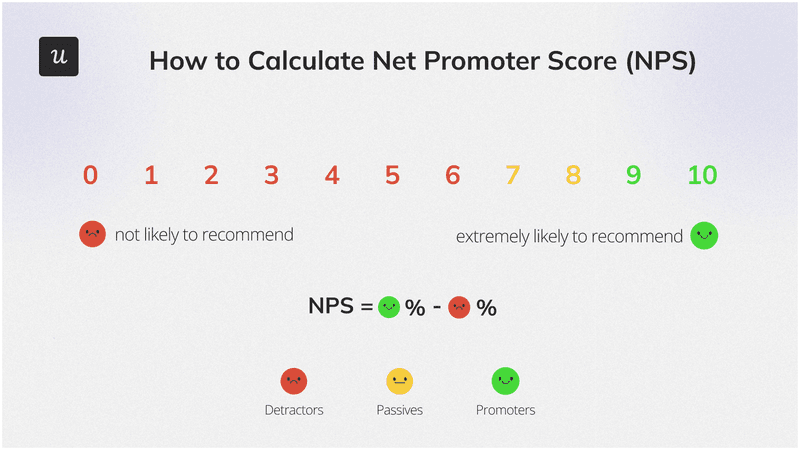
The Net Promoter Score measures loyalty and the likelihood of happy customers recommending your company. It’s a key indicator of overall customer sentiment and potential for growth through word-of-mouth referrals.
Formula: To calculate your NPS, ask customers, “On a scale of 0-10, how likely are you to recommend [your product] to a friend or colleague?”
Categorize respondents based on their answers:
- 0-6 are Detractors (unhappy customers).
- 7-8 are Passives (neutral).
- 9-10 are Promoters (loyal enthusiasts).
Next, subtract the percentage of Detractors from the percentage of Promoters.
Customer support and customer success metrics
Tracking the right customer support and success metrics can help you uncover hidden problems and deliver exceptional service that keeps customers returning for more.
Here are the key customer experience KPIs under this category:
3. Customer effort score (CES)
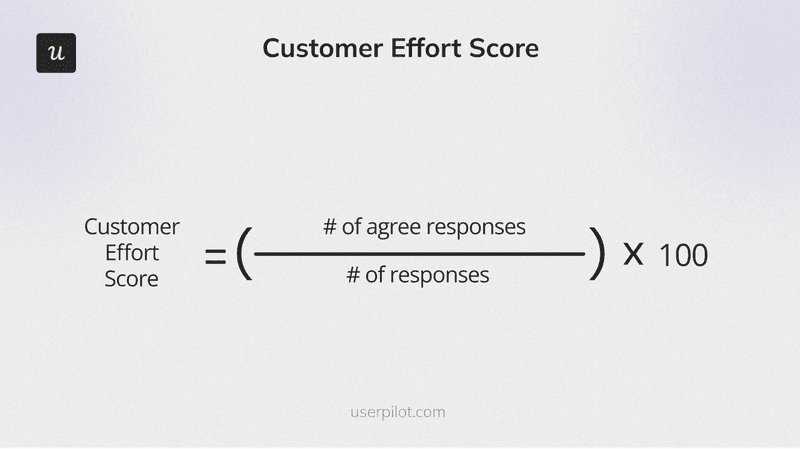
CES measures the ease of completing in-app tasks, interacting with your customer service team, and resolving issues. This metric helps you spot friction in the customer journey and streamline processes to reduce customer problems.
Formula: To calculate the customer effort score, trigger a 5- or 7-point survey after specific customer interactions. Ask something like, “How easy was it to resolve your issue today?”
Divide the number of positive responses by the total responses and multiply by 100.
4. Average resolution time
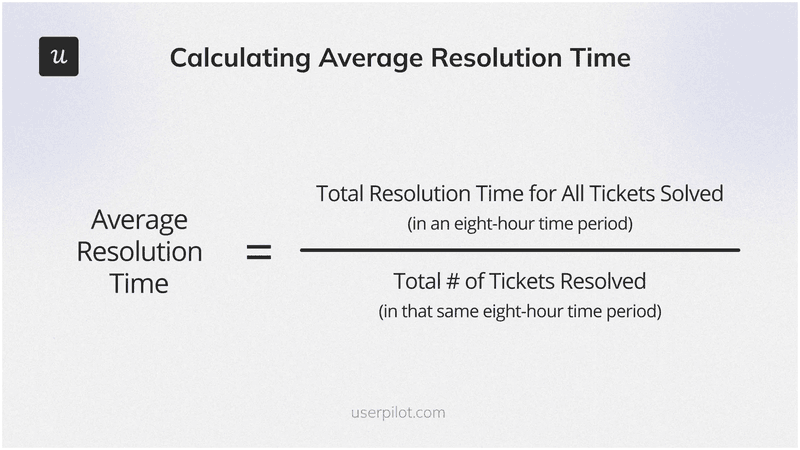
This metric tracks the average time it takes to resolve customer issues. It’s a key indicator of support team efficiency and customer satisfaction.
Longer resolution times often correlate with dissatisfied customers, as people generally dislike waiting. For example, a Zendesk study found that nearly 60% of customers consider long wait times the most frustrating part of poor customer service.
Formula: Divide the total time spent resolving all tickets within a specific period (e.g., an 8-hour workday) by the number of tickets resolved within that period.
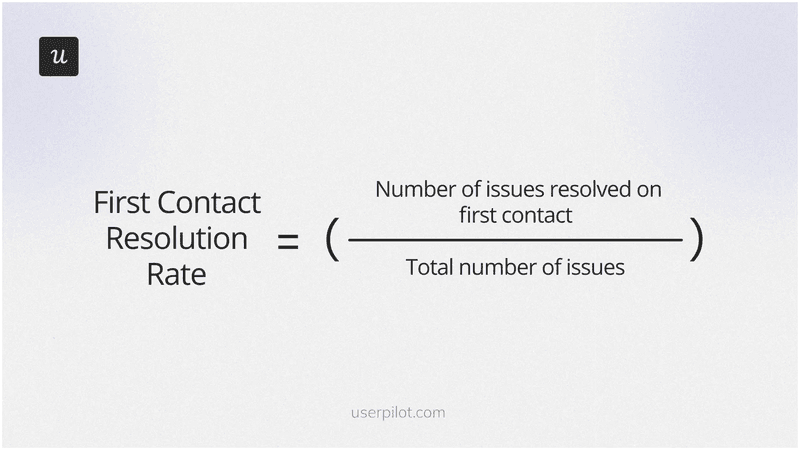
5. First contact resolution rate (FCR)
FCR tracks the percentage of support inquiries your customer service team resolves during the first interaction. A high FCR means customers get their problems solved quickly, reducing frustration and improving their overall experience.
Formula: Divide the number of issues resolved on first contact by the total number of issues.
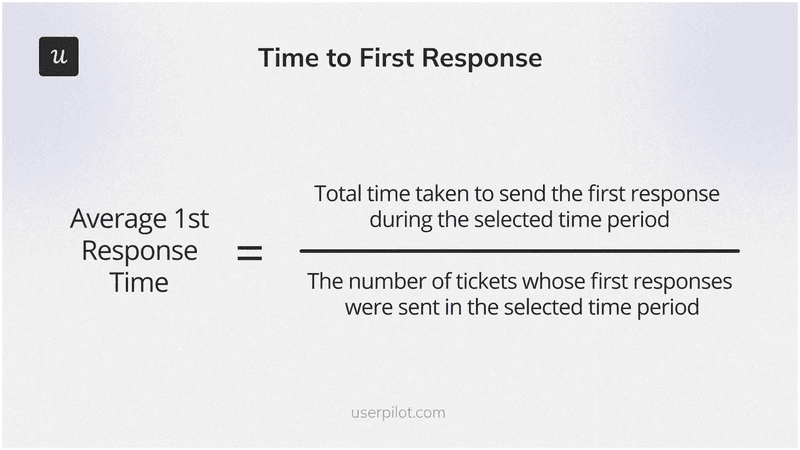
6. First response time (FRT)
FRT measures how long it takes your support team to respond to an initial inquiry. Faster response times show customers that you value their time and are attentive to their needs.
HubSpot’s research found that customers expect a response to their queries within the first 10 minutes of reaching out. Consistent delays beyond this timeframe can lead to dissatisfaction and potentially damage customer relationships.
Formula: Divide the total time it takes to send the first response to all inquiries within a specific period (e.g., a day or a week) by the number of inquiries received within that period.
Customer retention metrics
Acquiring new customers is essential for growth, but retaining existing customers is arguably even more crucial for long-term success.
You have a 60%-70% chance of making a sale to a current customer, compared to just 5%-20% with a new lead.
Loyal customers contribute to higher average revenue, often spending 67% more than one-time buyers. They also frequently become advocates for your brand, spreading positive word-of-mouth and attracting new customers.
Below are some customer experience KPIs to help you monitor retention:
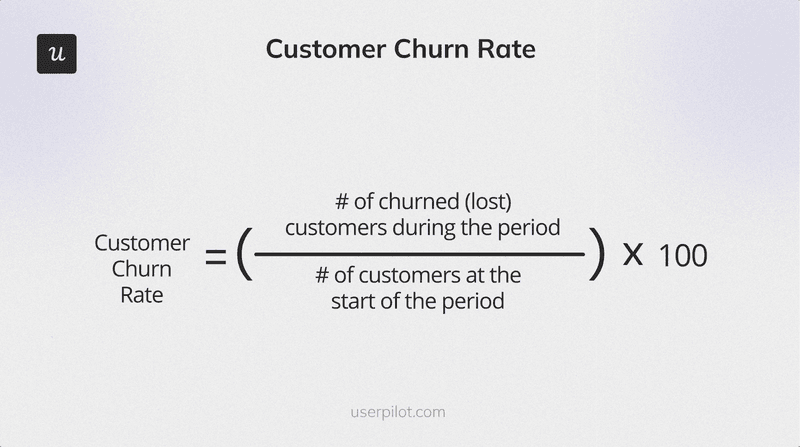
7. Customer churn rate
This metric tracks the percentage of customers who cancel their subscriptions within a specific period.
A high churn rate erodes recurring revenue and often signals underlying issues like poor customer experience, lack of product-market fit, ineffective pricing strategies, or inadequate customer support.
Formula: Divide the number of churned customers during a specific period (e.g., a month or a year) by the number of customers you had at the beginning. Multiply the result by 100 to express it as a percentage.
8. Customer health score
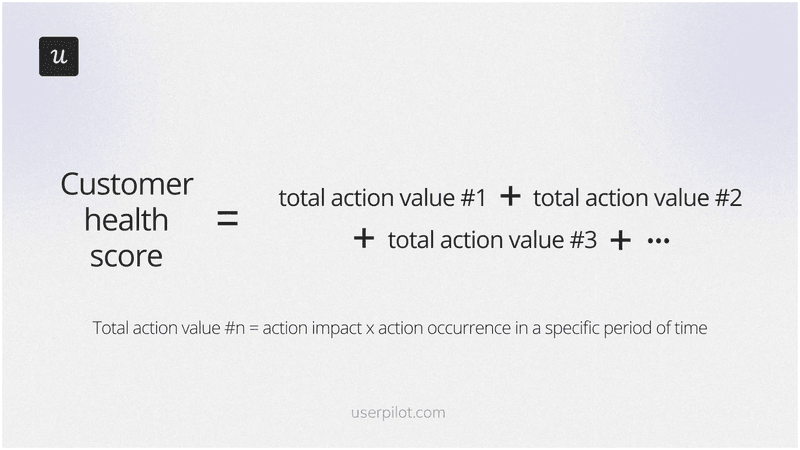
The customer health score combines data across multiple touchpoints to give a holistic view of the customer’s relationship with your company. It’s a valuable tool for identifying at-risk customers and proactively intervening to improve their experience and reduce churn.
Unlike other metrics with fixed formulas, customer health scores are customized based on your specific business and customer base. Factors that might contribute to a customer health score include:
- Product usage frequency (e.g., logins per week, features used per session).
- Feature adoption (e.g., percentage of key features used, time spent using specific features).
- Support ticket history (e.g., number of tickets submitted, time to resolution, ticket severity).
- Customer engagement (e.g., email opens, webinar attendance, social media interactions).
- Account activity (e.g., upgrades/downgrades, payment history, contract renewals).
- Feedback and survey responses (e.g., satisfaction ratings, feature requests, customer reviews).
Assign specific values to these activities based on their importance to your business and how often the customer performed them, then compute everything to determine the customer health score. You can learn more about this in our customer health score guide.
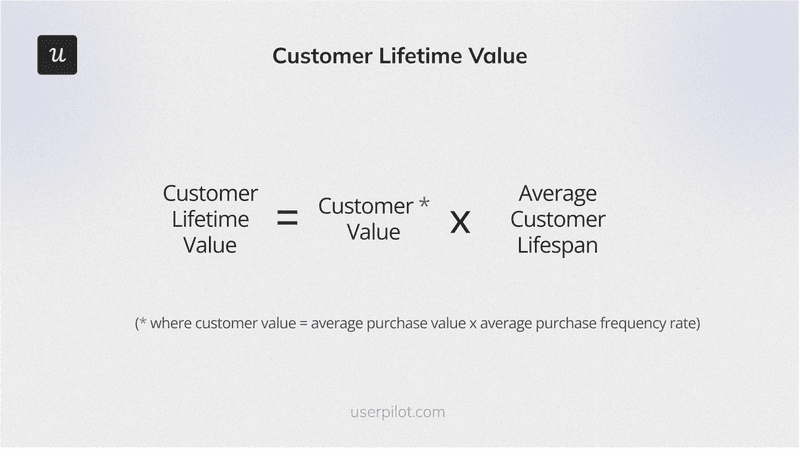
9. Customer lifetime value (CLV or LTV)
Customer lifetime value predicts the total revenue you can expect to generate from a single customer throughout their relationship with your company.
This metric helps you understand the long-term value of acquiring and retaining customers. It can also inform your marketing and customer success strategies. For example, if you know that your average customer lifetime value is $5,000, you might be willing to spend up to $1,000 to acquire a new customer, knowing that you’ll likely recoup that cost and generate profit over time.
Formula: Simply multiply the customer value by the average customer lifespan.
Customer engagement metrics
Engagement metrics are key to truly understanding how users interact with your product. These metrics uncover valuable data about customer behaviors and help you optimize the product experience for better customer satisfaction.
Here are two of the most important customer experience KPIs in this category:
10. Stickiness metric
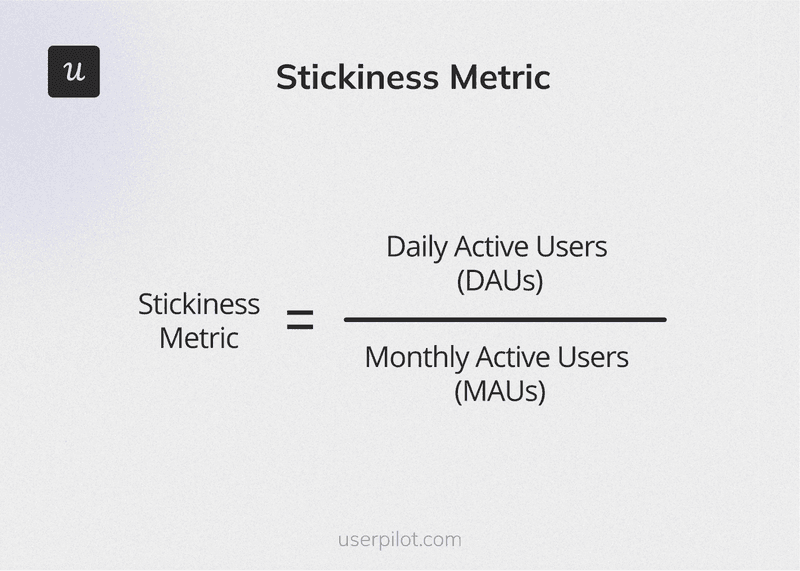
Stickiness measures the number of users actively engaging with your product within a specific time frame. Increased stickiness indicates higher customer satisfaction and loyalty, which often translates to increased lifetime value and reduced churn.
Formula: There are different ways to calculate stickiness, but a common method is the daily active users (DAU) to monthly active users (MAU) ratio.
11. Feature adoption rate
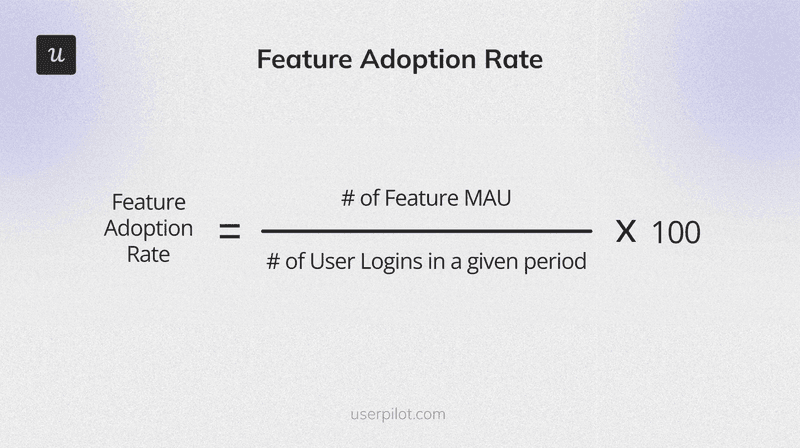
Feature adoption measures how many users embrace and use a specific feature within your product.
It provides insights into which features resonate most with users and which might be underutilized or confusing. This information is valuable for product development, user onboarding, and overall product improvement.
Formula: Divide the monthly active users for that feature by the total user logins within the same period. Multiply by 100 to get the percentage.
How Userpilot can help you monitor + enhance customer experience
Userpilot is an intuitive growth tool that empowers product teams to track in-app behavior and create engaging product experiences.
The best part? It’s completely code-free! Here’s how to maximize Userpilot for CX enhancements:
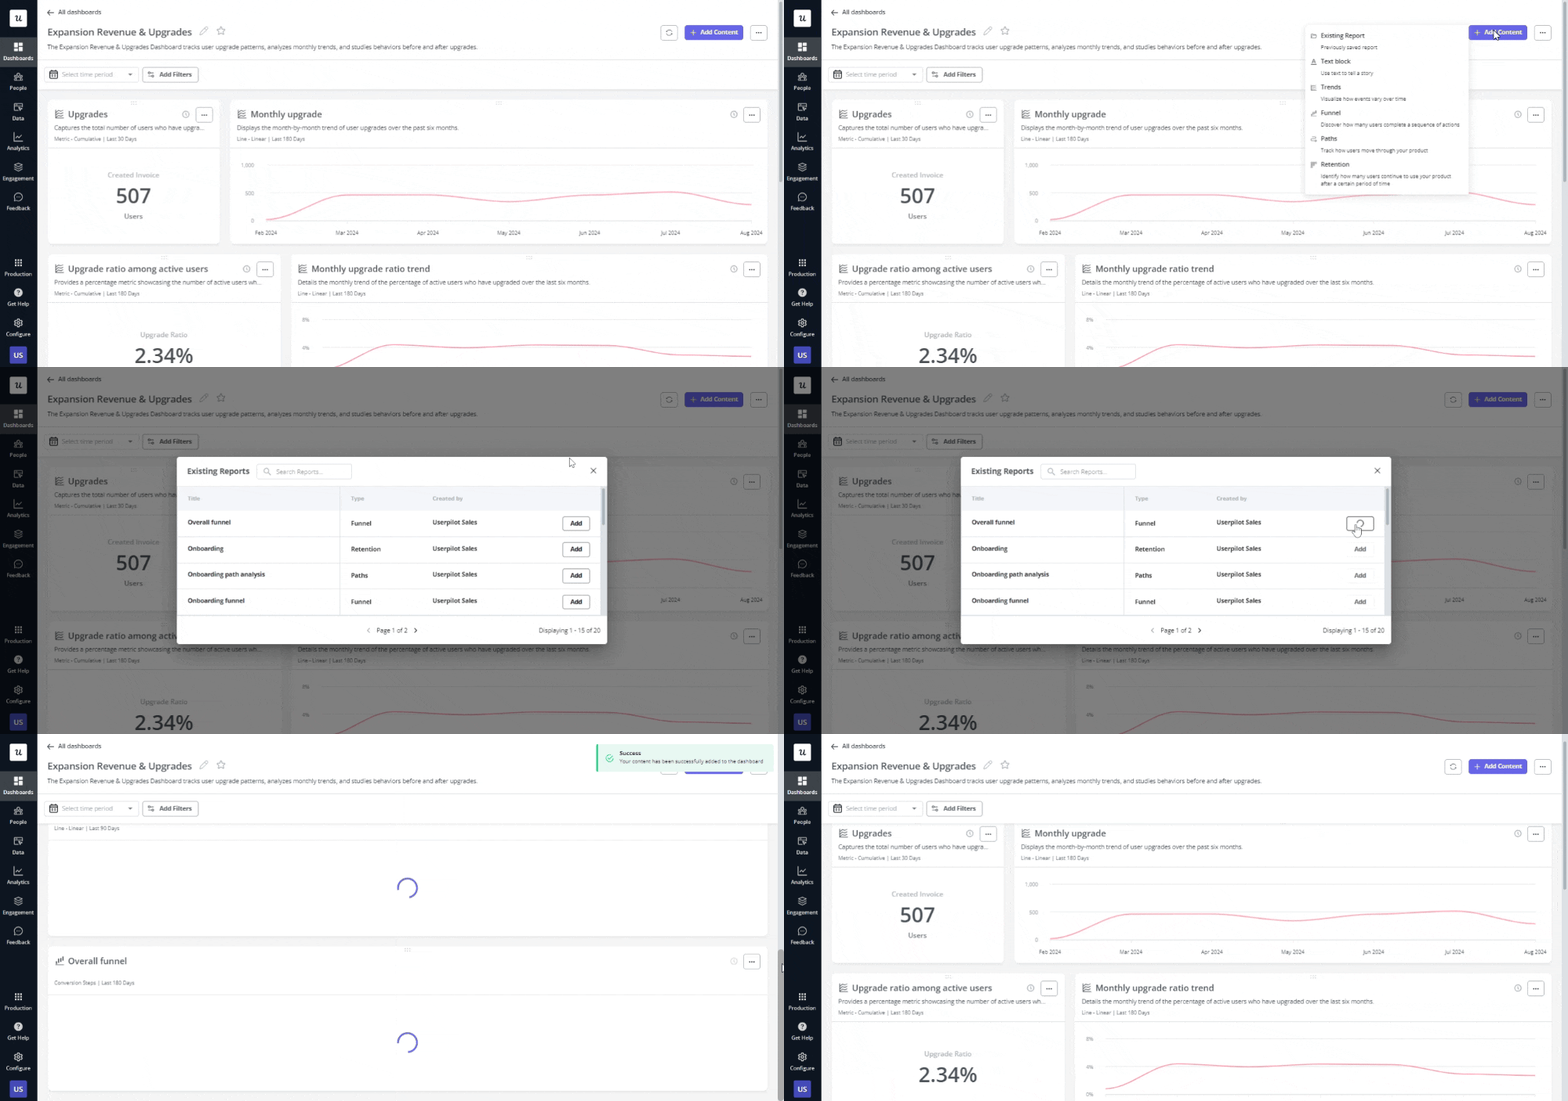
- Monitor analytics through a custom dashboard: Userpilot’s custom analytics dashboard lets you track your favorite customer experience KPIs in one place and observe patterns in real time. This allows you to proactively address issues and continuously optimize your strategies.
- Optimize your product roadmap: Analyze active user data to spot behavior trends, identify popular features, and note friction points. The insights obtained can inform your product roadmap and help you prioritize enhancements that deliver exceptional value to your customers.

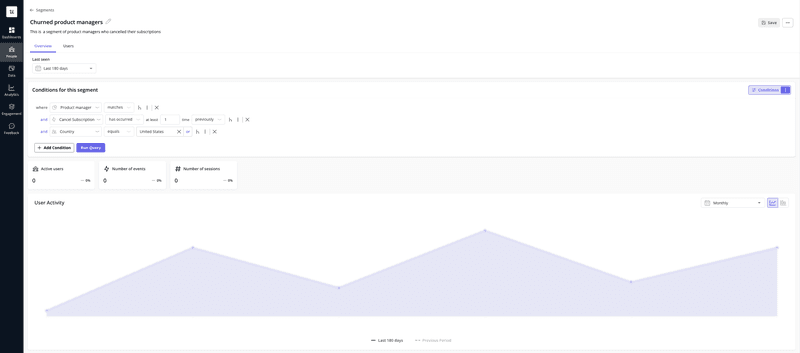
- Reduce churn: Userpilot’s advanced segmentation allows you to create targeted groups based on product usage, demographics, and other factors. With this granular segmentation, you can easily flag at-risk customer groups, dig deeper to find the reasons for their dissatisfaction, and trigger in-app solutions to drive retention.
- Collect customer feedback: Sometimes, analytics data is insufficient to understand why customers behave as they do. With Userpilot, you can trigger contextual in-app surveys to gather qualitative and quantitative feedback at the right points in the customer journey. You can build your surveys from scratch if you want, but our survey library has tons of fully customizable survey templates to save time.

Conclusion
Consistently track and analyze the metrics we’ve covered to gain invaluable insights into your customers’ needs. These insights will empower you to make more data-driven decisions, optimize your strategies, and create an experience that drives business growth.
Ready to take action? Start tracking customer experience KPIs for your tool today! Book a demo to see how Userpilot can simplify the process and help you achieve your goals.


