
Tracking user engagement is crucial for any app, especially subscription-based ones. Metrics like Daily, Weekly, and Monthly Active Users (DAU, WAU, MAU) reveal how engaged users are and give a clear picture of the app’s overall performance.
Try Userpilot Now
See Why 1,000+ Teams Choose Userpilot

What are active users?
Active users are the individuals who meaningfully interact with a platform over a given period. Since software products are designed for different purposes, every company has a slightly different definition of “active.”
For an email automation tool, an active user might be someone who performs a series of repeated events like logging in, campaign creation, setting up schedules, checking analytics, etc., while social media apps may even consider passively scrolling an activity.
Analyzing active users with DAU, WAU, MAU metrics
Once you’ve decided on the events that make a user active, it’s time to track those events and see how many users trigger the events in the given period (e.g. day, week, month).
This section shows you what DAU, WAU, and MAU metrics mean and how to calculate them.
Monthly active users (MAU)
MAUs refer to the number of unique active users that engage with your app in a month. Note the emphasis on “unique” because calculating repeat visits will affect your results. No matter how many times a day a user logs into the app, there will still be one unique visitor.
Finding out the number of your monthly active users is pretty simple. Assuming you’ve implemented the steps in the previous sections and set up an analytics system, all you have to do is just check your tool.
Weekly active users (WAU)
Your weekly active users are the number of unique users that engage with your app in a week.
Calculate WAU the same way you calculate MAU. The difference here is you check your analytics for weekly visitors.
Daily active users (DAU)
DAU is the number of unique users that engage with your app daily.
To calculate, divide MAU by the number of days in the month.
For example, if your MAU for September is 2,000, your DAU is 1,200/30 = 40.
Why should you measure user engagement with active user metrics?
Perhaps you’re wondering if there’s any point in tracking the active user metrics and if it makes any real difference.
The short answer: regular tracking helps you gauge business health at every point in time. With that information, you can decide on your next action steps.
Specifically, here are three vital reasons to track active user metrics:
Understand user retention
Look at both DAU and MAU simultaneously to understand retention.
You’d expect the two metrics to rise or decline simultaneously, but it doesn’t always happen.
Sometimes, you might have a high number of daily active users, while your monthly user count will be way less.
When that happens, realize you have a stickiness problem—people are visiting the app but not staying.
That’s a sign of low retention, and you need to address it immediately.
How? Check your analytics to identify drop-off points and dig further to find the cause. For example, you might find that your product has bugs, making users stuck, or you have insufficient support, etc.
Understand growth over time
If you have a growing number of active users (daily, weekly, monthly), that’s a sign your product is doing well. It means existing and new users find it valuable and are sticking around. (The opposite is also true).
Keep a record of historical data to enable you to notice when visits are going down or up. That way, you can easily probe further and address issues before users churn.
Spot friction in your trial to paid conversion rates
You might notice both DAU and MAU are up, but the number of paid users is comparatively low or stagnant.
It shows users like your tool but aren’t upgrading their accounts for some reason.
You need to look into your trial strategy. It could be one or a combination of the following factors:
- Trial users don’t have enough time to explore the product.
- You’re not prompting upgrades at key moments.
However, don’t rush into assumptions. Let the data tell you what’s going on. You could also survey users to know why some converted and others didn’t.
DAU, WAU, MAU industry benchmarks
Popular venture capital firm, Sequoia tweeted the standard DAU/MAU ratio is 10-20%, with only a handful of companies having over 50%.
Those are nice figures to aim for, however, note that benchmarks are industry averages, and it doesn’t mean your numbers must match 100%. It could be more or less.
What’s important is that you establish benchmarks by looking at your own numbers. Compare yourself today with what you had yesterday instead of an average industry figure.
Every company is different. Regularly track your numbers and decide what to improve.
Additional user engagement metrics you should track
While the DAU, WAU, and MAU metrics provide valuable insights into user activity, they do not tell the whole story of engagement on their own.
It’s essential to consider other metrics to gain a comprehensive understanding of user behavior:
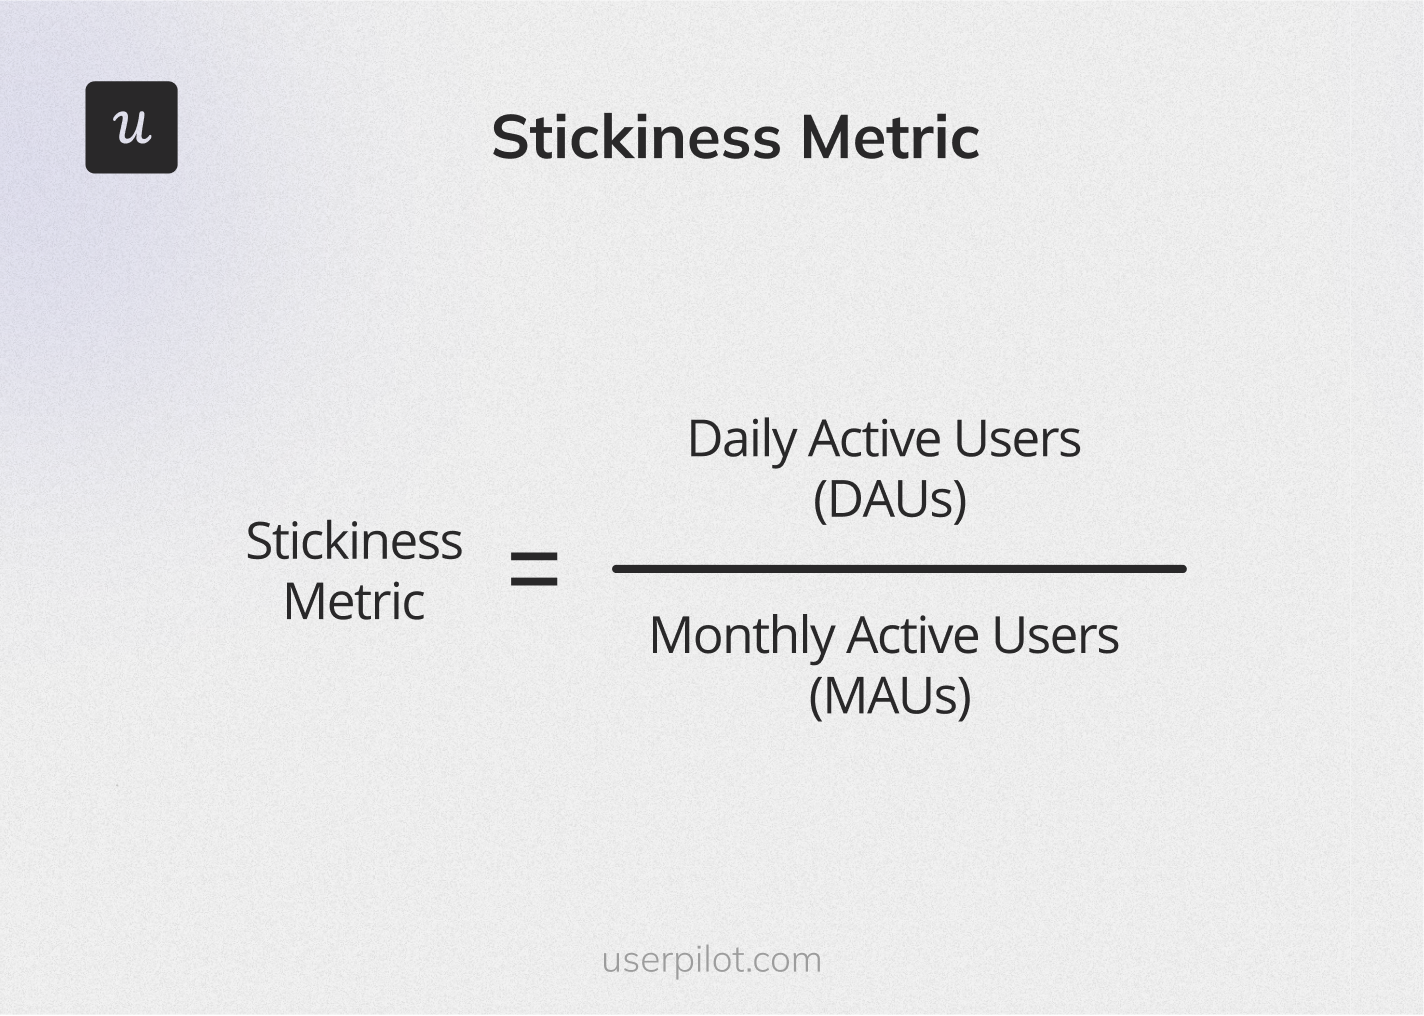
Stickiness metric
Product tickiness indicates how often users return to your app within a month. Higher stickiness signifies better user engagement.
Why should you bother tracking this metric?
Because it helps you understand the differences in usage patterns among different user segments, also, you’ll easily spot friction and improve the user experience.
Calculate stickiness by finding your DAU/MAU ratio.
So, your stickiness is 0.47 or 47%, if you have 1,500 daily active users and 3,200 monthly active users (1,500/3,200 = 0.47).
User engagement score
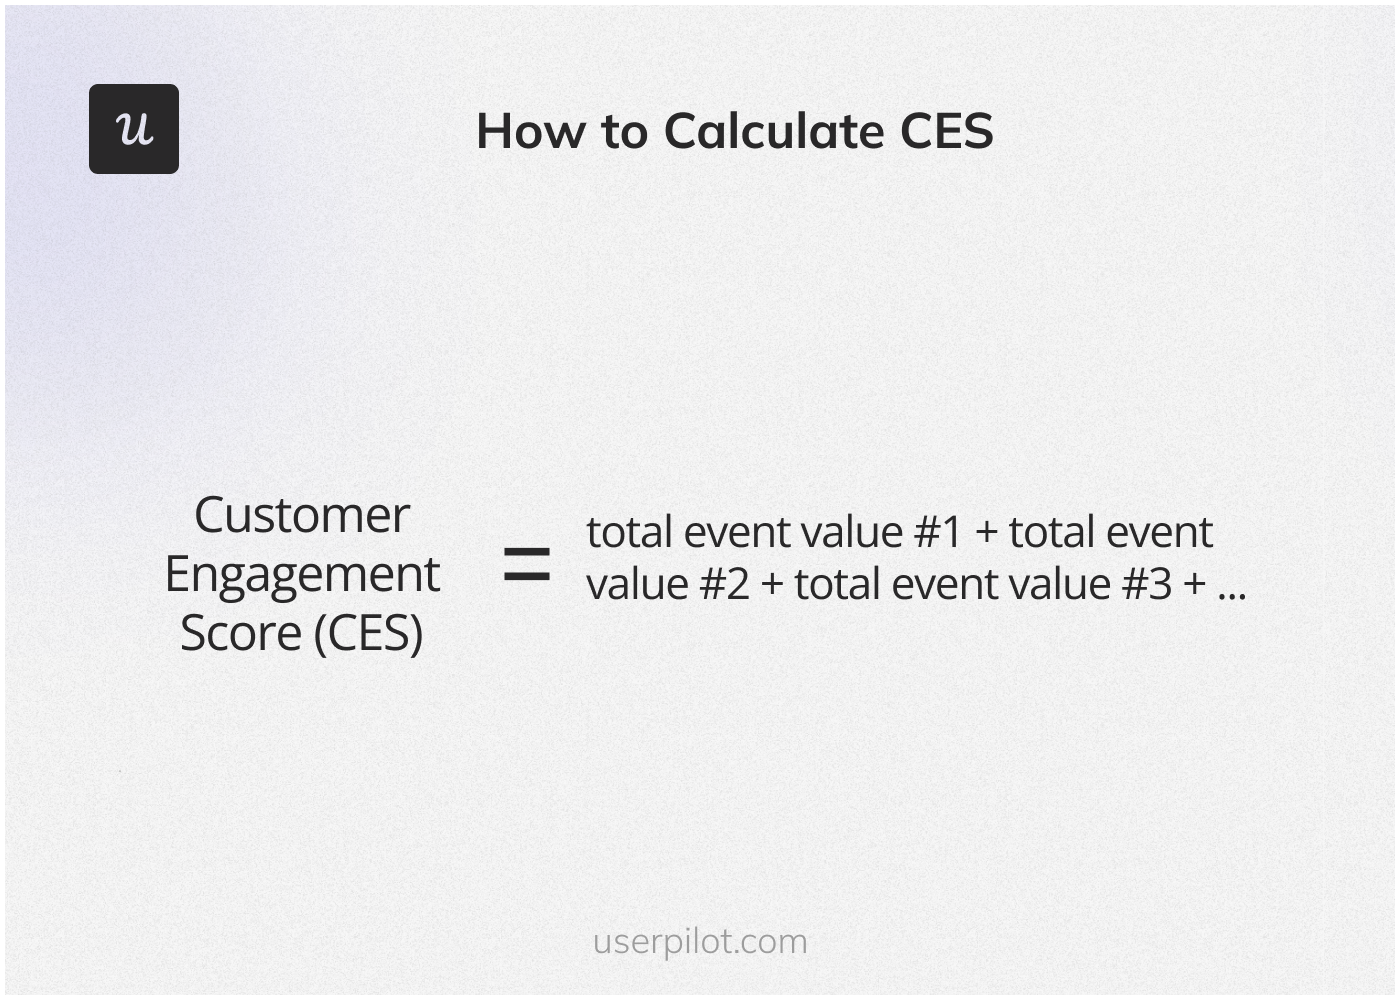
The user engagement score lets you measure the depth of engagement among your users. Track it to analyze highly-engaged users and identify the reasons behind their deep engagement levels. You can use the insights you generate from this exercise to deploy strategies that boost engagement among less active users.
The process of calculating the engagement score requires some learning, but stick around, and you’ll get it.
Firstly, you need to identify the important engagement events on your app. This could be product usage frequency, account renewals, or specific feature engagement. Then assign each event an engagement score between 1 and 10 to show the level of importance.
Get the number of each event from your analytics software and calculate the total event value by multiplying the first two columns.
Now you’re ready to compute the engagement score for each user. Simply add up the total event values, and you have your engagement score.
Feature adoption rate
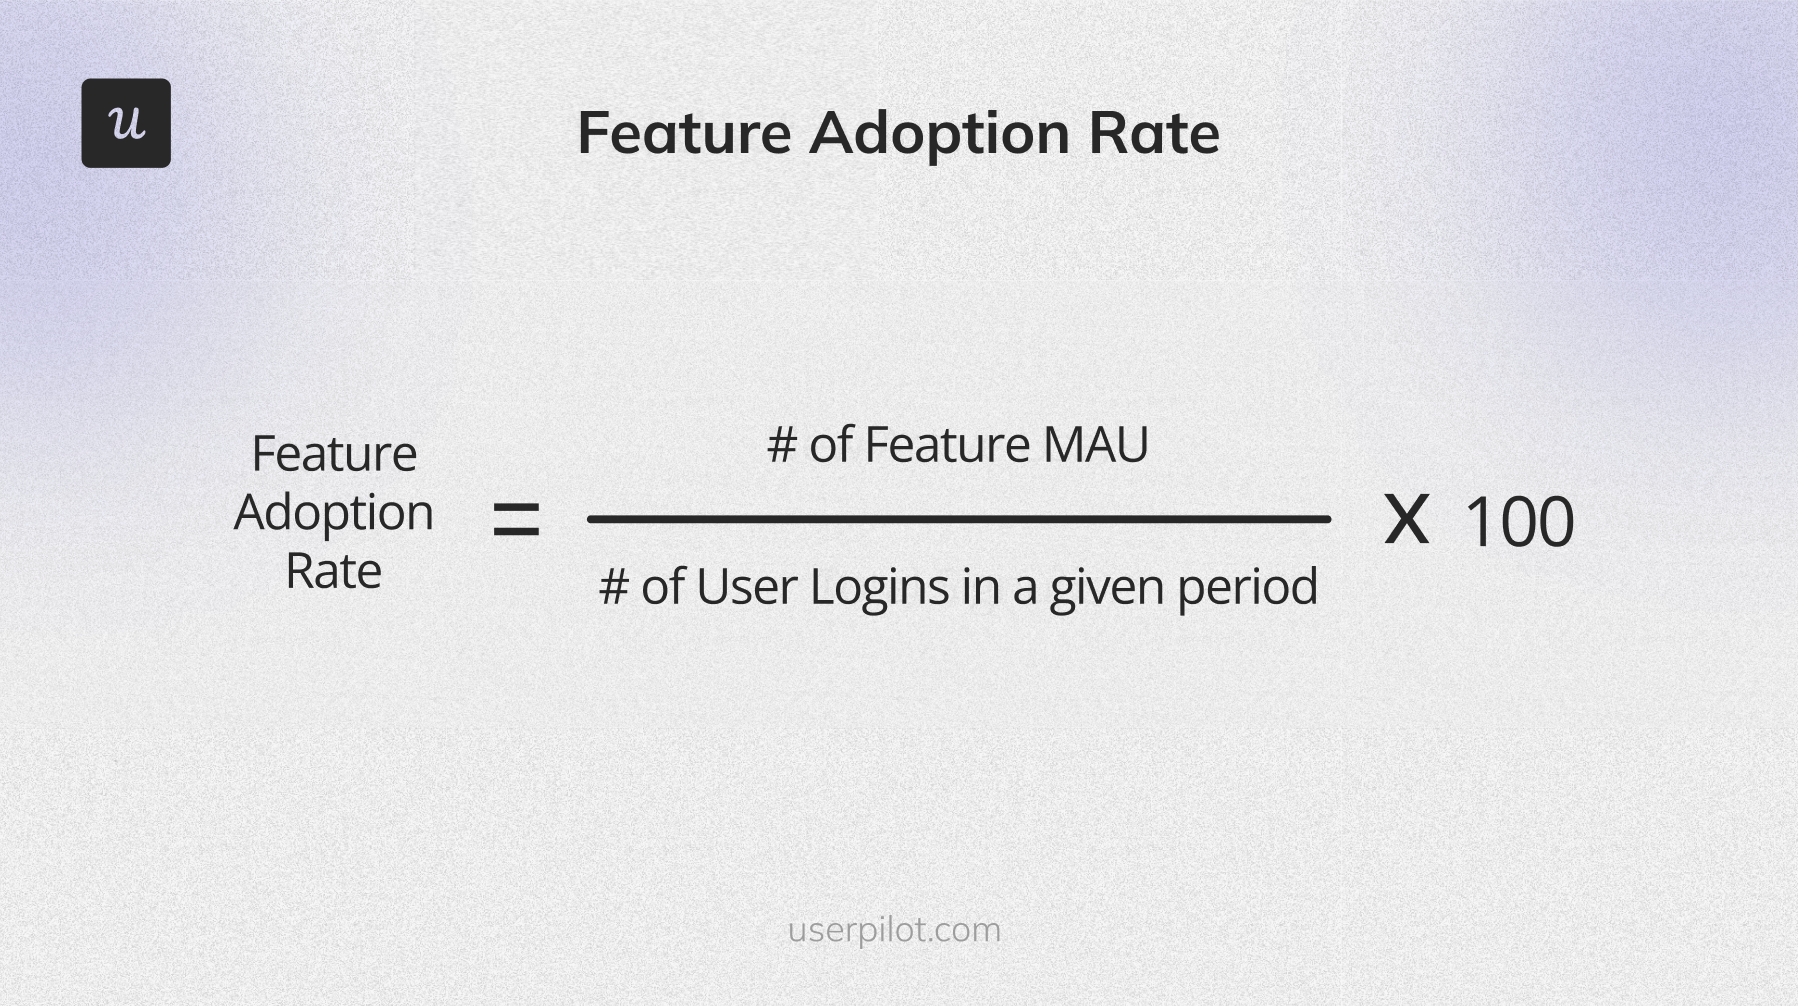
The feature adoption metric shows the total number of users repeatedly using a specific feature. This metric helps you understand which feature provides the most value to users. It’s useful for improving customer retention and deciding which feature to sunset.
To calculate, divide the number of the feature monthly active users (MAUs) by the number of user logins in a period of time, and multiply it by 100.
For instance, if there were 100 feature MAUs out of 1846 users, the feature adoption rate would be 5.42% ((100/1846)*100=5.42%).
Mistakes to avoid when measuring product engagement
Here are common mistakes SaaS companies make when tracking user engagement:
- Following benchmarks only. As mentioned earlier, each product is different, so it’s best to set your benchmarks and aim to beat them. But of course, it doesn’t mean you can’t take a cue from industry averages. Without knowing the average stickiness in your industry, you might be celebrating your mediocre figure and losing out on revenue.
- Only tracking active user metrics. As you’ve seen, there’s a limit to the insights you can generate from the active user metrics, so don’t make them your North Star. Always pair them with other engagement metrics.
- Not properly defining what an active user is. Companies make this mistake a lot. They check their analytics and wrongly assume anyone that logs in over X period is an active user, without even considering if the user interacted with key features.
How to track user behavior and engagement with Userpilot
Userpilot is a no-code tool with the advanced features you need to track and boost engagement. Our platform helps companies like yours to:
- Auto-capture user actions inside the app: With Userpilot, you don’t need to manually tag important user interactions – it will record all Clicks, Text input changes, and Form submissions by default. You can then label these events and retroactively analyze engagement levels across different periods.
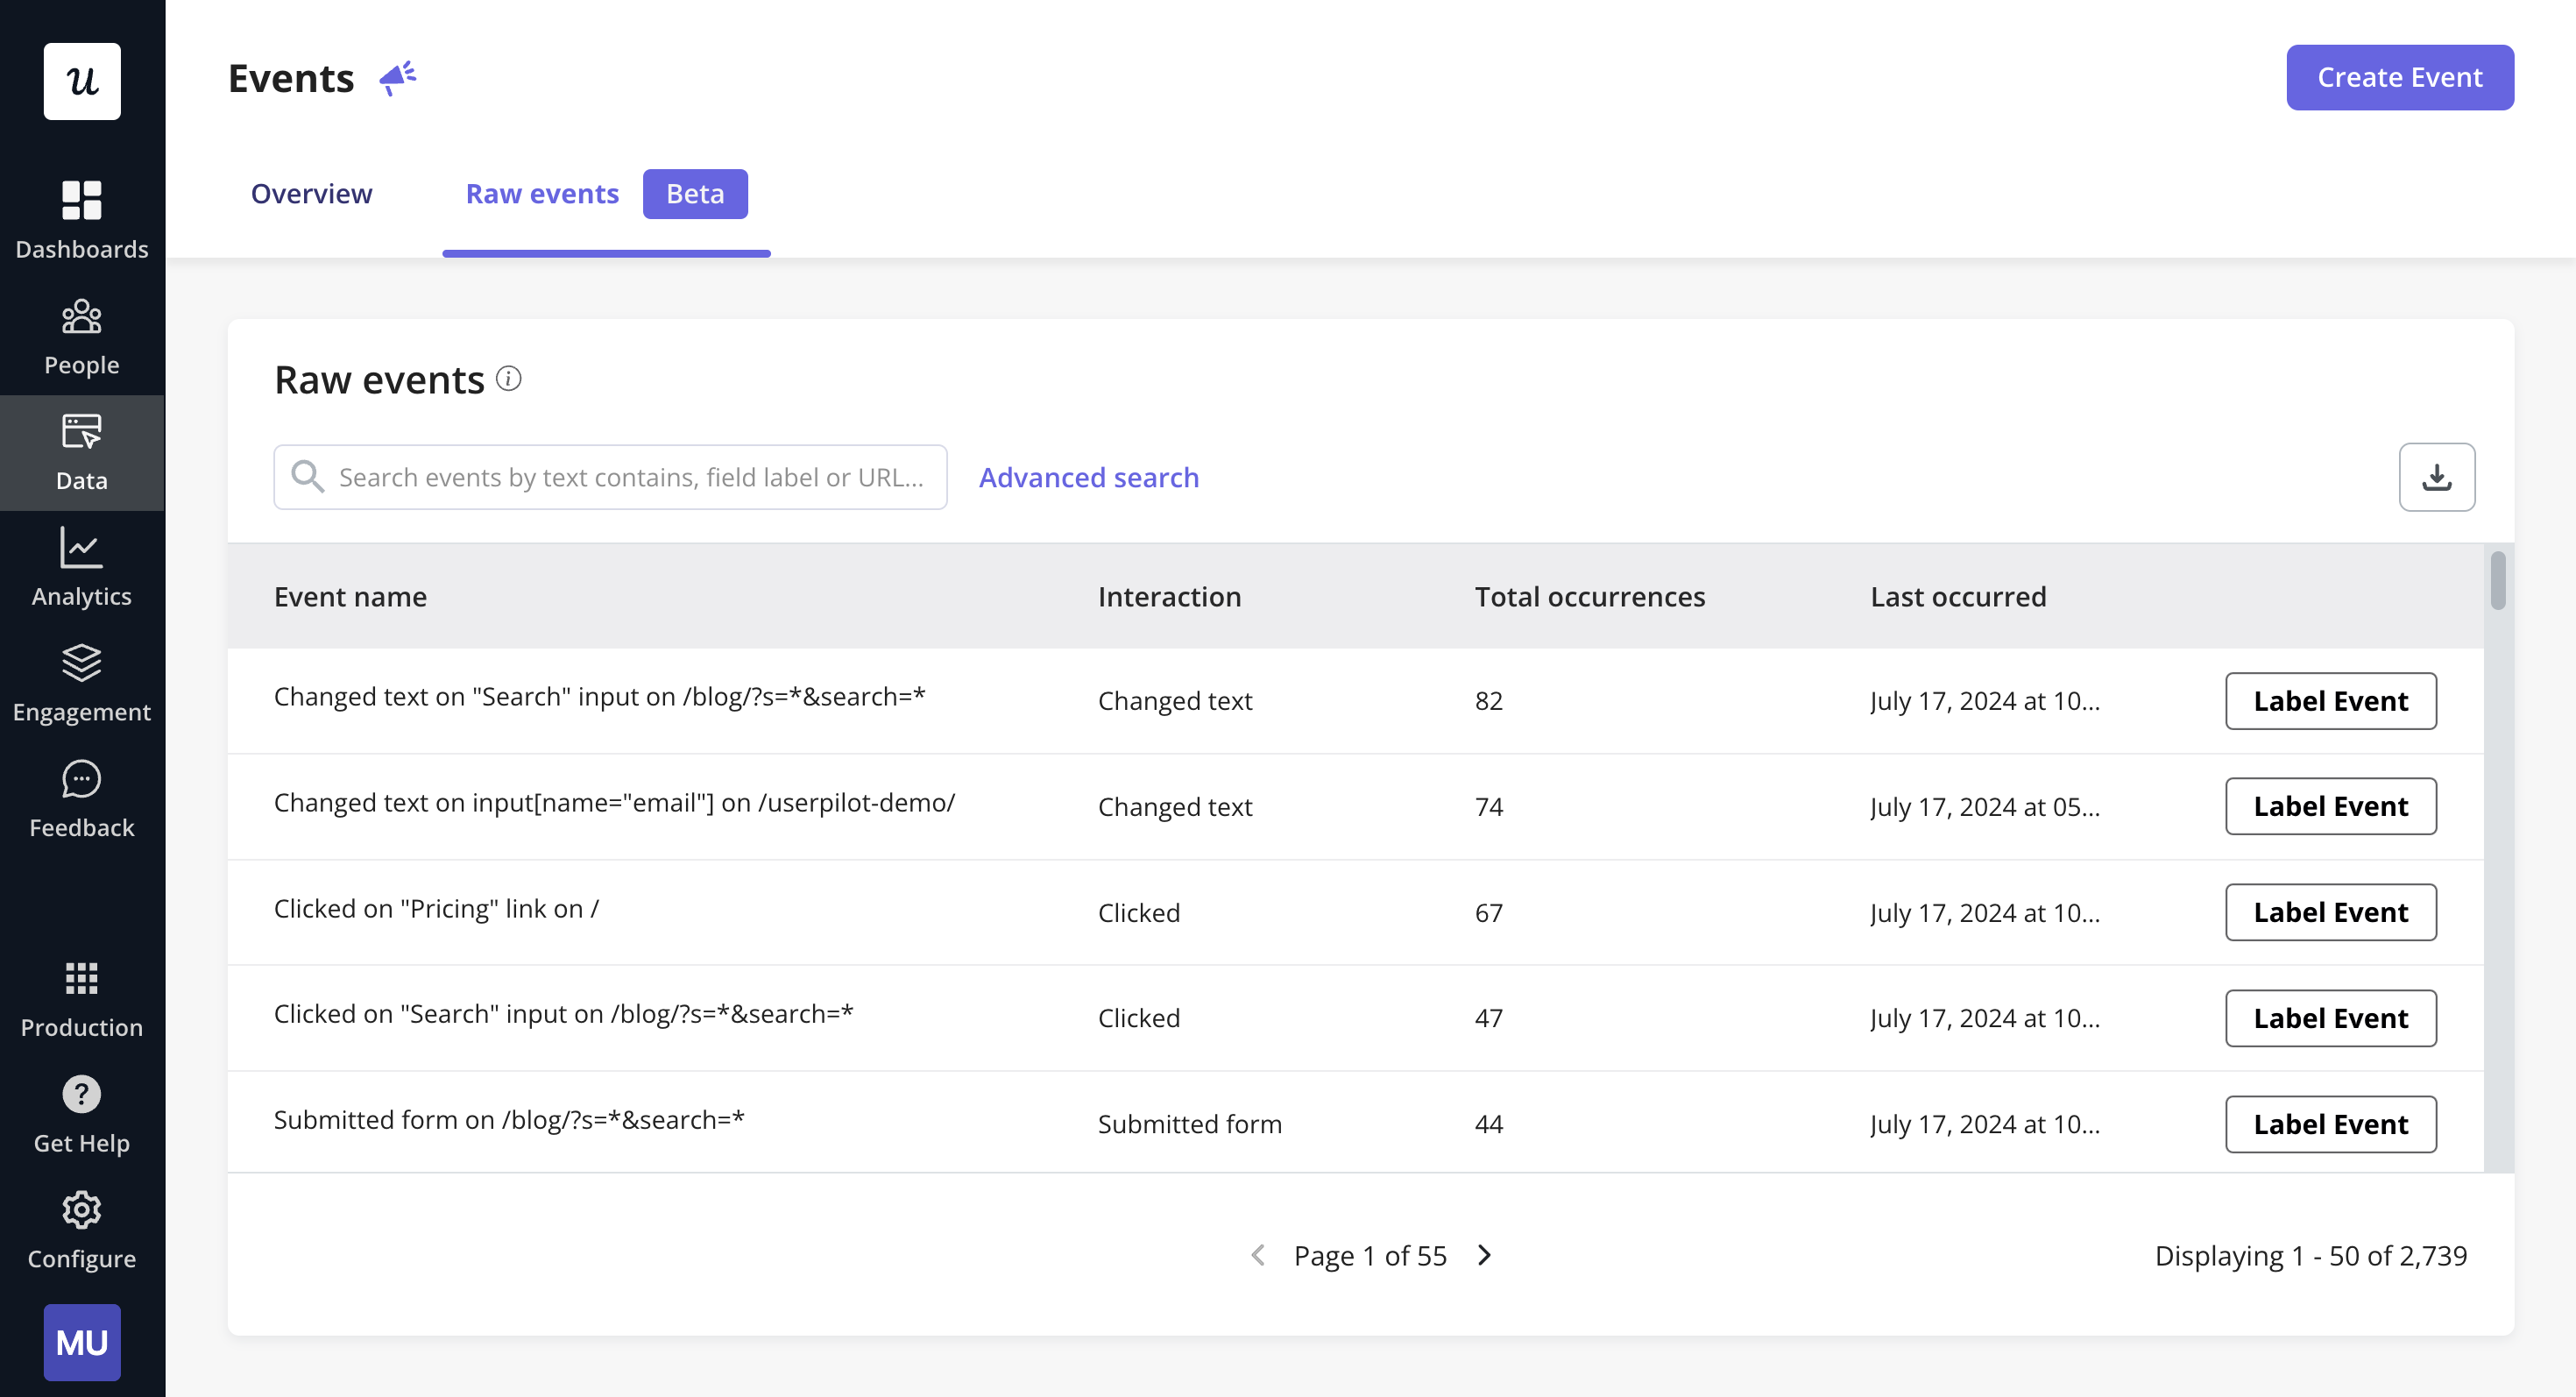
- Combine a few interactions into custom events: Every feature has multiple events/actions buried in it. So, tracking clicks will sometimes be insufficient. For example, consider a social media app with a “post” feature. Within this feature, users can perform multiple actions, such as creating a post, adding images or videos, writing captions, adding hashtags, and clicking the “post” button.

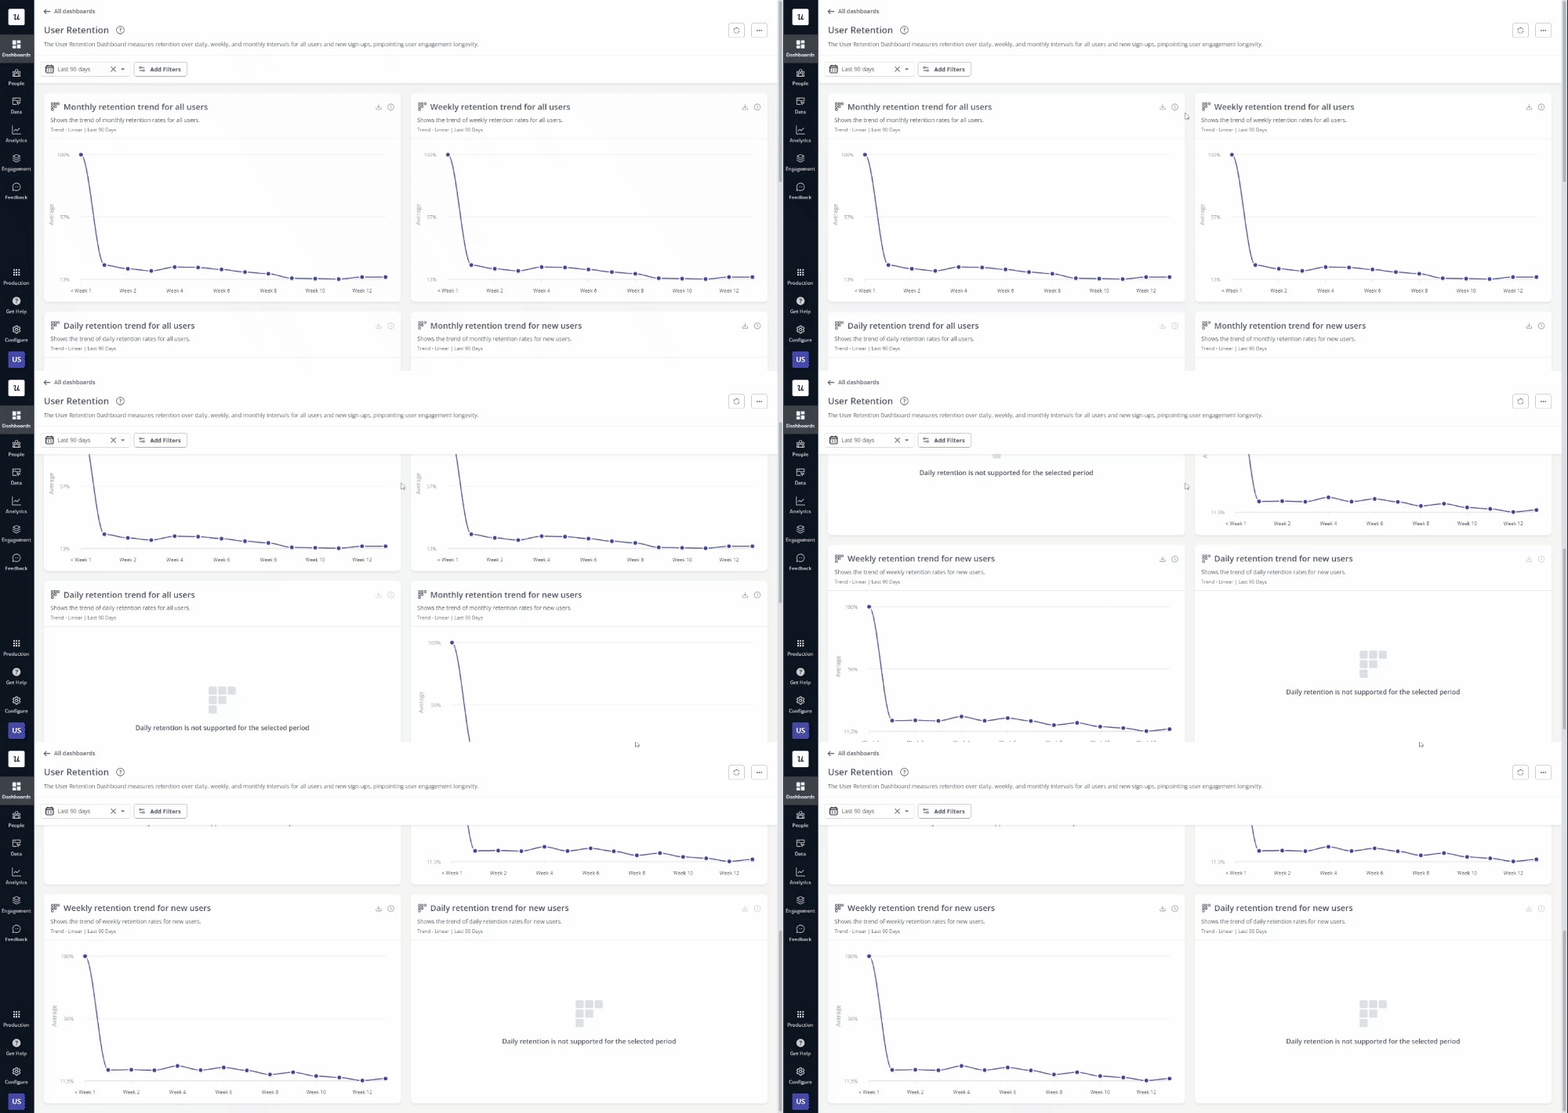
- Visualize key engagement metrics with dashboards: Userpilot offers analytics dashboards where you can compile all the active user-related metrics such as average session duration, number of active users,feature adoption rates, and so on, allowing you to track them at a glance. These dashboards are customizable, allowing you to focus on the metrics that matter most to your team. With clear and accessible visual insights, teams can identify trends, monitor engagement over time, and pinpoint areas for improvement.
Conclusion
You can’t have a thriving SaaS without active and consistent user engagement. Regularly tracking your engagement metrics will help you spot friction and enhance the user experience so customers continue to enjoy your software.
You can’t do this well if you don’t have the right tool in your corner. You need a tool like Userpilot with advanced engagement tracking features.
Apart from measuring DAU, WAU, MAU, our platform also lets you easily segment customers based on their in-app behavior and trigger experiences to boost engagement. Get a Userpilot Demo now and see how.


![What are Release Notes? Definition, Best Practices & Examples [+ Release Note Template] cover](https://blog-static.userpilot.com/blog/wp-content/uploads/2026/02/what-are-release-notes-definition-best-practices-examples-release-note-template_1b727da8d60969c39acdb09f617eb616_2000-1024x670.png)

