Product-Led Growth Strategy in 2026: How to Transition into the Agentic AI Era?


Product-led growth (PLG) is having a public identity crisis in 2026. We all know that software is heading towards a headless, agentic future – where it’s the AI agents that use SaaS tools, not human end users – and where interfaces play a completely different role than they do today
So is there still room for product-led growth here?
…If Parker Harris, Salesforce co-founder, is asking whether anyone should ever log into Salesforce again.
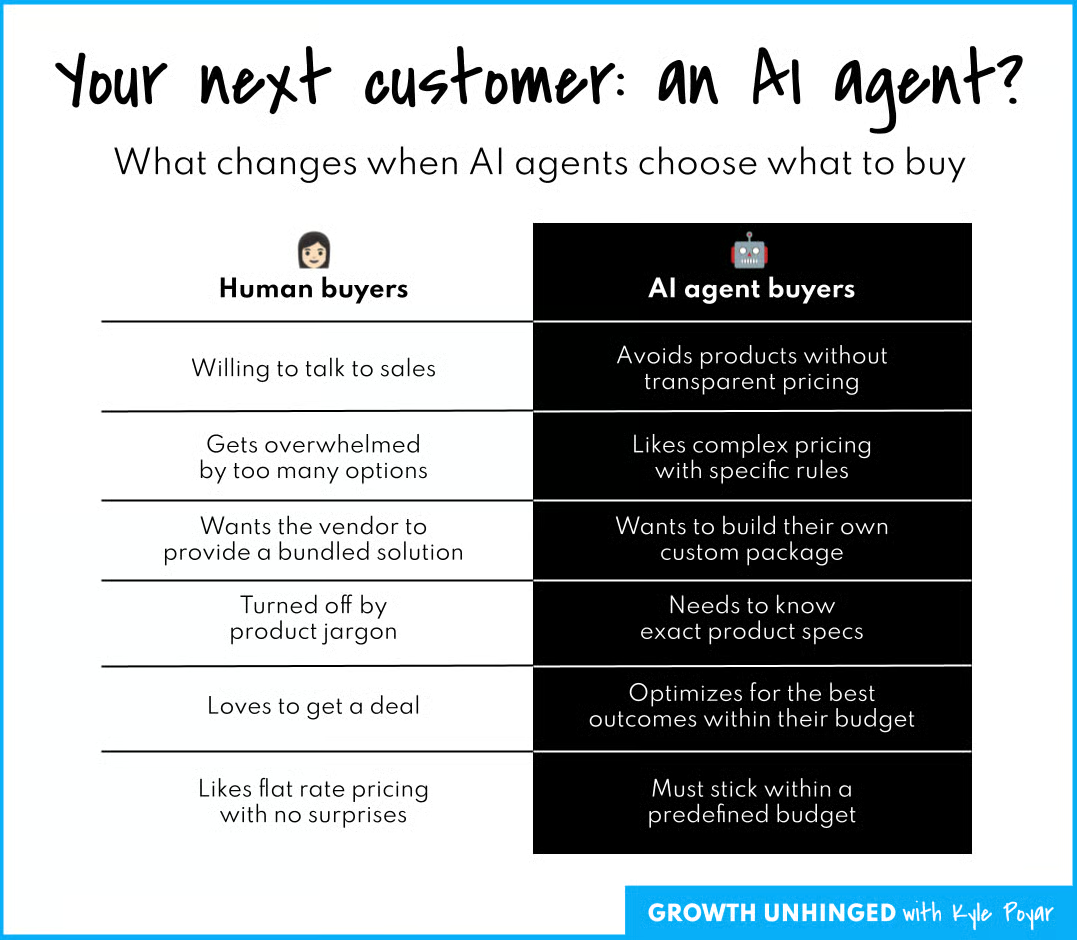
…If Kyle Poyar writes that “your next customer might be an AI agent“.
…If Elena Verna is asking “should MCP be in your ICP?” in her newsletter…
…Then we should be asking ourselves if product-led growth is still relevant – and if will be a few years down the road.
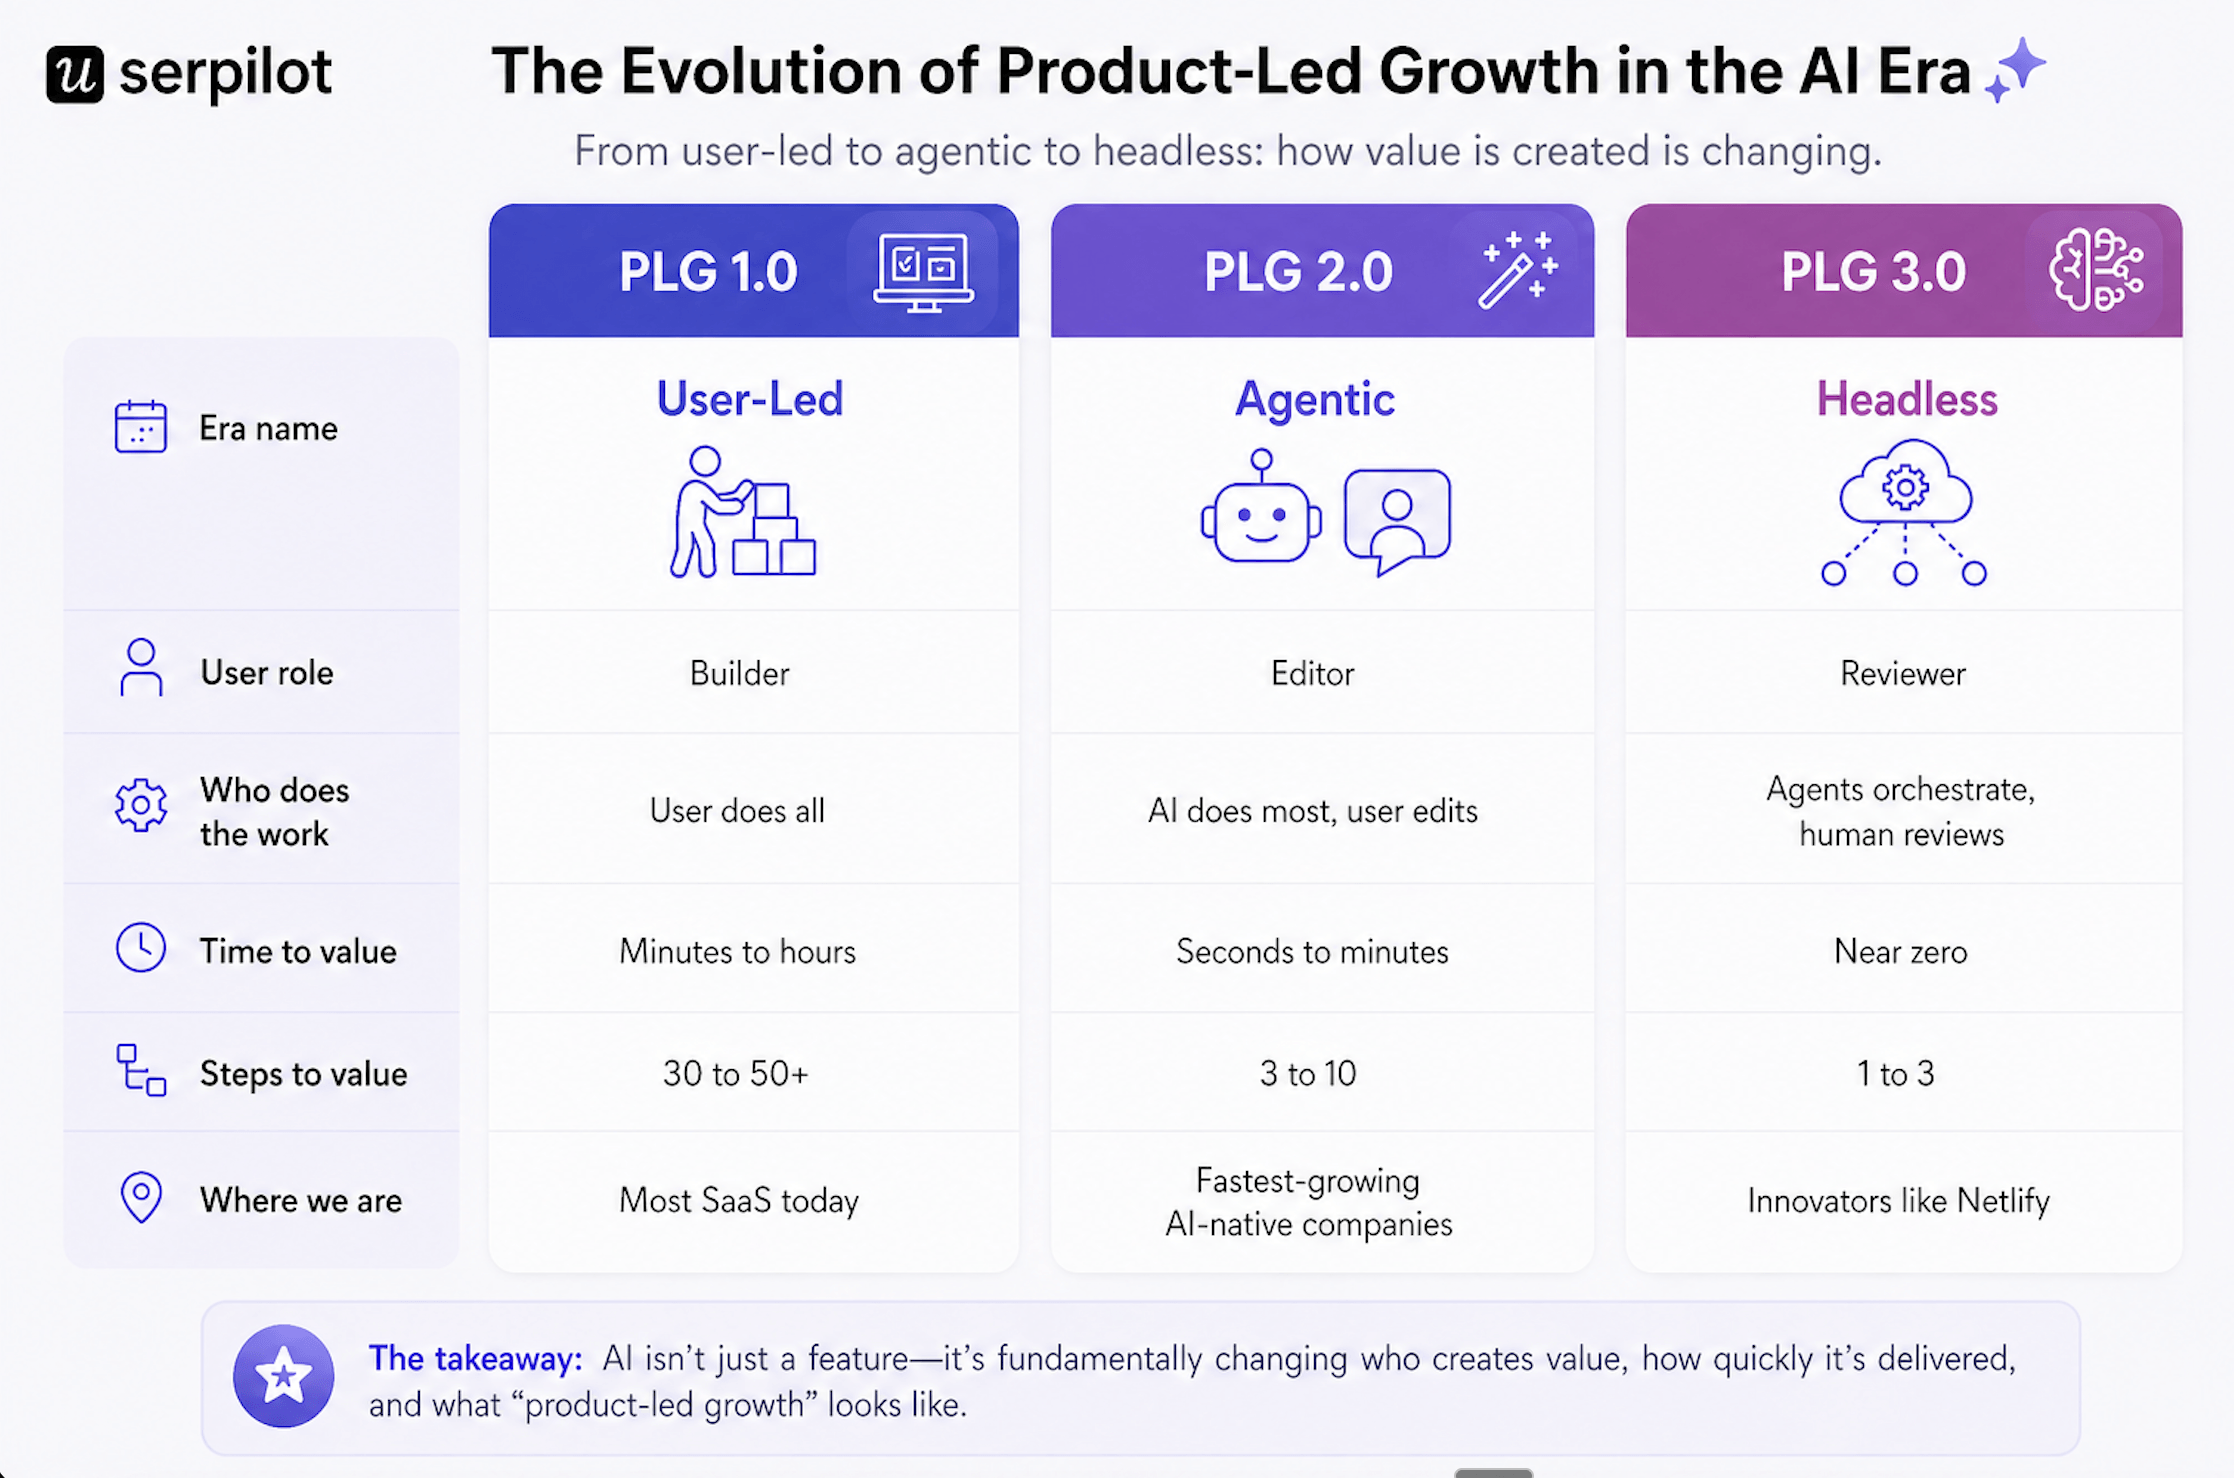
Well, I asked this question to Wes Bush – the father of the term “Product Led Growth” – and here’s what he replied: “PLG is not dead, and won’t be – but it’s evolving quickly. PLG 1.0 = user-led. PLG 2.0 = agentic. PLG 3.0 = headless. What’s interesting is companies like Netlify are already at 3.0 with 80% of their signups being agents, while the majority of traditional SaaS is still in 1.0.”
So in fact – when you think about it – when your product doesn’t need an interface, and AI agents will be evaluating it by the outcomes produced and ease of agentic use rather than human use – product will not disappear from the equation.
Conversely – it will become critical.
So it’s not that Product Led Growth will disappear once human interfaces disappear (or evolve into agent command centers – cause I don’t believe they should disappear altogether) – it’s that its definition will change completely.
And we do need to prepare for the PLG 3.0. reality and adapt our strategies for agentic users.
Meanwhile: the vast majority of B2B SaaS companies still running PLG 1.0 playbooks written five years ago, wondering why activation rates are flat.
So in this post, I will discuss exactly what Product Led Growth 3.0. (for agentic users) means, how to prepare for it, and what to do in the transitional period.
Product-Led Growth in 2026 – Summary:
For those of you who don’t have the time to read – or your agents 😅 – here’s a quick summary of this post:
The new definition of PLG
- PLG is no longer just about humans signing up and finding value on their own. It’s a go-to-market model where the product drives acquisition, conversion, and retention regardless of whether the end user is a human or an AI agent.
- The mechanism has changed. Interfaces are no longer the only path to value. AI agents are now a faster, more powerful mechanism for reaching the same outcome.
- Per Wes Bush: PLG 1.0 = user-led. PLG 2.0 = agentic. PLG 3.0 = headless. Most SaaS is still in 1.0. Netlify is already at 3.0, with 80% of signups being agents.
- The core shift: products will be evaluated by outcomes produced and ease of agentic use, not by UI polish. Your moat is no longer the interface. It’s the proprietary context behind it.
Your PLG strategy for each era
![]()
PLG 1.0: The User-Led Era (where most SaaS lives today)
- Build clean, transparent interfaces.
- Add interactive product tours and tooltips for onboarding.
- Let users select their use case at signup, then personalize the onboarding flow to that use case instead of a mile-long tour.
- Optimize for the lowest possible time to value for that specific use case.
- Replace feature discovery with outcome clarity. Guide users to goals, not UI.
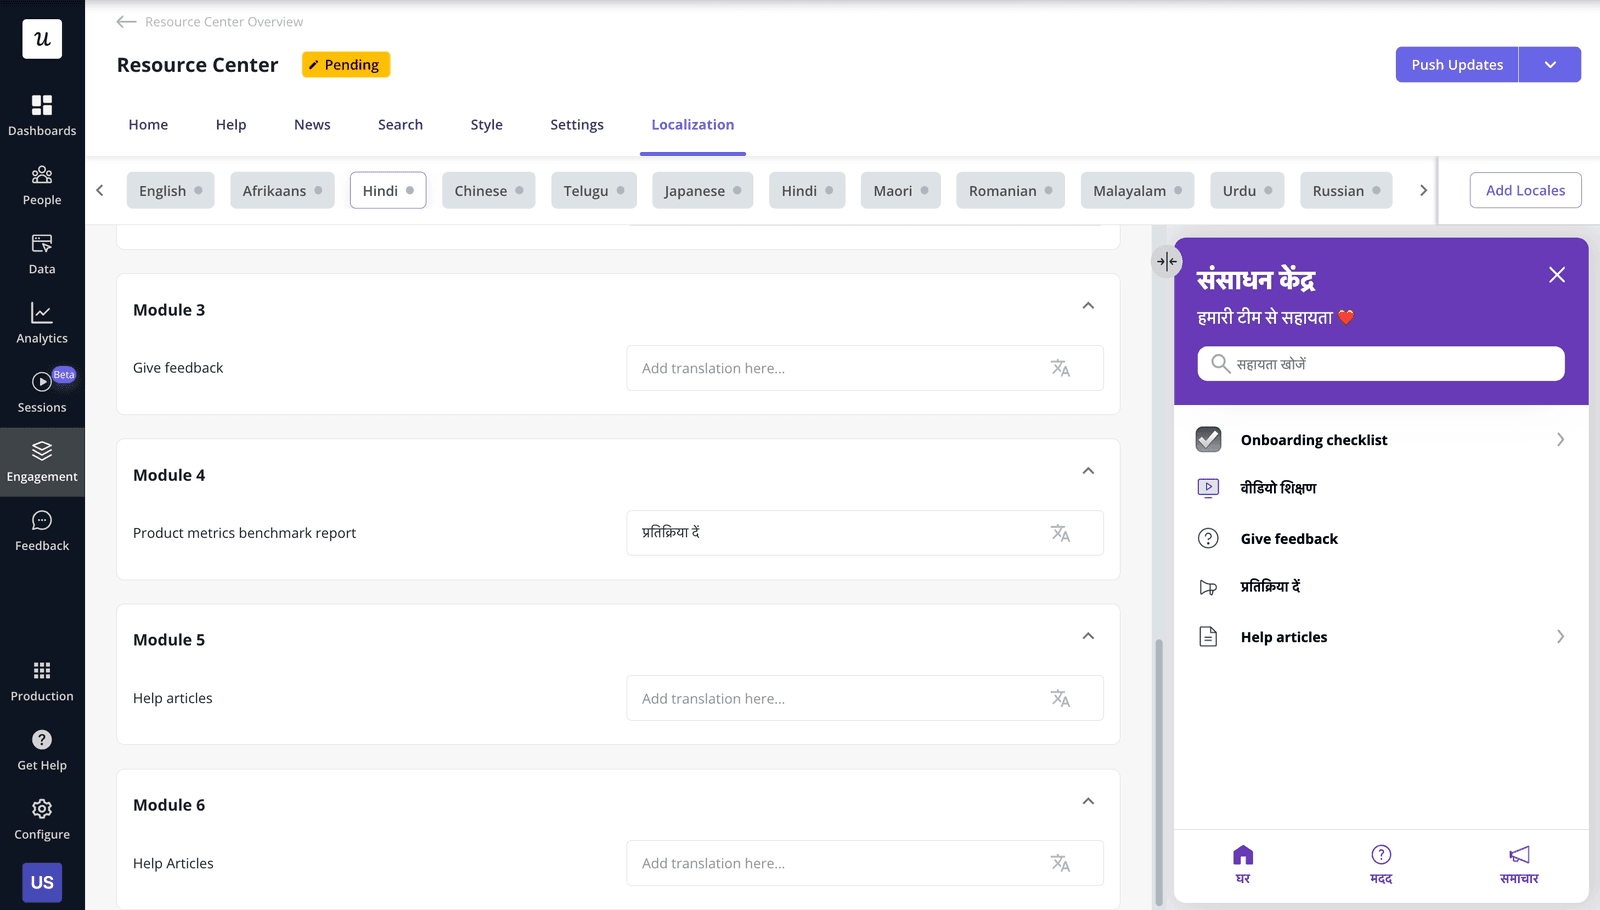
- Provide self-serve support through an in-app Resource Center.
PLG 2.0: The Agentic Era (where the fastest-growing companies are: Cursor, Lovable, Gamma, Harvey AI, Perplexity)
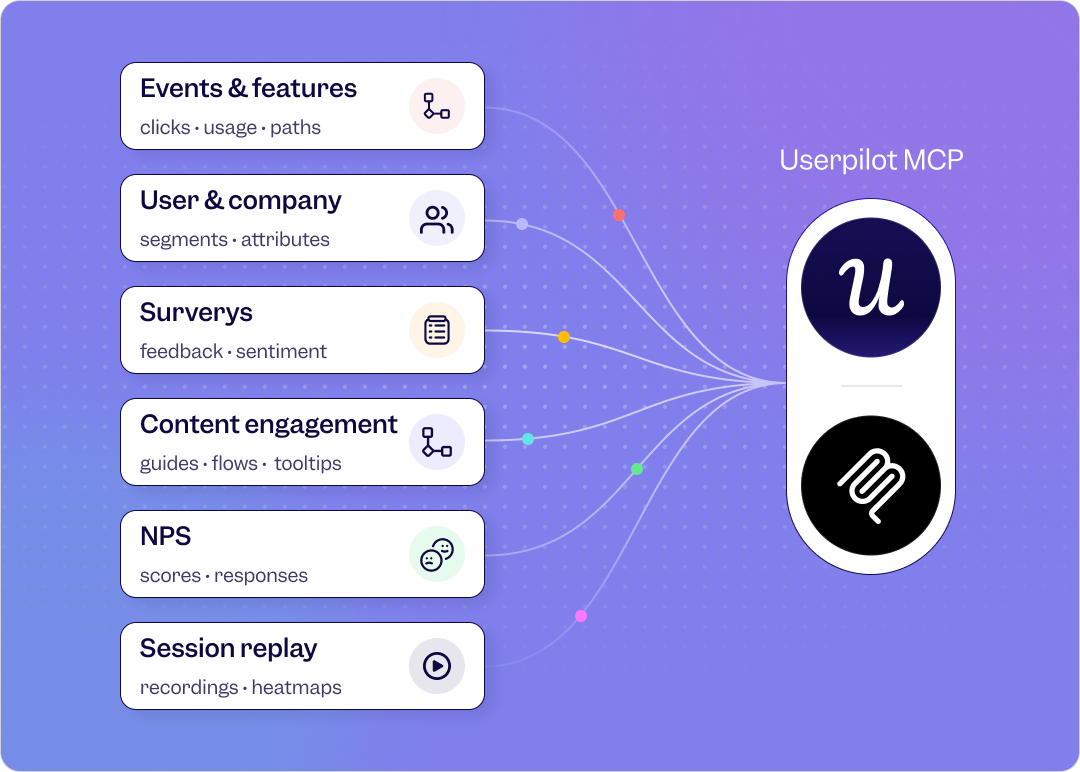
- Build MCP servers and APIs so agents can use your product.
- Use agentic observability tools to show users where their agents failed.
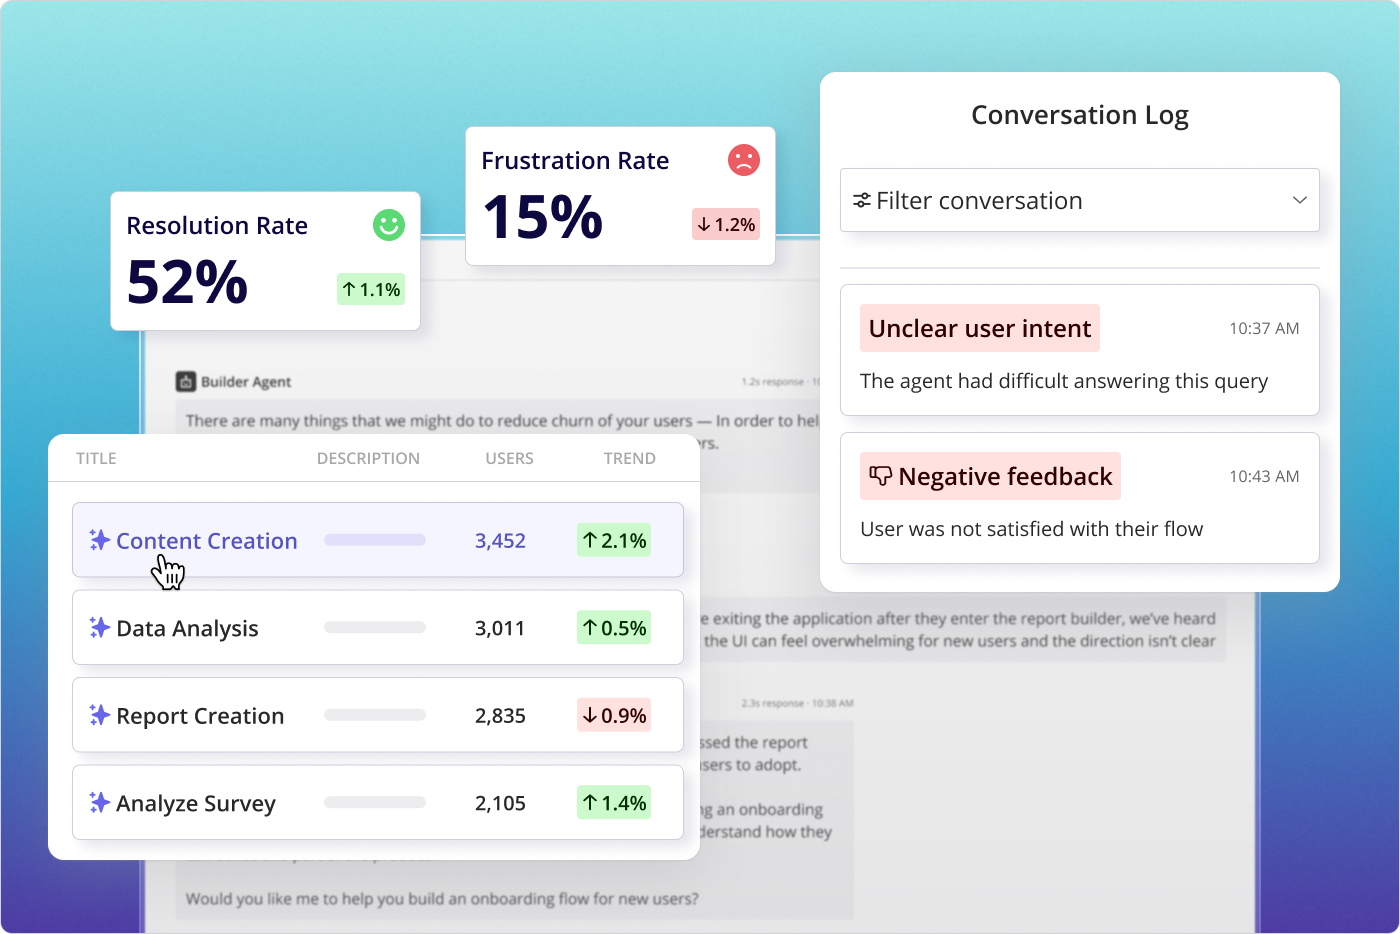
- Provide agent analytics: Rate of failures, errors, and successful runs.
- Add an Agent Command Center dashboard where users see all agent interactions.
- Continue PLG 1.0 strategies (tours, tooltips, walkthroughs) for the new Agent Command Center itself.
- Redefine activation as first successful output. Value = result, not interaction.
- Shift onboarding to prompt design. Teach users how to ask, not where to click.
- Guide outcome refinement, not feature usage. Users want to re-prompt agents when results miss.
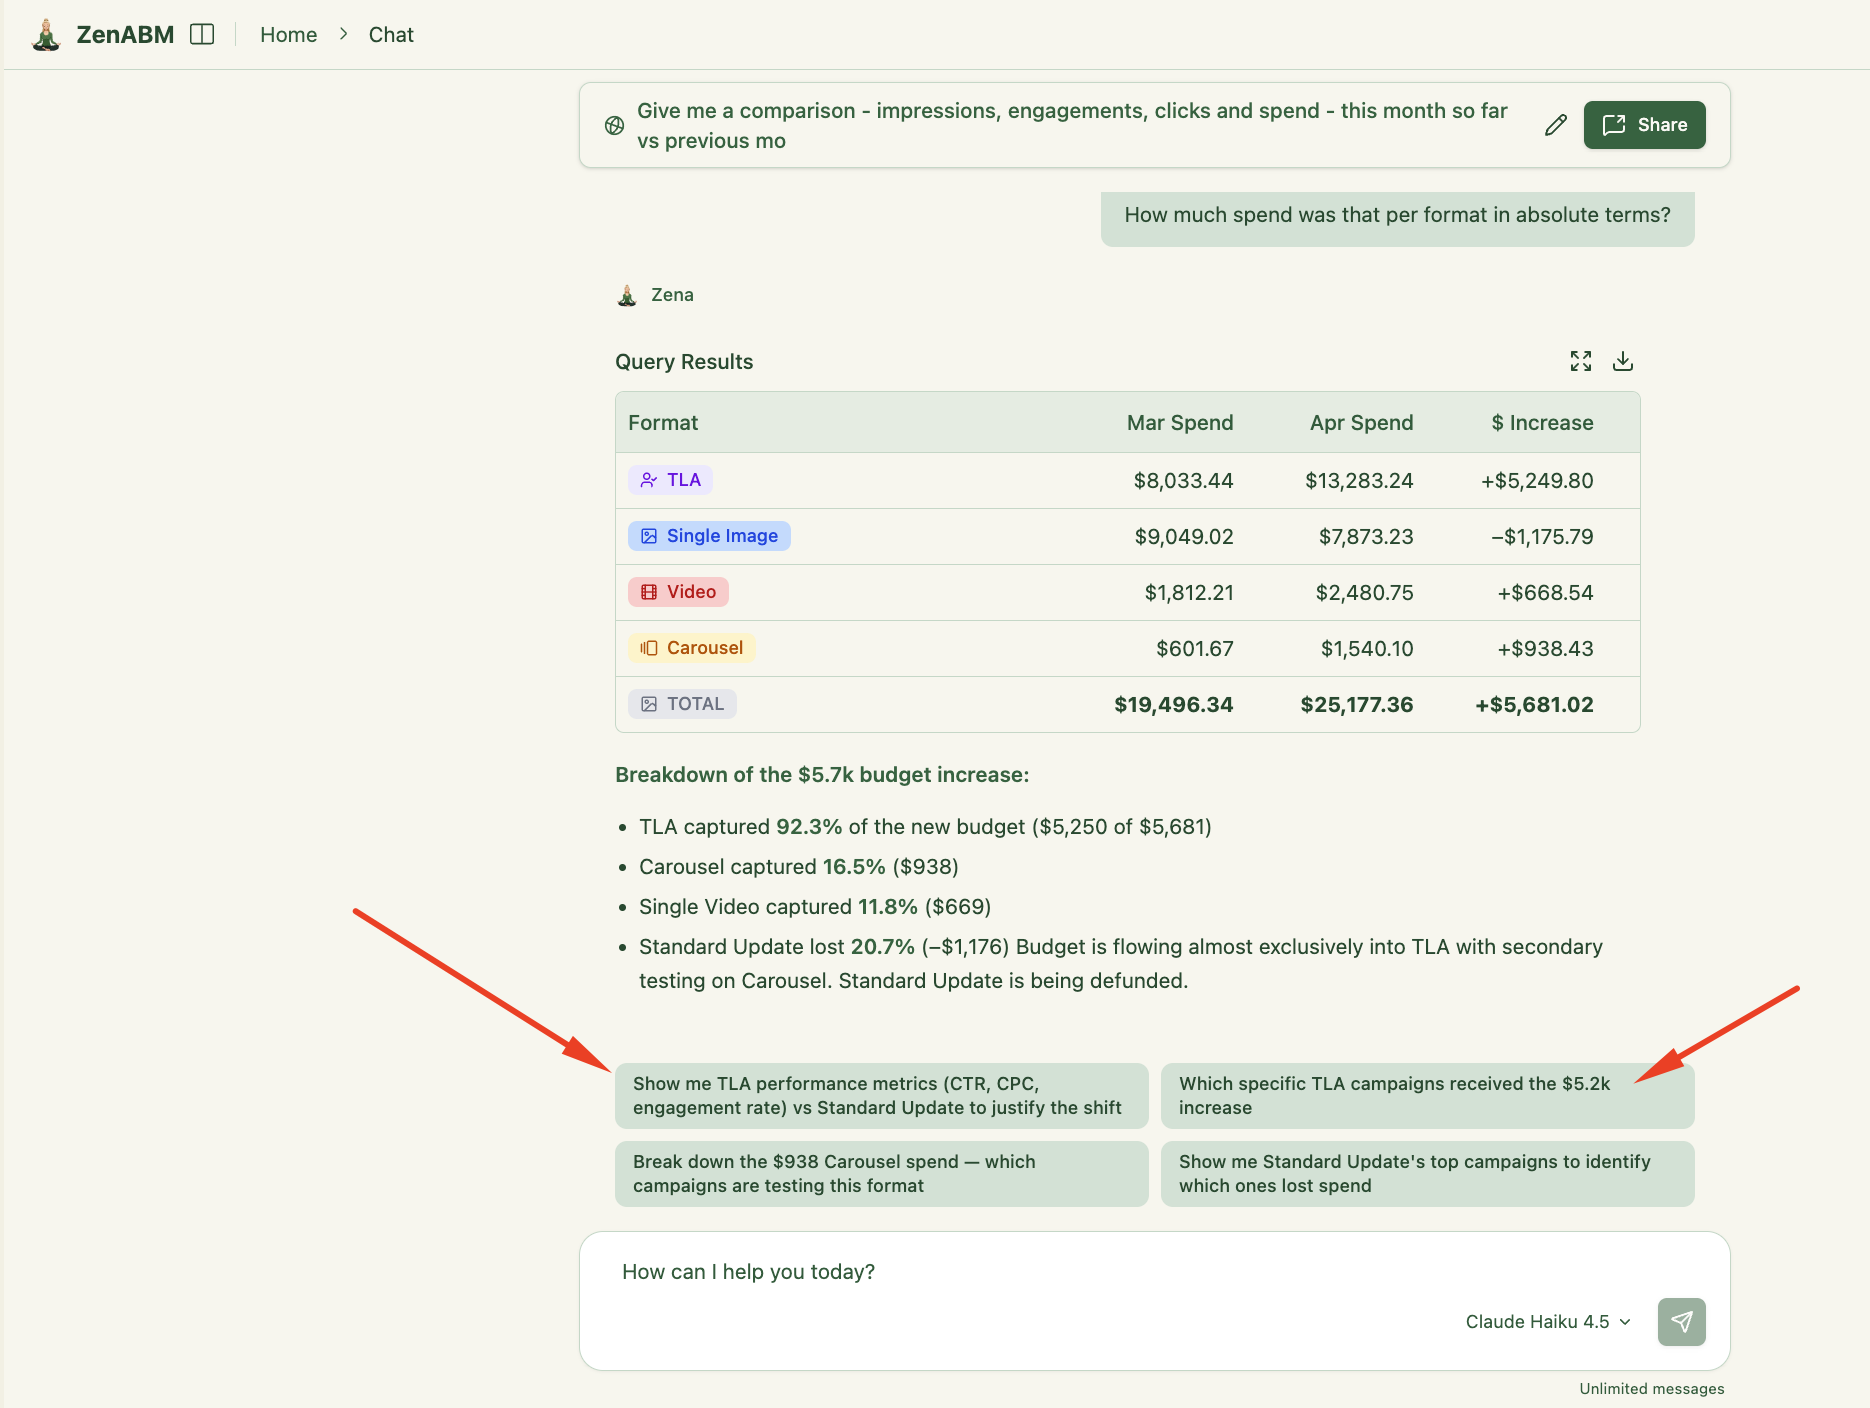
- Embed contextual intelligence. Suggest follow-up prompts and next-best actions based on prior outputs.
- Tighten feedback loops. Run microsurveys on agentic outputs immediately after each run, then feed results back into the model and roadmap.
- Optimize for agent output quality and consistency. Retention now depends on result reliability.
PLG 3.0: The Headless Era (Netlify is already here; most B2B is years away, but the foundations take years to build)
- Make every aspect of your product usable by agents. MCPs, APIs, and structured data replace UI onboarding.
- The command center lives where your users already work (Slack, CRM), not inside your product.
- Measure success via task execution, not user behavior. Agents complete tasks, they don’t click.
- Shift your moat to proprietary context. Data plus workflows that let agents produce best outputs fastest. This takes workflow design using your domain expertise, not UX design. The context is the moat now.
- Design for machine-readable intent. Everything tagged, structured, agent-readable.
- Turn the product into infrastructure that’s compatible with complementary products and available to multiple agents in the ecosystem.
- Optimize for agent discoverability. LLMs and agentic marketplaces are the new acquisition channel.
Readiness checklist: Is your product ready for PLG in 2026?
- Is your “Aha!” moment immediate? PLG 1.0 benchmark was 10 minutes. PLG 2.0 is closer to 60 seconds.
- Is your pricing transparent, self-serve, and machine-readable? Can an AI agent parse your pricing page without making inferences?
- Do you have a clear value metric? Not seats. Netlify already dropped seat-based pricing because agents and non-developers broke the model.
- Is your product usable without explanation? Intuitive UI for humans, machine-readable docs and structured APIs for agents.
- Does the product encourage sharing or collaboration? And critically: can agents trigger sharing, pushing outputs to where users actually work (Slack, CRM)?
- Have you defined PQLs? Including how to score accounts where significant activity is automated.
- Is your product built to scale without constant support involvement? Docs need to be good enough for both humans and agents parsing context.
- Have you audited your docs for outcomes, not just features? Third-party agents need to know what “good” looks like.
- Do you have an MCP integration or agent-readable API? Table stakes for PLG 3.0. Start now, not when it’s urgent.

Product-led growth in 2026: What’s changed and what hasn’t
Product-led growth has been traditionally defined as a go-to-market strategy where the product itself is the primary driver of customer acquisition, conversion, and retention. Not sales teams, not marketing campaigns. The product.
If you’ve used Slack, Zoom, Dropbox, or Calendly, you’ve experienced PLG in action.
You didn’t need a demo or a call with a sales rep to get started.
You signed up, got into the product, and quickly understood what it did and why it was useful.
The product experience did the selling.
That core definition doesn’t change if the end-user changes from human to an AI agent.
But what changes is how we execute it.
An intuitive interface was the mechanism in PLG 1.0. And the goal for UX designers was to make the interfaces more user-friendly and easier to navigate – often by providing additional information and self-serve in-app guidance (tooltips, modals, in-app guides and walkthroughs) to guide the user towards their desired outcome and reduce the time to value:
This is exactly why user onboarding tools like Userpilot, Appcues, Pendo sprung up – to facilitate self-serve product adoption and drive Product-Led Growth.
But that doesn’t change when we swap the user for an AI Agent – AI Agents are just a faster, more powerful mechanism allowing us to achieve the outcome we want to achieve with software.
So PLG won’t replaced by the agentic shift. It will be accelerated by it.
The way we build products needs to change though – to make them “quickly understood” by the agentic users, not human users.
PLG 1.0, 2.0, and 3.0: The evolution you need to understand before anything else
Wes Bush, who coined “product-led growth” and has tracked its evolution longer than almost anyone, frames the shift directly:
That framework is worth sitting with. Most PLG content today, including a lot of what we’ve published, is still written for PLG 1.0.
And PLG 2.0 companies are already eating the world: “What’s interesting is companies like Netlify are already at 3.0 with 80% of their signups being agents while the majority of traditional SaaS is still in 1.0”.
Here’s what each era looks like in practice, and how you should execute your Product-Led Growth strategy for each of them. (I’m including quick bullet points here – I will elaborate on each of them in the next few paragraphs though!)
PLG 1.0: The User-Led Era
This is where most companies – and most user teams – still are.
The user is the builder.
They do all the work: learn the interface, configure the workflow, navigate the onboarding, and eventually reach their “aha!” moment if the product is well-designed. Time to value is measured in minutes to hours. This is still where most traditional SaaS companies operate. Tools like Pendo and Appcues addressed adoption bottlenecks in this era, but they were band-aids on fundamentally labor-intensive processes.
Your PLG strategy for the User-Led Era:
- Build clean, transparent interfaces
- Add interactive product tours and tooltips for user onboarding
- Allow the user to select their use-case at signup – personalize the onboarding flows to their use case, instead of dragging them on a mile long tour across your entire product
- Optimize for the lowest time to value for that use case
- Replace feature discovery with outcome clarity – guide users to goals, not UI.
- Self-serve support through a Resource Center:
PLG 2.0: The Agentic Era
This is where roughly 20% of software has already shifted: AI handles most of the work. The user’s job shifts from builder to editor: prompt, refine, verify.
Time to value goes from hours to seconds. This is where the fastest-growing software companies are operating right now:
- Cursor hit $2B in three years.
- Lovable reached $200M in four months.
- Gamma, Harvey AI, Perplexity: all PLG 2.0 companies, all built on the same insight: remove the work, not just the friction.
Your PLG strategy for the Agentic Era:
- Build MCP servers and APIs.
- Use Agentic Obervability tools (this is again something elite product growth platforms like Userpilot or Pendo provide) to show the users where their agents failed to execute the tasks.
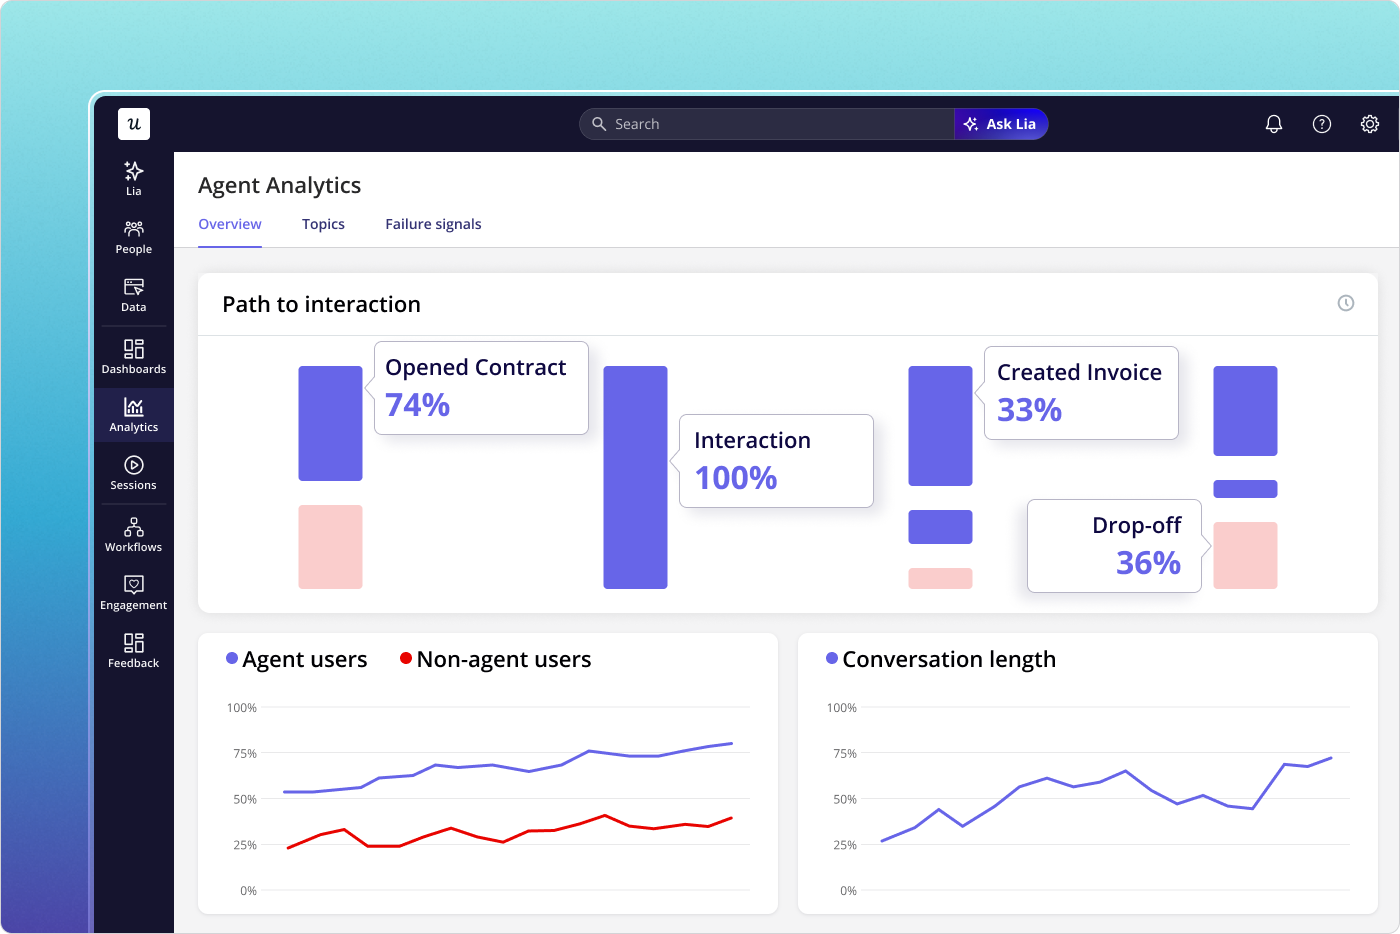
- Provide Agent analytics in your software to showcase the rate of agentic failures, errors vs successful runs.
- Add “Agent command center”: A dashboard where your users can see all the agent interaction
- Continue “PLG 1.0.1.” strategies for the new Agent Command Center dashboards
- Redefine activation as first successful output: Value = result, not interaction.
- Shift onboarding to prompt design: Teach users how to ask, not where to click.
- Guide outcome refinement, not feature usage: The users want to re-promt agents now if they fail to achieve the desirable result on their first run
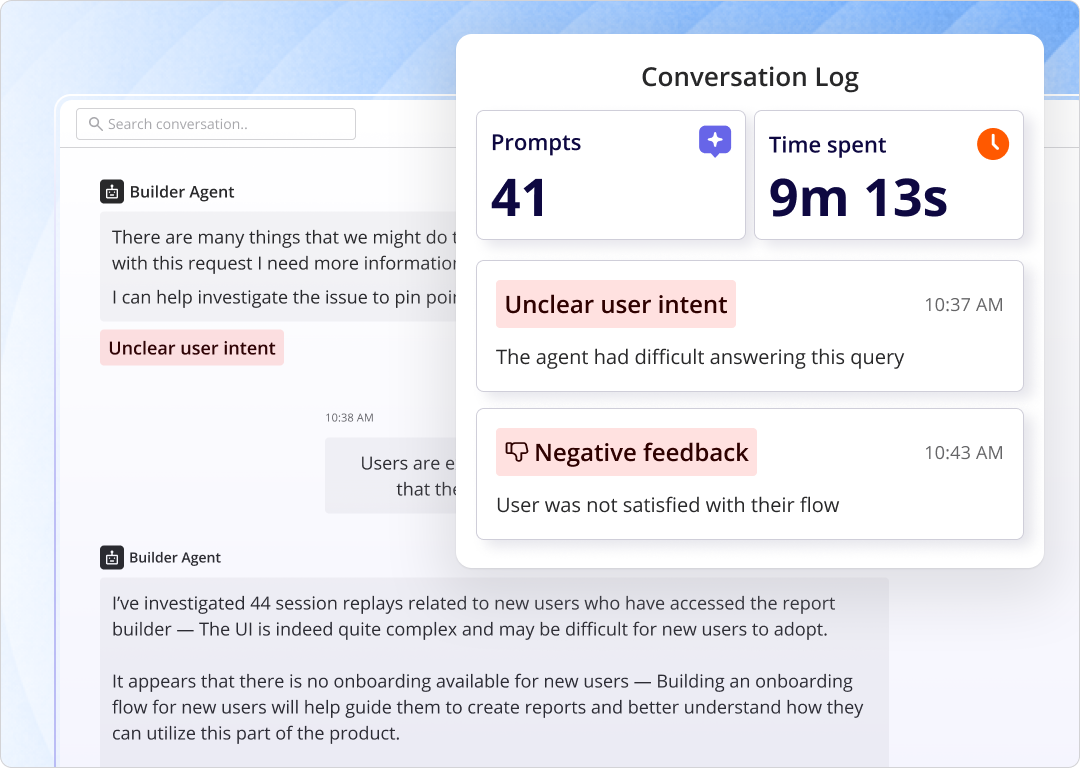
- Embed contextual intelligence into the product: Suggest next best actions or questions based on previous agentic outputs – e.g. like the follow-up prompts ZenABM’s AI agent Zena suggests to the user:
- Tighten feedback loops: Ask your users to provide feedback on the agentic outputs immediately inside your product with microsurveys:
Connect your agent outputs to user feedback and iterate fast on improving your own agents (or your software for the use of third-party agents).
- Optimize for agent output quality and consistency: Retention depends on the reliability of the results agents can achieve with your product.You can do it with Userpilot’s Agent Observability tool:
PLG 3.0: The Headless Era
The user becomes a reviewer. AI agents orchestrate work across products.
The human approves the output, adjusts the brief, and moves on.
Netlify is already here, with 80% of new signups being AI agents. For most B2B software companies, this is a few years away. But “a few years” is not “never,” and the product decisions you make today will determine whether you’re ready when it arrives.
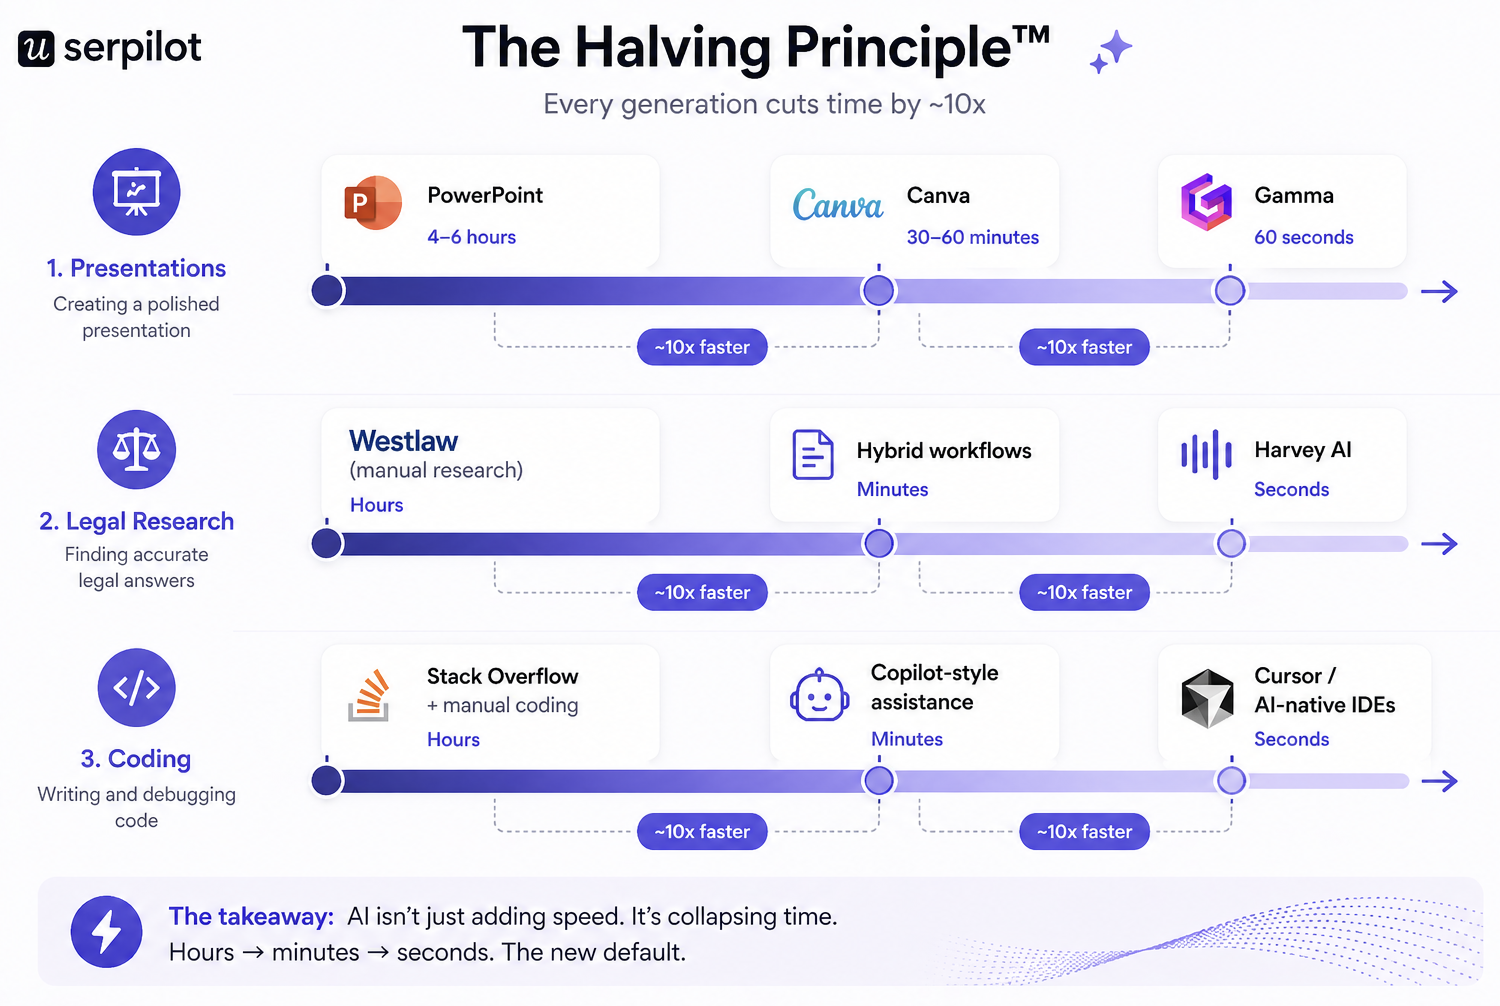
The force driving all three transitions is what Wes calls the Halving Principle™: digital task completion time halves every few years. Better tools create gradual halvings. AI creates rapid ones.
Every time this happens, users don’t compare your product to your direct competitors.
They compare it to the fastest thing they’ve touched recently. Your benchmark is no longer your competitors – it’s every AI-native tool your users interact with in their daily workflow.
Your PLG strategy for the Headless Era:
- Make every aspect of your product usable by agents: MCPs, APIs and structured data replace UI onboarding.
- Command center lives where your users are, not inside your product: Your users talk to your agents e.g. on Slack or in the CRM.
- Measure success via task execution, not user behavior: Agents don’t click, they complete tasks. You need to measure how often your product allowed the agents (both yours and third-party) to complete the tasks successfully.
- Shift your moat to proprietary context: Data + workflows that allow the agents to produce the best outputs in the shortest time (yes, this actually requires good product design using your domain expertise – not UX design per se, but workflow design). This is your moat now – not your product interface.
- Design for machine-readable intent: Agents need clarity, not flexibility. Everything in your product needs to be tagged and agent-readable.
- Turn product into infrastructure, compatible with complementary products: Usage happens via systems, not one-off actions performed by humans. Your product needs to be available to multiple agents in the ecosystem.
- Optimize for agent discoverability: LLMs and agentic marketplaces become your acquisition channel. Make sure your product is visible there.
Why PLG still matters in the agentic era (and compounds more than every other growth model)
The agentic shift doesn’t change the fundamental economics that made PLG attractive in the first place. If anything, it amplifies them. Here are the three core advantages, updated for where we actually are in 2026:
1. Decouple revenue from headcount 10x faster with Agents
Marketing and sales-led SaaS models scale revenue by scaling people. To double revenue, you often need to double the team: commissions, enablement, management overhead. PLG breaks this dependency by shifting how you acquire customers, educate users, and qualify demand into the product itself, removing people as the primary bottleneck to growth.
In PLG 2.0, this decoupling goes further:
- AI removes the need for user onboarding and reduces time to value to seconds, which means acquisition costs drop again.
- The TAM expands beyond users with existing domain expertise to anyone who can form an opinion on an AI-generated output. That’s roughly a 10x expansion in total addressable market at each PLG era transition.
2. Accelerate time to value – Again, faster than ever
The longer it takes for a user to experience real value, the more likely they are to disengage or churn. PLG puts time to value at the center of the experience, treating early activation as a design problem rather than something that happens downstream in the customer journey.
Time to value is also a competitive moat in a way it wasn’t three years ago.
Users compare every product to the last AI-native experience they touched, not just to direct competitors.
If your PLG 1.0 product takes 20 minutes to activate while a PLG 2.0 competitor delivers the same outcome in 30 seconds – you get the point.
Shorter time to value also improves customer acquisition efficiency by reducing drop-off and speeding up payback. In a world where AI-native tools are setting the benchmark, this isn’t optional.
3. Expose UX reality and force you to find your real moat
When the product’s outcome becomes the primary way users discover value, there’s no real difference between the user experience and the outcome anymore.
This is the biggest shift in PLG 1.0. vs 2.0. and 3.0. – what we called “user stickiness” for most of PLG’s history was often just…switching cost dressed up as user loyalty.
Users had to learn your specific UI, your navigation patterns, your keyboard shortcuts, because they had no other choice. They paid a mental tax. As PLG moves into PLG 2.0 and 3.0, agents pay none of those costs.
They pull data, generate outputs, evaluate quality, and move on. The biggest unlock is *what* they can pull – not how.
Elena Verna captured this in her recent newsletter:
- In the agentic layer, your real moat becomes whatever cannot be easily replicated at the output level: proprietary data, unique aggregation, network effects, deep integration into systems of record.
- The moat isn’t the UI. The moat is the context that used to be trapped behind the UI.
This has direct implications for how you think about product usage data. The behavioral signals and outcome patterns you’ve been collecting aren’t just for optimizing onboarding flows. They’re the foundation of contextual intelligence, built up over years, that makes your product hard to replace for both human users and their agents.
Is your product actually ready for PLG in 2026?
Before committing to a product-led growth model, it’s worth checking whether your product and organization are genuinely set up to support it, not just in the PLG 1.0 sense but for the era you’re actually competing in – PLG 2.0. or even 3.0.
Use this checklist as your reality check:
- Is your “Aha!” moment immediate?
- Can a new user experience core value within minutes of signing up, without human assistance? In PLG 1.0, under ten minutes was acceptable. In PLG 2.0, the benchmark is closer to 60 seconds.
- If meaningful value only appears after complex setup or multi-day integrations, pure PLG will be hard to sustain. You’ll be competing against products that deliver comparable output in seconds.
- Is your pricing transparent, self-serve, and machine-readable?
- PLG depends on users being able to evaluate and upgrade on their own. If pricing requires a conversation to understand, you’re introducing friction at exactly the moment users are ready to convert. Your pricing also needs to be structured enough for agents to parse.
- Pricing pages designed for humans often break when AI agents are the evaluators. Can a model read your pricing page and understand what your product costs without making inferences?
- Do you have a clear value metric?
- Your pricing should scale with usage that reflects real customer value, not seats!
- Note that in the agent era, “seats” as a value metric is starting to break down. Netlify removed seat-based pricing from its Pro plan explicitly because it makes less sense when AI agents and non-developers are building with your product.
- Is your product usable without explanation?
- For human users, this means intuitive UI. For agent users (and you need to start thinking about both), it means machine-readable documentation, well-structured APIs, and clear exposure of your core objects.
- Does the product encourage sharing or collaboration?
- PLG grows faster when usage naturally expands to more people. Invites, shared outputs, and collaborative workflows create organic acquisition loops.
- The question to add in 2026: can agents trigger sharing, not just humans? E.g. can your agents push the information to where the users are actually working (e.g. CRM, Slack) rather than keeping the outputs inside your product?
- Have you defined product-qualified leads?
- Usage signals matter more than form fills in a PLG model. You need a clear definition of which behaviors indicate user intent, readiness, or expansion potential.
- Your PQL definition also needs to account for agent-initiated usage. How do you score an account where a significant share of activity is automated?
- Is your product built to scale without constant support involvement?
- High-touch support doesn’t scale to thousands of free or trial users. Documentation, in-app guidance, and self-serve help need to handle the majority of questions without manual intervention.
- In the agentic era, that documentation also needs to be good enough for agents parsing context, not just humans seeking help.
- Have you audited your docs for outcomes, not just features?
- Do your docs tell users and their agents what “good” looks like? Or do they just describe buttons?
- This distinction will become the key differentiator in PLG 3.0. – the third-party agents need to know exactly what quality of the output is expected of them.
- Do you have an MCP integration or agent-readable API?
- If you want agents to work inside your product on behalf of users, you need to expose your core objects via a protocol they can access.
- This is table stakes for competing in the PLG 3.0 era, and the right time to start building it is now, not when it’s urgent.
What PLG teams should actually be doing this quarter
Given everything above, here’s how I’d prioritize if I were running product right now, not in the abstract but this quarter specifically.
- Rewrite your docs for outcomes, not features: Do they tell users and their agents what “good” looks like? Or do they just describe buttons? The products that win Phase 3 will have codified domain expertise: best practices, benchmarks, and outcome frameworks baked into the product itself. Start building that library now.
- Expose the boring stuff via MCP before the exciting stuff: Read access to your core objects is table stakes. If an agent can’t list customers, pull a report, or read the state of a record, none of the interesting agentic use cases matter yet. Build boring first.
- Protect the interface while you still need it: The transition will take years. During those years, the majority of your users are still humans who need well-designed products. Don’t ship worse UX because “headless is the future.” The products that win the transition are lovable to humans today and agent-accessible tomorrow, not one or the other.
- Figure out what your real moat is: Honestly. If the answer is “our UI is better,” you have a problem. If it’s “we have five years of customer behavioral data nobody else has,” you have an asset. If it’s “we’ve figured out what actually drives outcomes in our category and codified it,” you have a moat. Be honest about which one you’re actually sitting on.
How to implement product-led growth step by step: A 2026 playbook
If you checked off five or more items above, you’re in a strong position to adopt product-led growth. Below is a phased implementation approach – updated for where the model is actually heading in 2026, but still not skipping any steps:
Phase 1: Engineer the shortest possible path to value
In PLG 1.0, “fast time to value” meant under ten minutes. The benchmark Wes Bush’s research points to for PLG 2.0 is closer to 60 seconds, and the leading AI-native products deliver value on first touch, before account creation. You’re probably not rebuilding your product architecture this quarter, but you can close the gap significantly. Three tactics that make the biggest consistent difference:
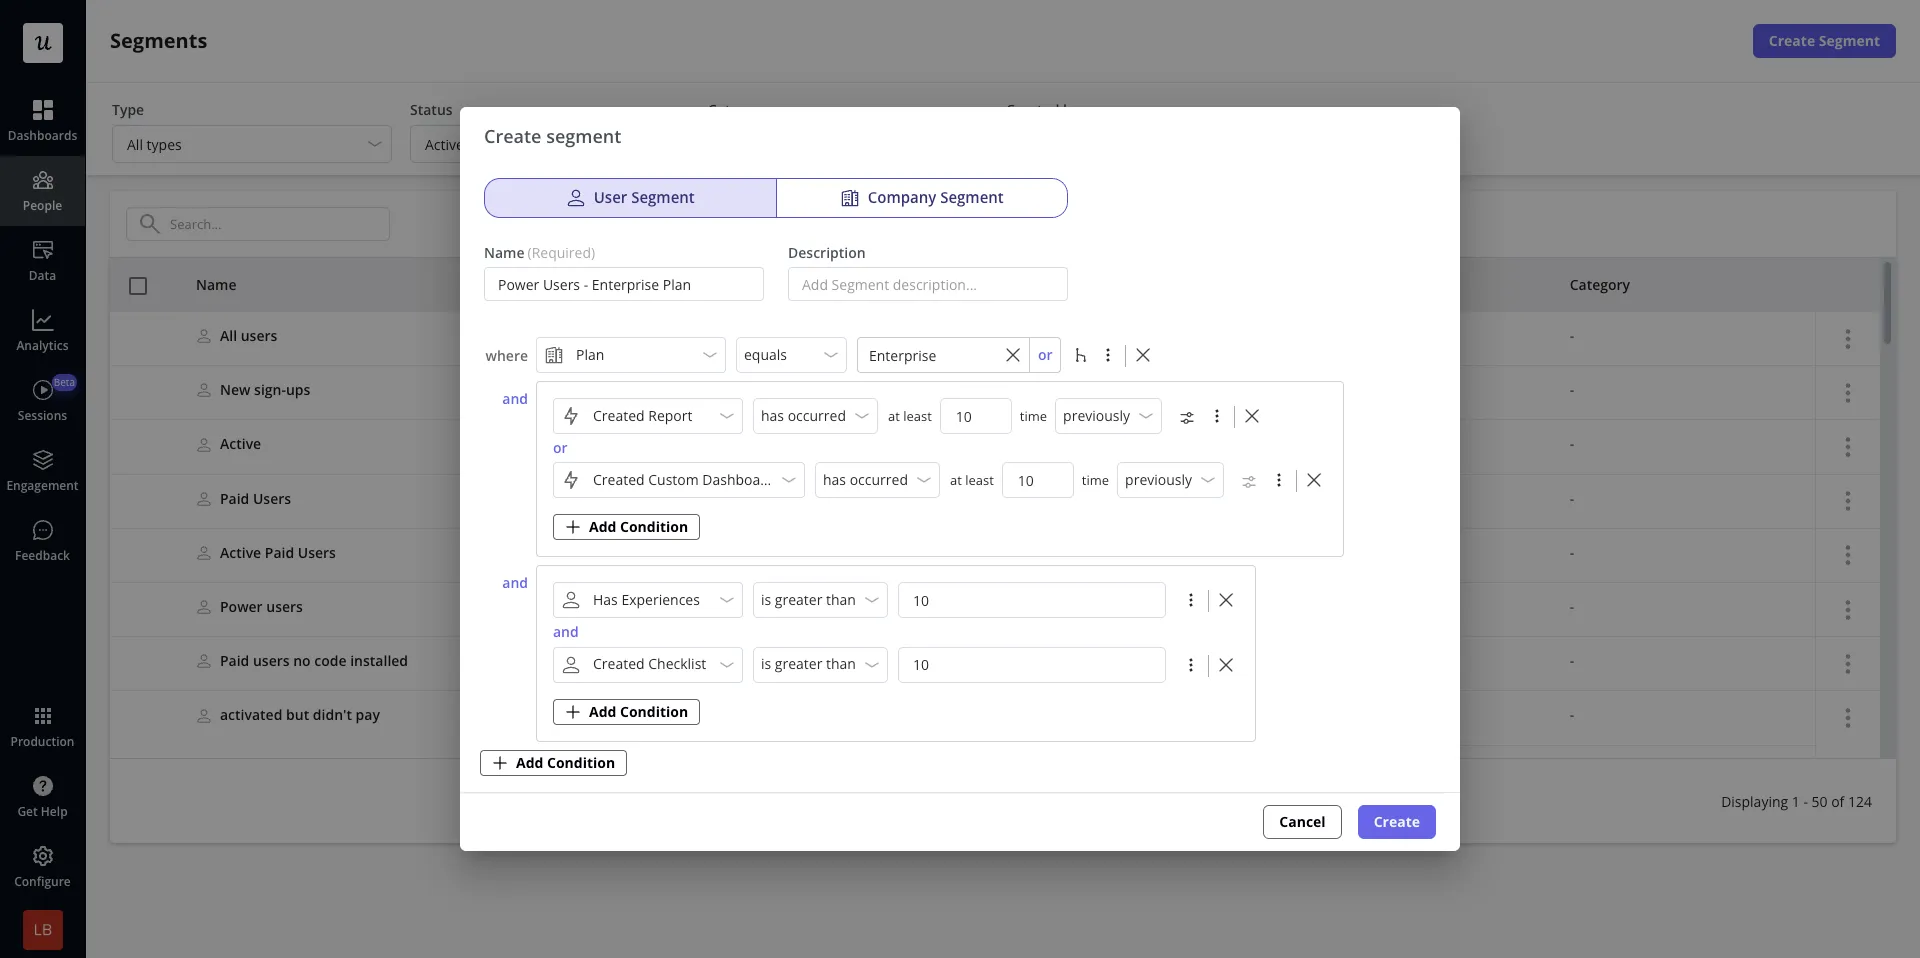
- Build interactive walkthroughs that teach through action: I’m a strong advocate for interactive walkthroughs because they teach through doing, not explaining. Instead of passive tours pointing at features, effective walkthroughs guide users step by step through a real task. The user performs an action, sees the outcome, and moves forward. By the time the onboarding flow ends, they’ve already experienced value, not watched a demo of it. You don’t even need to build these flows manually anymore. Lia, Userpilot’s AI agent, builds in-app onboarding experiences autonomously. You describe the outcome you want new users to reach (“guide new signups to publish their first report,” “get trial users to invite a teammate before day three”), and Lia generates the walkthrough, writes the copy, places the tooltips, sets the behavioral triggers, and ships the flow inside your product. No PM writing UX copy at midnight. No designer placing modals. No engineer wiring up event triggers. You give Lia an outcome, she ships the flow:
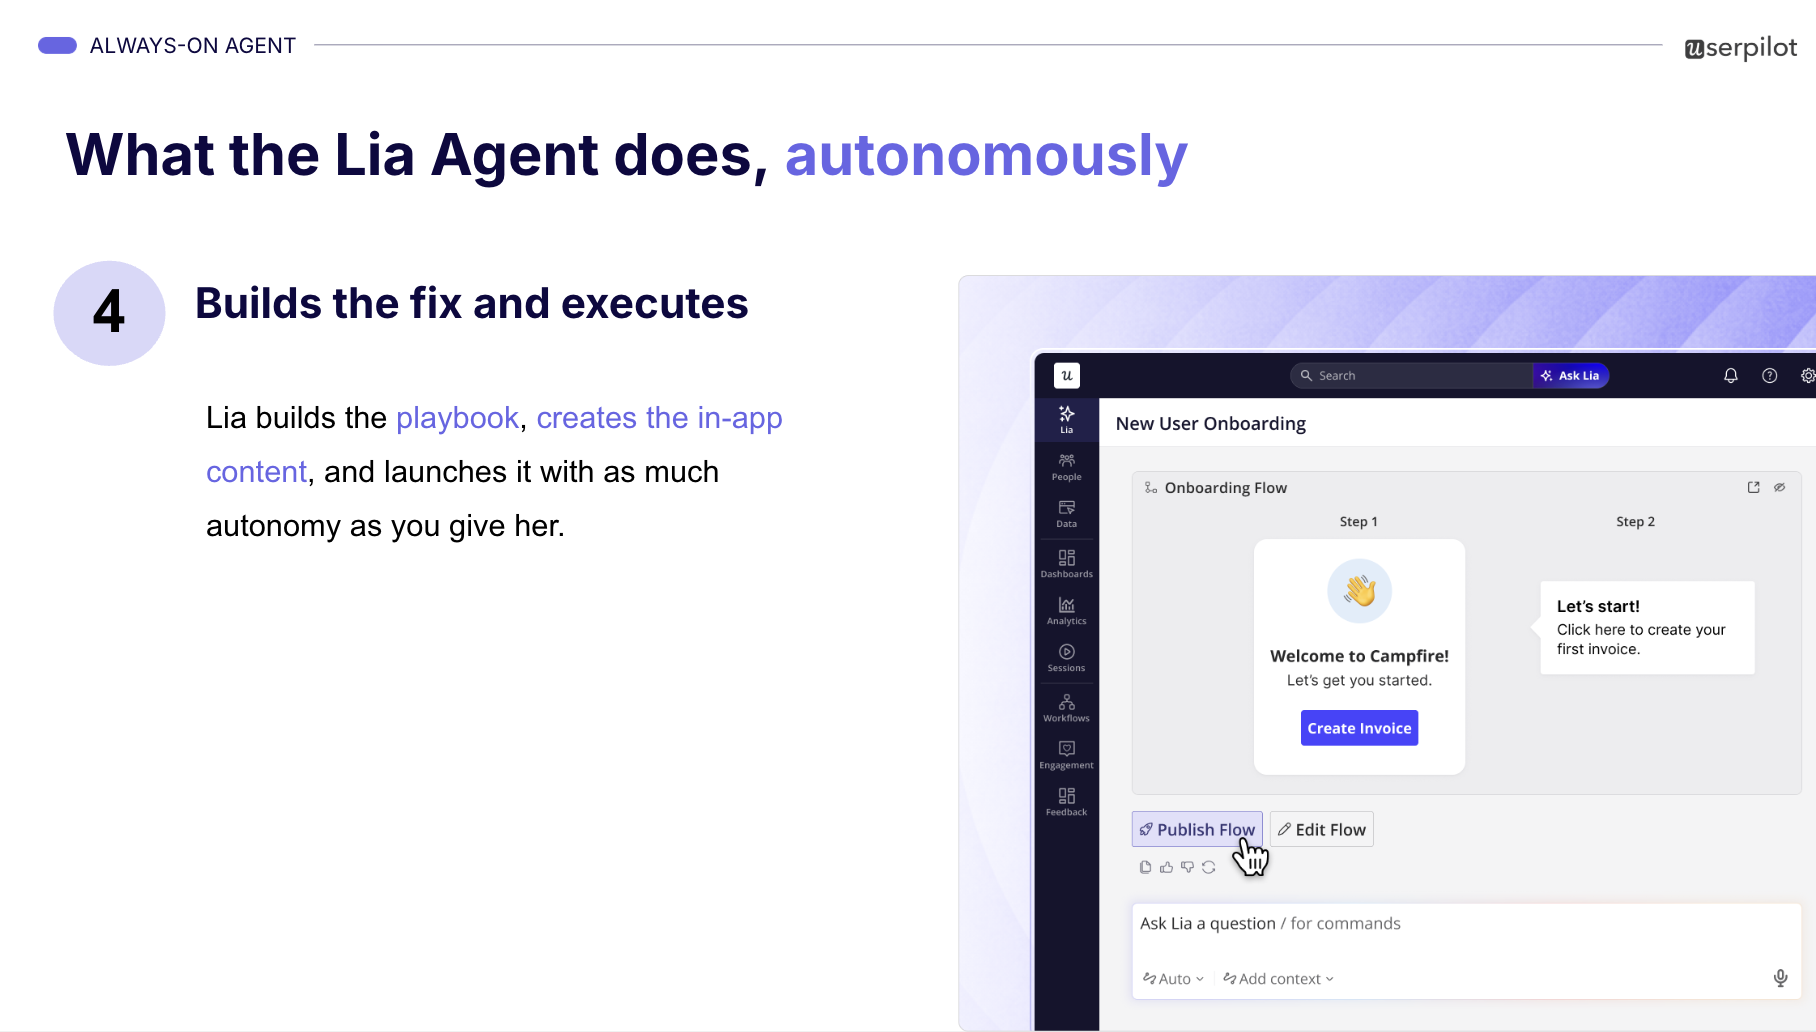
This is PLG 2.0 applied to onboarding itself: you describe the result, the agent ships the experience. The same shift you’re making for your users, we’re making for the people who build for them.
- Eliminate early friction ruthlessly: Audit your signup flow and first session with one question: does this step directly help the user reach value right now? Remove everything that doesn’t, including anything an agent would stumble on. Credit card fields, long forms, email verification gates, forced configuration steps: each one is a competitor doing nothing. If your product depends on data to be useful, provide demo data so users (and agents evaluating you) aren’t staring at empty states.
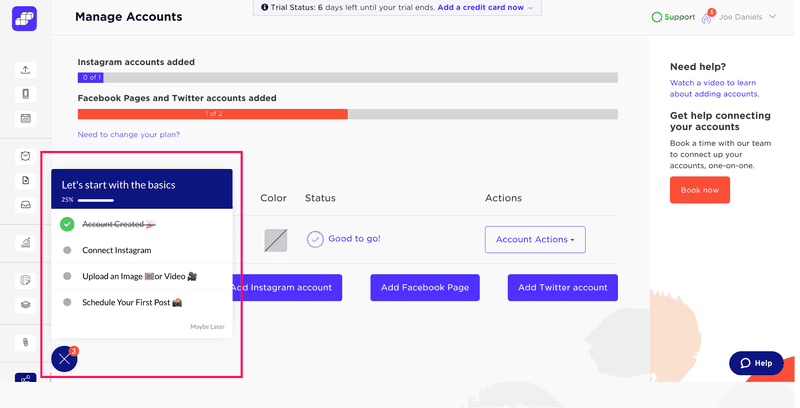
- Deploy onboarding checklists tied to meaningful actions: Checklists give users structure and a clear sense of progress. When paired with a progress bar, they create momentum that nudges users forward. This works particularly well when checklist items map to meaningful actions rather than generic setup tasks. Sked Social introduced a checklist using Userpilot, without writing custom code, and saw a threefold increase in conversion, simply by helping users reach value faster and with more clarity:
Phase 2: Adapt the experience as user intent becomes clearer
Once users reach initial value, they’ve revealed enough about what they care about that generic onboarding should be over. At this stage, growth no longer depends on speed alone. It depends on relevance. The goal shifts from helping users get started to helping them move in the right direction for their specific situation.
This is where behavioral data, tracked with a product analytics and engagement tool like Userpilot, becomes essential. Here’s how:
- Segment by intent, not just role: Two users with the same job title may want entirely different outcomes. One marketer might be focused on reporting, while another is trying to launch their first campaign. Use early signals like selected goals, first features used, or repeated actions to create intent-based segments. Users who immediately build analytics dashboards need different guidance than those spending time on integrations.
- Reduce cognitive load by surfacing the most relevant next action: SaaS users face dozens of features with no clear sense of priority. Instead of promoting everything at once, highlight the next step most likely to deepen adoption for each segment. Nudge a reporting-focused user toward scheduling their first automated report. Nudge a collaboration-focused user toward inviting teammates. Each nudge helps them realize more value, which drives engagement and retention.
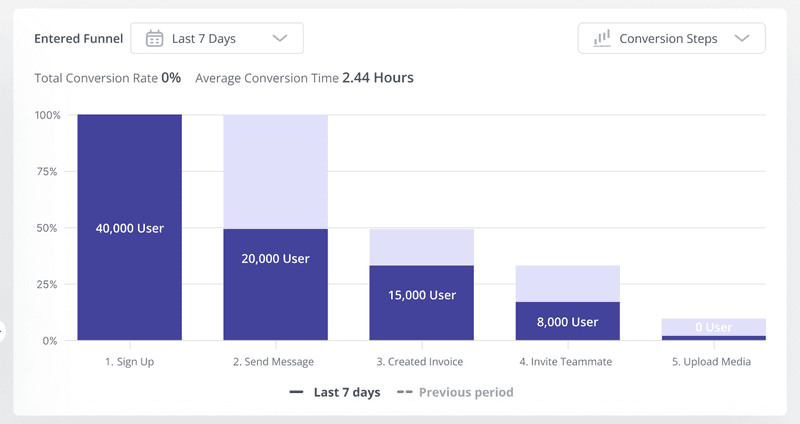
- Let usage patterns shape your product roadmap: Behavioral data shouldn’t stop at informing in-app messages. It should actively guide product decisions. Track user paths, feature adoption, and drop-off points to see where users slow down or abandon key workflows. If a funnel report shows that users create a project but never invite teammates, that’s a signal that collaboration value isn’t landing. The fix might be a change in flow, not more messaging.
Phase 3: Operationalize product-qualified leads
Product-qualified leads (PQLs) are users who’ve demonstrated value through behavior. They didn’t fill out a form. Their usage shows the product is doing real work for them.
The onboarding flows and contextual experiences from phases one and two will convert users to a point. But in most products, there’s a natural ceiling to self-serve. As usage deepens or spreads across a team, some users need reassurance, alignment, or help navigating internal buying processes. The advantage of a product-led motion is that sales engagement no longer depends on guesswork. I look for four signals to identify strong PQLs:
- Demographic fit: Start by filtering for accounts that resemble your ideal customer profile. Company size, industry, and use case still matter. Strong usage without ICP alignment often signals short-term engagement that rarely leads to durable revenue.
- Meaningful engagement: Look for behaviors that correlate with retention, not just initial activation. Repeated use of core features, consistent return sessions, or progression into advanced workflows all suggest the product is solving a real problem rather than being casually explored. Userpilot helps you filter engagement data by company or user profile so you can identify which accounts are consistently using high-value features and prioritize outreach based on real product adoption.
- Buying intent signals: Visiting the pricing page, hitting usage limits, attempting to unlock gated features, or inviting teammates all signal active evaluation and create natural openings for timely outreach.
- Expansion potential: Pay attention to how product usage spreads across teams. Multi-user engagement signals higher deal value and longer-term commitment. Invitations, shared assets, and cross-team activity usually indicate a purchase decision that will involve more stakeholders.
Phase 4: Automate growth loops and start making your product agent-accessible
Once users consistently reach value and signal intent through usage, the constraint becomes scale. In 2026, scale means building for both human self-serve and agent access.
- Design growth loops that expand usage naturally: Identify moments where users create output that has value beyond themselves, then make sharing feel useful rather than promotional. Canva lets users share designs for feedback or collaboration. Calendly turns scheduling into a shareable action that introduces the product every time someone sends a meeting link. Not all growth loops need to reach outside your customer’s organization: some deepen adoption within existing accounts through team invites, shared workspaces, and co-editing, increasing reliance and embedding the product in daily workflows.
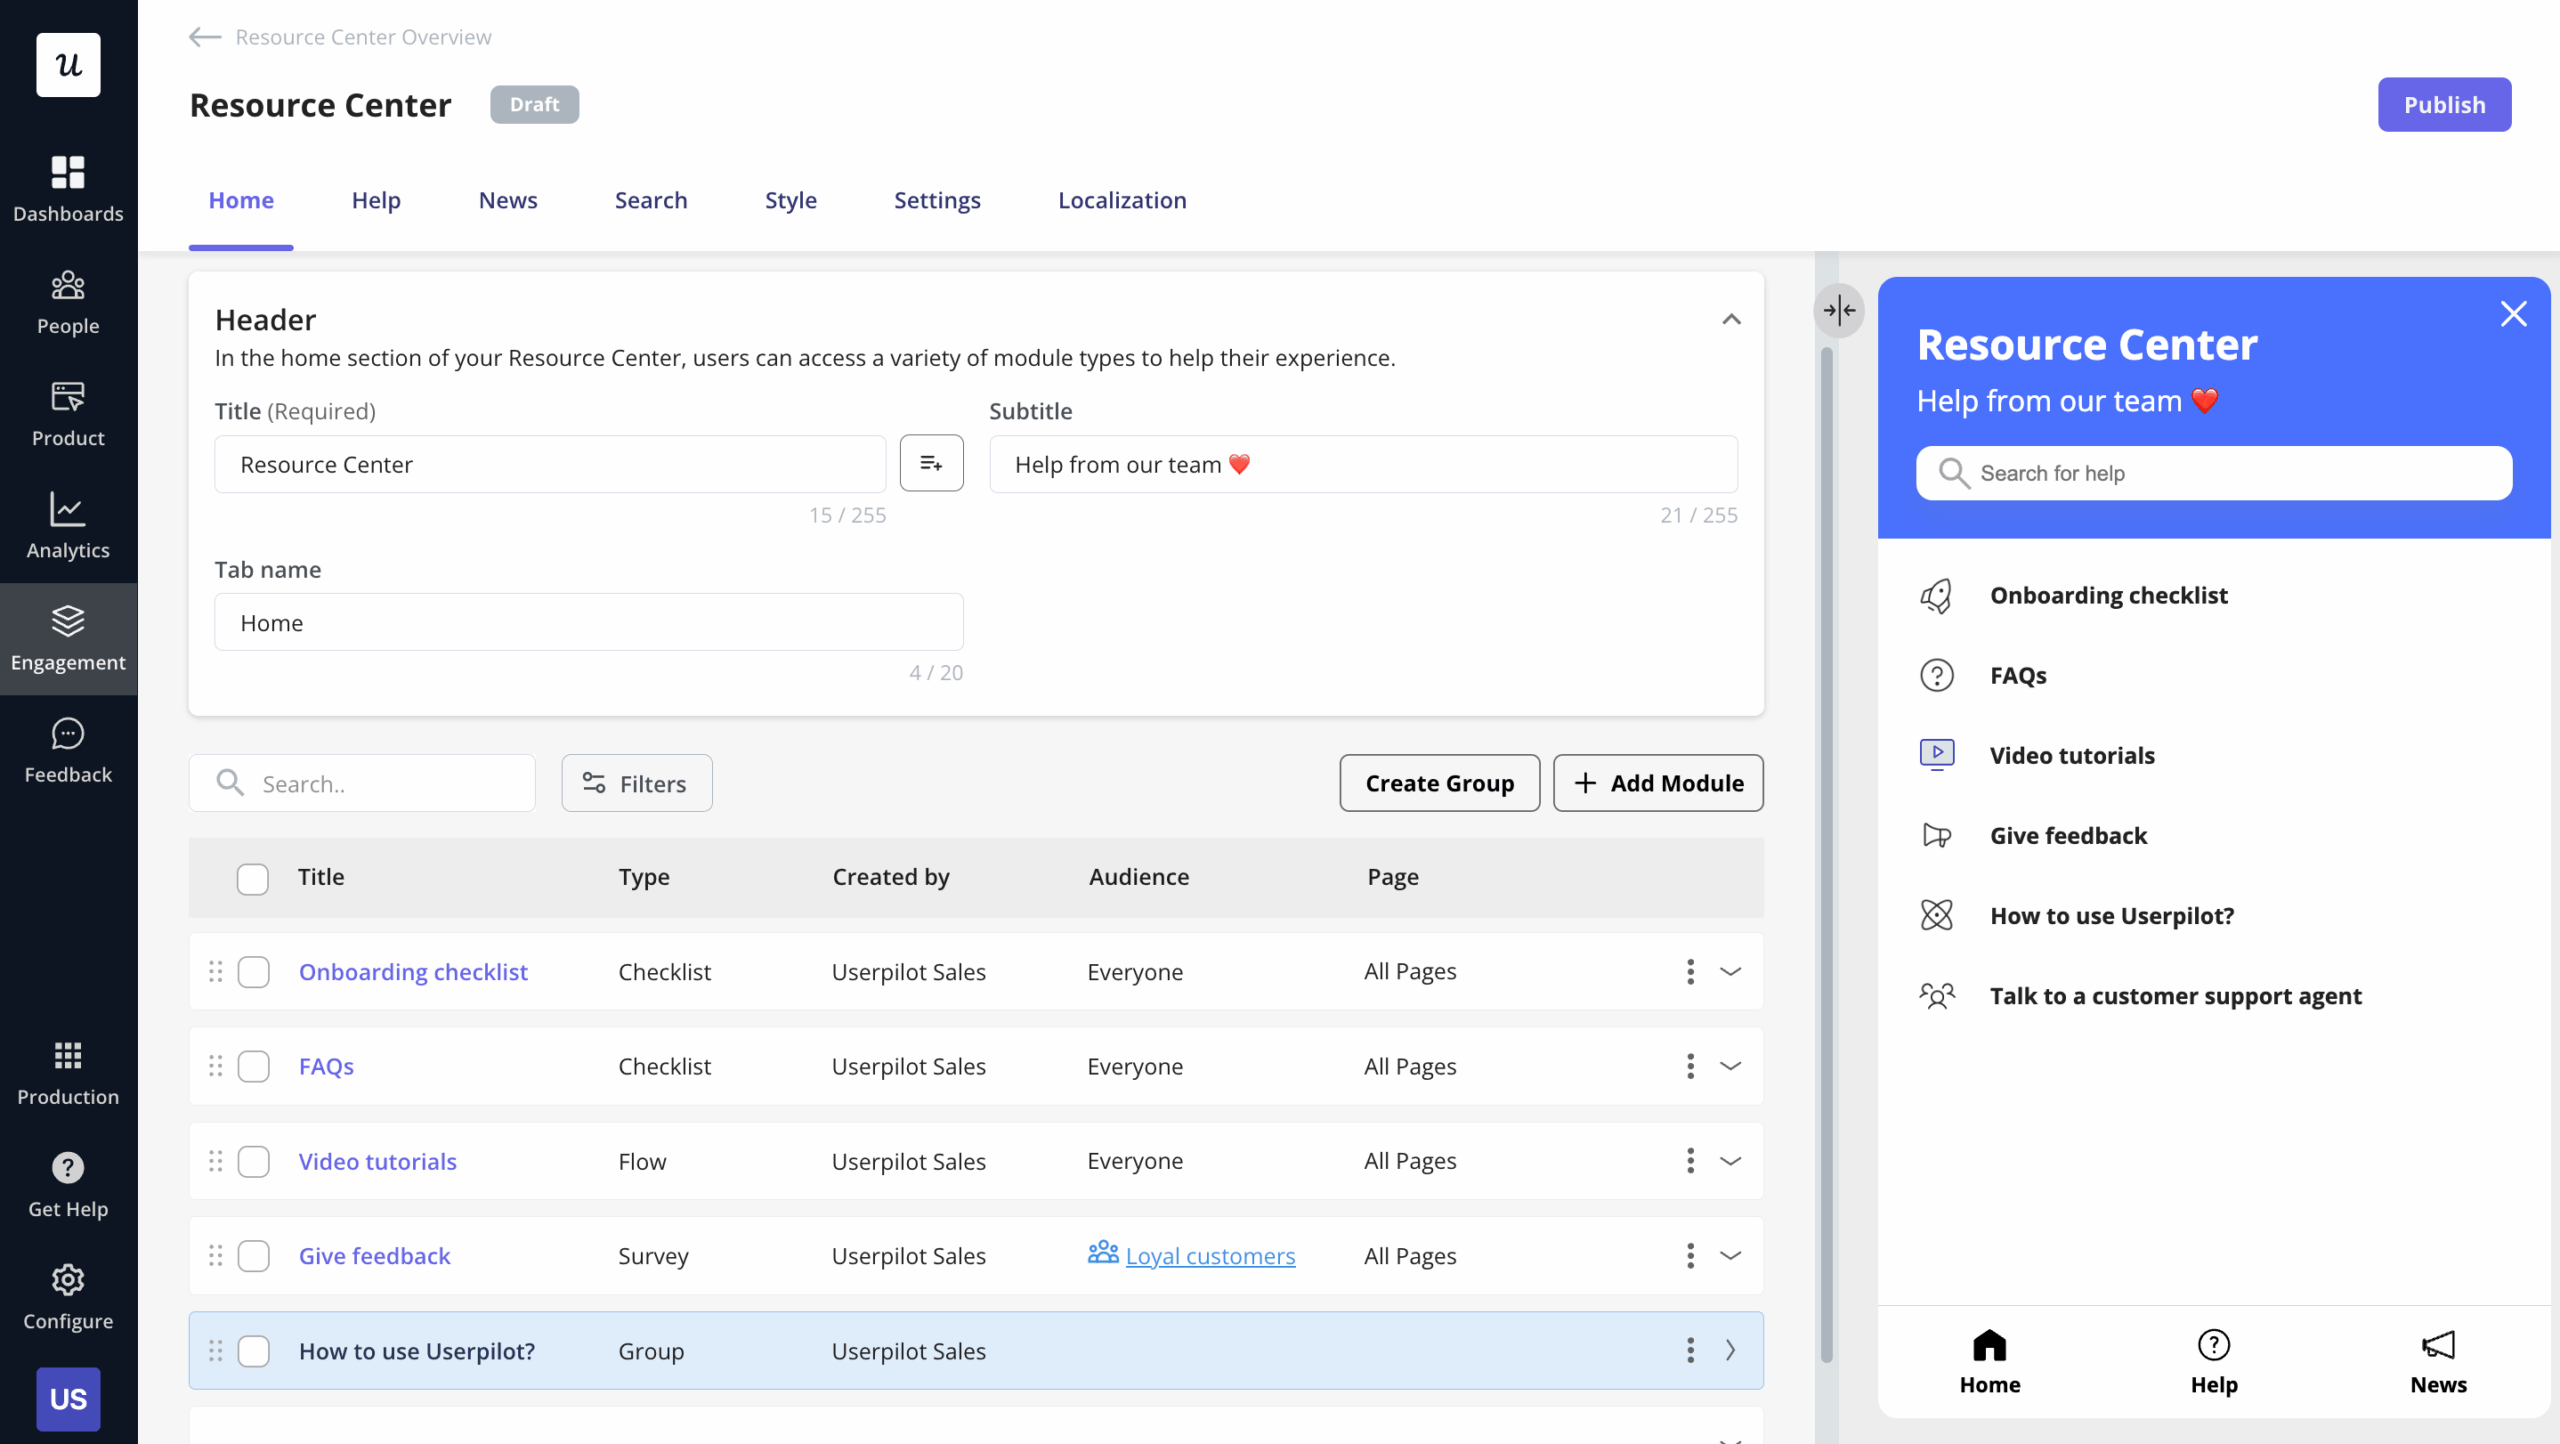
- Shift support from reactive to self-serve: Move help closer to where problems occur. Surface answers inside the product at the moment they’re needed: contextual tooltips, searchable documentation, short videos, and guided walkthroughs that can be triggered on demand. Userpilot lets you build in-app resource centers without code, centralizing help docs, FAQs, and video tutorials while keeping a clear escalation path when self-serve isn’t enough.
- Automate expansion paths: As usage grows, expansion shouldn’t depend on sales noticing it late or users figuring out what to do next. Build clear, predictable expansion paths directly into the product: visible usage limits, seat thresholds, feature gates, and plan comparisons that make the next step obvious at the moment it becomes relevant. When a team hits a collaboration limit, show how upgrading enables more seats. When they reach a usage threshold, explain what additional capacity unlocks. This reduces friction for users ready to expand and stops revenue growth from depending on ad hoc conversations.
- Start exposing your product via MCP: Read access to your core objects is table stakes. If an agent can’t list customers, pull a report, or read the state of a record, none of the interesting agentic use cases are accessible. Build the boring stuff first.
The road from PLG 1.0 to PLG 3.0: A realistic transition map
The headless-first future is real. The road there is longer and weirder than most take suggests. Here’s how the transition actually plays out, and where most companies sit today.
Phase 1: Where most companies are now: Agents work well for narrow, bounded tasks. The moment an agent has to infer intent from sparse context, it breaks. The vast majority of users are still humans who need well-designed products. Don’t let “headless is the future” become an excuse to ship worse UX today.
Phase 2: Interfaces go dynamic, not dark: Interfaces don’t disappear. They change. Instead of a dashboard waiting for a human to figure out what to do, the agent meets users where they already live and asks structured, purposeful questions: “What outcome are you trying to reach? By when? What constraints am I working with?” The interface becomes a conversation in the tool users already live in. Salesforce’s “the conversation is the interface” framing points exactly here.
Phase 3: Outcome-literate agents become the differentiator: The products that win won’t be the ones with the best APIs. Those commoditize fast. They’ll be the ones with the deepest subject-matter knowledge about how to get to outcomes, not outputs. Best-practice libraries, codified domain expertise, benchmarks from thousands of customers that tell an agent: companies like yours, at your stage, usually do X. That’s the moat Elena Verna describes and it’s genuinely hard to reproduce.
Phase 4: Mostly invisible B2B: Most B2B software becomes infrastructure. Users never log in. Agents query, execute, and report. Humans get the summary in Slack and approve with a thumbs up. The timeline for most companies: a few years at minimum. Consumer software lags even further because taste and identity don’t agentify easily.
The metrics that matter in PLG (and two that are starting to break)
There’s no shortage of metrics you can track in a product-led organization. The most useful ones focus on how quickly users reach value, how deeply they adopt the product, and whether that usage translates into durable revenue. Below are the six I rely on most, with an honest note at the end on where the agent era creates measurement gaps.
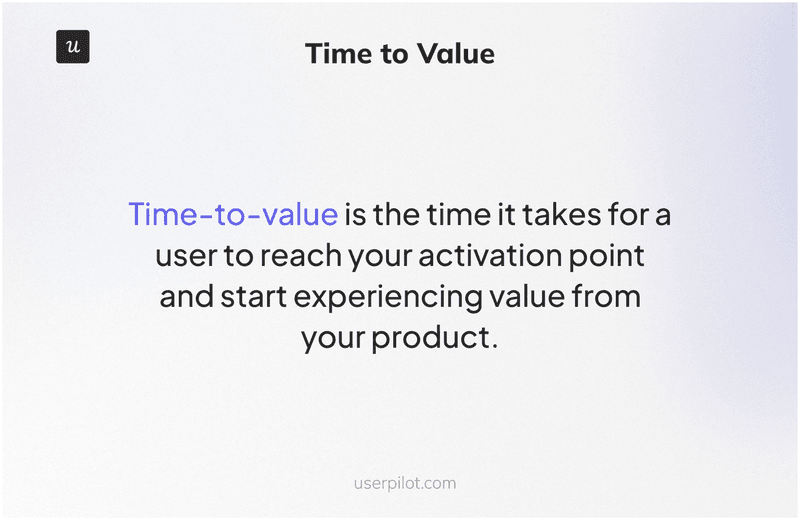
1. Time to value
Time to value measures how long it takes for a new user to experience their first meaningful outcome. When users reach value quickly, they’re more likely to build habits around the product and integrate it into daily workflows. When time to value is long or inconsistent, drop-off happens quietly, before users ever reach activation.
To measure it: define a clear first value event, a specific action that signals real benefit, such as publishing a first design, scheduling a first meeting, or generating an initial report. Then measure the gap between signup and that event. Benchmark against PLG 2.0 standards. If your time to value is measured in hours rather than seconds, that’s a structural vulnerability worth taking seriously.
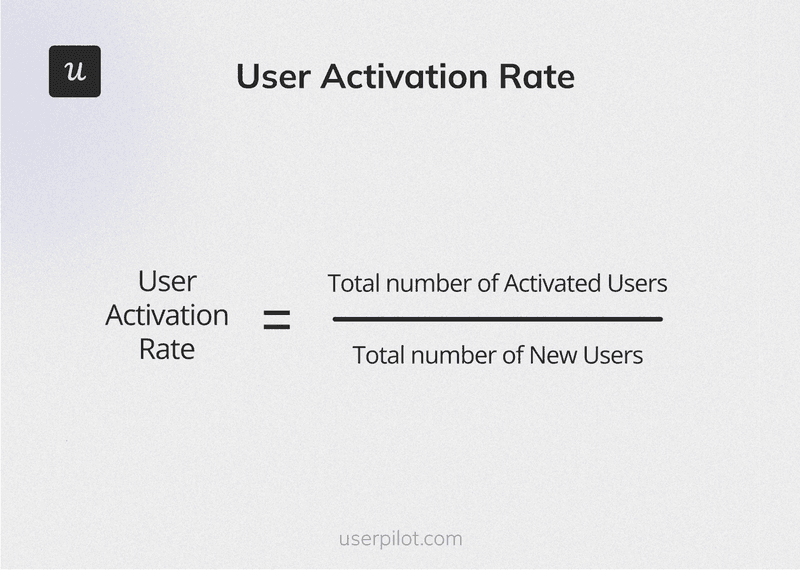
2. User activation rate
Time to value tells you when users find value. Activation rate tells you whether they find it at all. I define an activated user as someone who’s completed the actions that indicate they’ve moved from exploration into real use: creating multiple outputs, inviting teammates, or completing a first meaningful workflow.
Calculate it by dividing the number of users who reached your activation milestone by total signups in the same period, multiplied by one hundred.
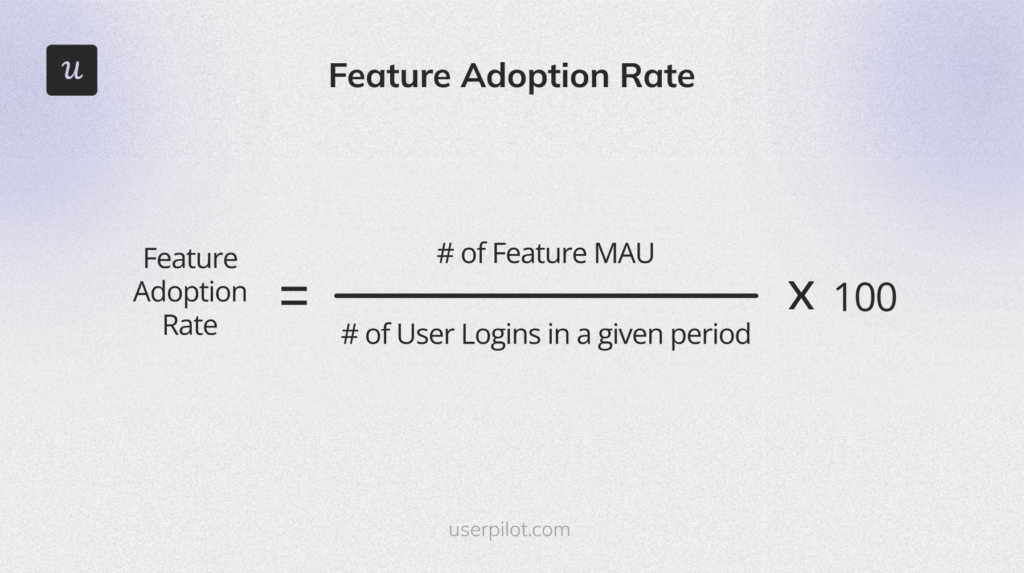
3. Feature adoption rate
Feature adoption rate shows how many existing users are actively using a specific feature relative to your overall active user base. In a PLG model, this tells you whether users are engaging with the parts of the product that actually drive value, not just logging in and clicking around.
Choose a specific feature, identify how many active users interacted with it during a given period, divide by total active users in the same period, and multiply by one hundred.
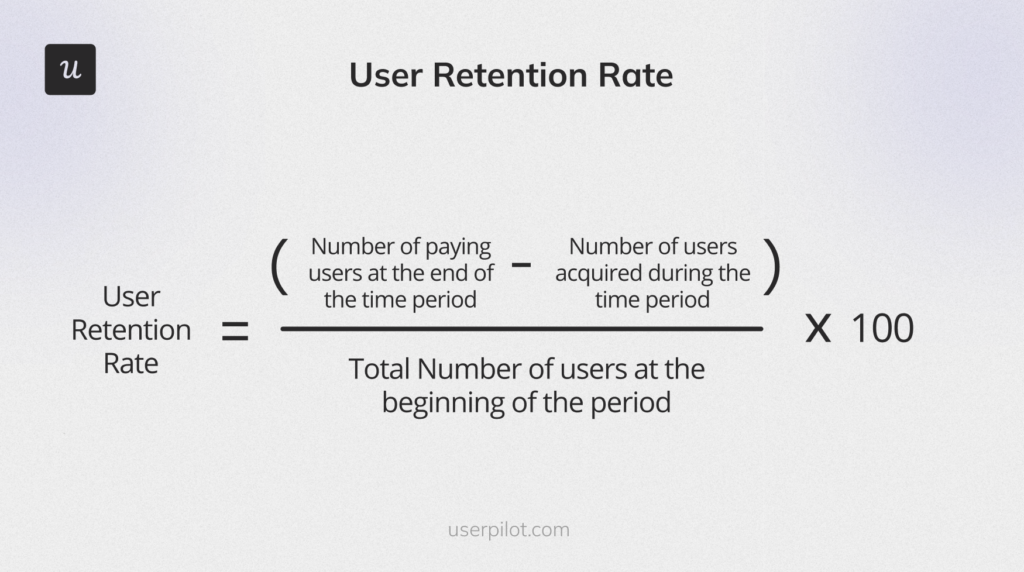
4. User retention rate
User retention rate reveals whether usage is becoming habitual. Strong retention means users rely on the product to do their work. Weak retention points to gaps in feature adoption, unclear value after onboarding, or friction that only surfaces after repeated use.
To measure it: choose a time period, subtract new users acquired during that period from total users at the end, divide by users at the start, and multiply by one hundred.
5. Free-to-paid conversion rate
This is your reality check: are users realizing enough value to justify paying, without heavy persuasion or incentives? Divide the number of users who became paid customers by total trial or free users in the same period, then multiply by one hundred.
6. Average revenue per user
ARPU gives you a view of customer lifetime value trends and expansion effectiveness. When it increases over time, it reflects deeper adoption, successful upsells, or broader usage across teams. When it stagnates or declines, it signals pricing misalignment, weak expansion paths, or a product delivering value it isn’t capturing. Calculate it by dividing total monthly recurring revenue by the number of active customers for that same month.
Turn product usage into sustainable growth: For humans today, agents tomorrow
Product-led growth works when it’s treated as a connected system rather than a set of tactics layered onto an existing business model. It starts with enabling users to reach value quickly, continues by keeping the experience relevant as intent becomes clearer, and scales through usage signals, expansion paths, and self-serve systems that reduce friction over time.
The companies that navigate the PLG transition successfully won’t be the ones that chose between humans and agents. They’ll be the ones that built lovable human journeys now and agent-accessible systems next, and used the data from the former to power the latter.
Userpilot is built to support teams across each stage of that system. From welcome surveys that capture user intent at signup, to interactive onboarding flows that shorten time to value, to segmentation and analytics that surface meaningful usage patterns, to Workflows, our visual canvas for orchestrating multi-step user journeys across in-app experiences and email. It’s built for the transition period: the long, valuable stretch where humans are still driving and where the teams designing great experiences for them will be best positioned when agents eventually take over.
Ready to see it in action? Book a demo and we’ll show you how teams are building the kind of journeys agents will eventually orchestrate, but humans are still driving today.
About the author