
HubSpot customer journey analytics can help product managers tap into the pulse of their target customers.
You can understand their journey, gain insights to improve their experience and connect your customer experience efforts to desired financial outcomes.
This article discusses how the HubSpot customer journey analytics reporting tool can help you attract customers and accurately walk them through every step of the customer journey.
Try Userpilot Now
See Why 1,000+ Teams Choose Userpilot

Summary of HubSpot customer journey analytics
- HubSpot customer journey analytics is a powerful data-led tool that drives improved decision-making and conversions.
- Benefits of the customer journey analytics tool include unifying your data, creating a path for revenue generation, and optimizing your marketing investments.
- HubSpot has a robust pricing model with five major plans for analytics: Marketing Hub, Sales Hub, Service Hub, Operations Hub, and CMS Hub.
- Userpilot integrates with HubSpot to help you better analyze customer data and make data-driven decisions.
Is your HubSpot customer journey map truly driving revenue?
Connecting every touchpoint to revenue is complex. Take this 4-step assessment to see if you’re getting the most out of HubSpot customer journey analytics.
Overview of HubSpot customer journey analytics
Customer journey analytics from HubSpot is a powerful reporting tool that aggregates all the interactions a contact has with your business. It makes sense for marketers who want to unlock valuable insights, ensure better decision-making, and drive conversions.
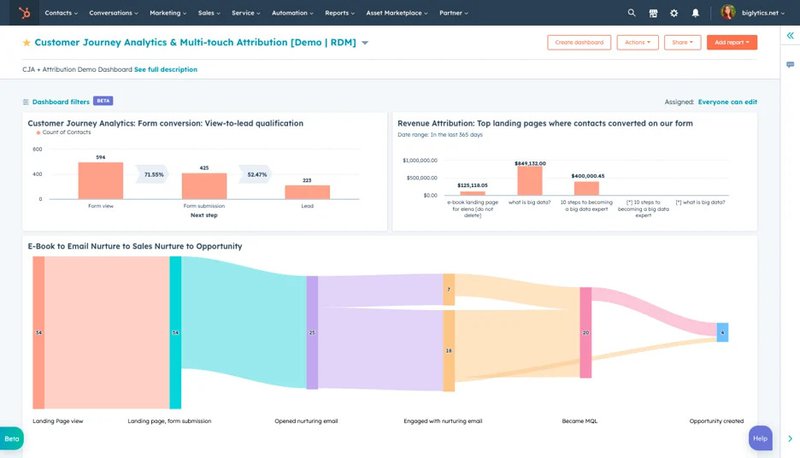
The benefits of using HubSpot Marketing Hub for customer journey analytics
- Connect every customer interaction to revenue: You can visualize the impact of your email marketing campaigns, social media campaigns, and other marketing efforts with the customer journey analytics reporting tool. By connecting your marketing and sales efforts, you can focus your budget on activities that yield the biggest impact.
- Analyze conversion rates and time between steps: Analyzing conversion rates and time between touchpoints will help you understand what works and what doesn’t. This way, you can improve your strategies and build a more robust customer journey pipeline.
- Create an ideal customer journey that drives revenue: You can create optional touchpoints since all customers do not follow the same journey to conversion. Acknowledging the multiple paths customers can take can help you create a customer journey that drives revenue.
- Optimize your marketing investments: With the customer journey analytics feature on HubSpot, you can optimize your campaigns and make smarter budgeting decisions.
- Unify your data to deliver better customer experiences: You can combine data using the flexible and customizable HubSpot marketing dashboards to see the initiatives that yield the best results for your business.
How to create a customer journey analytics report in HubSpot
Note: The following limits apply when creating customer journey analytics reports on HubSpot:
- HubSpot lets you add up to 15 stages and up to 15 unique steps. For instance, you can add 15 stages and set one step per stage or five steps in the first stage, second stage, and third stage to achieve a total of 15 stages.
- You can analyze spanning a period of three years or up to twenty million events. If your report is configured when there are over twenty million events, the date range window will be reduced to a single month.
Here are six steps to creating a journey report that can help you understand the impact of every interaction with your business:
Step 1: Create a journey report
- Navigate to Reporting > Reports in your HubSpot account.
- In the upper right corner, click Create Report.
- From the Create Report section, go to the Build from Scratch tab and click Customer Journey Reports.
Step 2: Select a data source:
When creating a journey report, you can choose from two data sources:
- Contacts (available on Marketing Hub Enterprise only): select Contacts to get insights on how your content is creating new contacts.
- Deals (available on Sales Hub Enterprise only): select Deals to get insights on how your content is creating new deal opportunities.
Step 3: Add the steps in the customer’s journey report
- In the left corner, you will find different steps, such as Emails bounced, Emails delivered, Opened emails, etc.
- Click and drag the steps to the Stage section. You can add up to 15 steps leading to a goal or conversion.
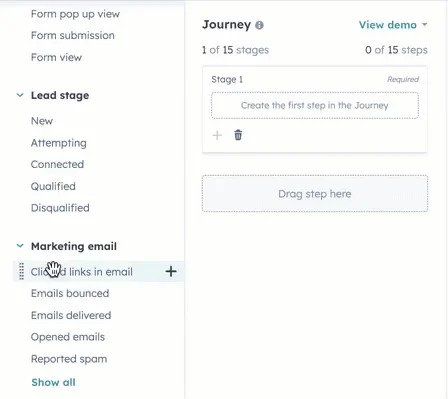
Step 4: Filter the selected properties
- Click the filter icon > Select property > Apply to configure your step.
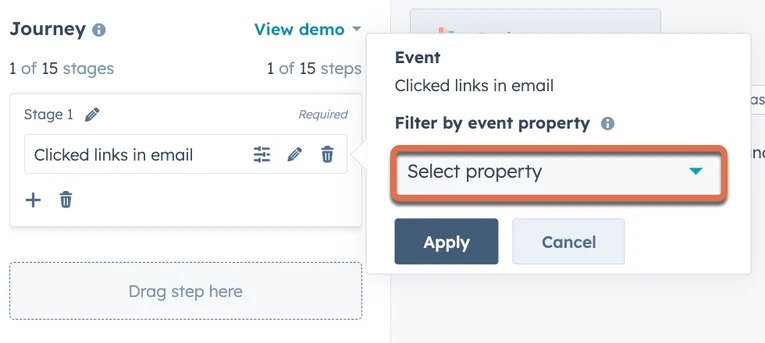
Step 5: Configure your journey reports with branches or optional steps
- To further customize your journey report, you can add branches or make steps optional.
- Add branches by clicking and dragging a Step to the Create a branch section. This will create two paths within a stage to allow a contact to complete either path in the stage.
- To mark a step as optional, select Mark as optional. This will mean that a contact must not go through that step to complete the journey. Any contact that makes it to the last step of the journey will be part of the total conversion rate.
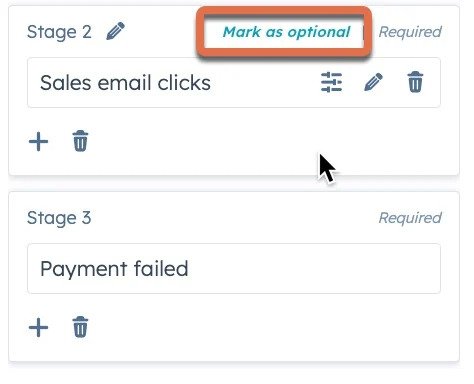
Step 6: Run the report to display your data
- Click Run Report once you are done configuring your journey. This will have your data displayed on the right panel, then filter your data with the filter icon at the top of the panel.
- You can view your data by Contacts, Deals, and Date Range.
Save your customer journey reports
Click Save Report in the top right corner.
Set the access permissions for the report, then click Save.
What common properties can you use in your contact customer journey analytics reports?
Let us discuss some of the most common properties you can use in your contact customer journey analytics reports.
Ads and Campaigns
- Ad campaign ID: populates the advertising campaign linked to the ad interaction.
- Ad network: populates the network where the interaction took place, such as Linkedin, Facebook, and Google.
- Interaction type: populates the type of interaction that occurred. This may include a form submission or a website visit.
- Network placement: populates the different advertising deployment methods, such as Google Display Network and Facebook Messenger.
- Campaign ID: populates the campaign linked to the interaction.
CTAs and Deals
- Content ID: populates the content pages containing the call-to-action (CTA). For instance, the dropdown menu will show the names of specific blogs or landing pages where the CTA is.
- CTA guide: populates the name of the call-to-action (CTA).
- Deal stages: populates deal stage information from any of your pipelines.
Forms
- Content ID: populates content pages containing the form placement. For instance, the dropdown menu will show the names of specific blog posts or landing pages where a form is embedded.
- Form ID: populates the name of a form.
Marketing emails and marketing events
- Event name: filter based on the specific name of the webinar. This enables you to identify which events are attracting the most interest, providing insights into the types of content you should prioritize for future creation.
- Origin: allows you to filter by either Online or in-person.
- Business units: allows you to filter business units in your account.
- Email content ID: allows you to filter by the unique marketing email name.
- Original URL: the URL clicked by a contact in your email.
Sequences and web pages
- Enrolled by user: populates the different users within your HubSpot account who are using it to engage with prospects.
- Sequence ID: populates unique sequences in your HubSpot account that representatives can use for nurturing prospects. Every time a user enrolls a prospect into a new sequence, a unique sequence ID is generated.
- Template ID: populates the template names in your HubSpot account for users to nurture prospects.
- Content ID: allows for direct comparison between blog posts, landing pages, etc. As a result, you can determine if a particular content appeals to your website visitors.
Advanced tracking code properties
- Browser: allows filtering based on a particular browser, such as Google Chrome, Firefox, etc. You can use the Traffic Analytics tool to access and analyze this data.
- Content type: you can choose a specific website type. For example, you can select between blog posts, website pages, landing pages, etc.
- Country: allows you to filter based on specific countries using country codes as defined by the International Organization for Standardization. For instance, ‘CA’ would filter web traffic from Canada while ‘GB’ would filter web traffic from the United Kingdom.
- Device type: allows filtering based on the device a visitor uses when they engage with your brand. For example, you can filter using ‘mobile’ or ‘desktop’.
- Region: allows filtering based on a country’s subdivision. For example, ‘ID-RI’ would filter web traffic from the Riau province of Indonesia while ‘TN’ would filter web traffic from Tennessee in America.
How much does HubSpot’s customer journey analytics reporting tool cost?
HubSpot offers five pricing plans to help you understand customer behavior and attract the right customers: Marketing Hub, Sales Hub, Service Hub, Operations Hub, and CMS Hub.
Marketing Hub Starter, Professional
The Marketing Hub Starter plan is priced at $20 per month ($18 monthly for annual subscriptions) for 1,000 leads. HubSpot customers on the Starter plan have access to A/B testing, ad conversion events, campaign management, and more.
Marketing Hub Professional is priced at $800 monthly for the first 2,000 leads. It offers everything in the Starter, plus lead scoring, Salesforce integration, and custom lead scoring criteria.
Sales Hub Starter, Professional
The Sales Hub Starter plan starts at $20 monthly ($18 monthly for annual subscriptions) for two users. Some of its features include sale automation, product library, meeting scheduling, and standard CRM interface configuration.
The Sales Hub Professional tier is priced at $360 per month and allows up to 5 paid users. It includes features such as advanced lead management tools, automation workflows, and email tracking.
Service Hub Starter, Professional, Enterprise
The Service Hub Starter tier is priced at $20 monthly ($18 monthly for annual subscriptions) for 1,000 contacts. Its features include basic feedback collection and ticket creation/routing.
The Professional tier is available at $360 per month and allows up to 15,000 contacts. It offers advanced contact management features, advanced ticketing features, and customer feedback surveys.
Service Hub Enterprise plan is available at $1200 monthly and gives users unlimited contacts. Its features include advanced reporting and analytics, multi-brand support, and customer experience management.
Operations Hub Starter, Professional, Enterprise
The Operations Hub Starter tier is priced at $18 per month and allows integration of up to 20 external systems. Its features include custom reports and basic dashboard metrics.
Operations Hub Professional is available at $720 per month. It offers more robust reporting features such as advanced metrics, custom dashboards, and cross-object reporting.
The Operations Hub Enterprise plan is priced at $2,000 per month and offers the most advanced reporting features. They include machine learning, predictive analytics, and multi-dimensional reporting.
CMS Hub Professional, Enterprise
The CMS Hub Professional tier is priced at $360 per month. It offers features such as 10,000 website pages, custom web traffic analytics, 30 reports per dashboard, and 25 dashboards.
CMS Hub Enterprise is available at $1200 per month. It includes features like 10,000 web pages, custom web traffic analytics, 30 reports per dashboard, and 50 dashboards.
Note: HubSpot also lets you define and track information or events unique to your business with the custom behavioral events feature. This lets you make data-backed decisions that drive growth and revenue. However, this feature is only available on the Marketing Hub Enterprise plan.
How to leverage Userpilot and HubSpot to better analyze customer journeys
The Userpilot-HubSpot integration ensures seamless data transfer between two powerful products that can drive your product marketing. Basically, you can source customer data from HubSpot and use the Userpilot platform to gather customer feedback, analyze customer behavior, and drive engagement.
Here are two ways you can leverage the complementary functionality of Userpilot and HubSpot:
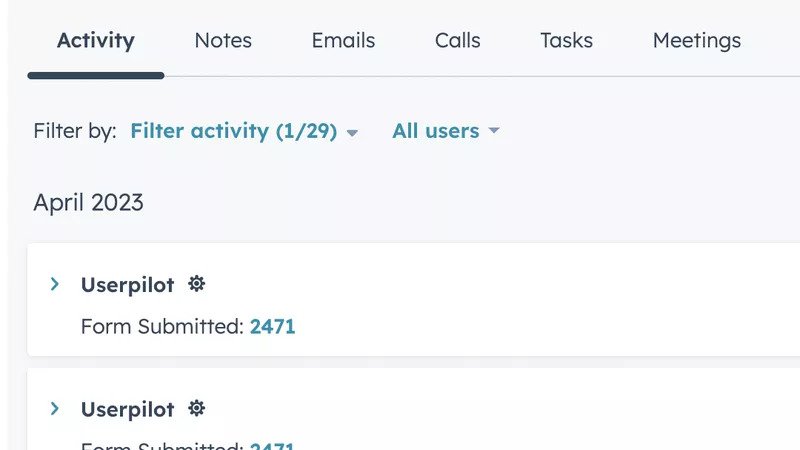
Monitor in-app activity data in HubSpot for better decision-making
With the 2-way integration, HubSpot users take advantage of Userpilot’s powerful analytics functionality to pull valuable insights. The in-app data will help you understand your customers and make data-driven decisions.
With Userpilot, you can:
- Monitor feature usage (clicks, hovers, text infills).
- Track events, including custom ones.
- Track engagement with checklists, surveys, and resource center modules.
Create custom HubSpot reports and dashboards for performance tracking
The Userpilot-HubSpot integration lets HubSpot customers improve the quality of their custom reports with product and user behavior data from Userpilot. This data provides a complete picture of the needs and preferences of your customers.
Userpilot users can easily visualize their data and communicate findings to stakeholders.
Conclusion
From learning about your brand to purchasing a product or service, to even recommending it to someone, your customers go through an entire journey.
The customer journey analytics tool from HubSpot provides a deep understanding of your customer journey so you can build a customer experience strategy that delivers results.
Get a demo to see how you can take your customer experience strategy to the next level.


