Product Launch Analytics in 2026: Key Metrics and How to Track Them


The faster your team ships, the more product launch analytics matters. SaaS product teams used to release features once a quarter; now many ship weekly updates, incremental improvements, and AI-assisted functionality. Each new release needs measurement, and the measurement work compounds with every launch.
Userpilot CEO Yazan Sehwail captured this problem directly:
“As producing and building features become a lot cheaper, instead of every quarter, you’re releasing one or two features, now you’re releasing 7, 8, 9. It becomes even harder for product teams to manually have to track each one and understand usage for each one.”
This guide covers the eight steps that make product launch measurement reliable: SMART goals before launch, behavioral analytics and dashboards during it, and feedback loops that drive iteration after it. Each step includes specific tools and report types you can set up today.
Quick version
- Define launch goals: SMART objectives set before launch give you something to measure against. Without them, you have data but no signal.
- Pick the right KPIs: Match metrics to each launch phase. Pre-launch: sign-ups, beta scores. During launch: activation rate, time to value, adoption rate. Post-launch: retention, engagement score, NPS, and CAC.
- Choose your analytics tools: Hotjar covers MVP testing pre-launch; Userpilot handles behavior tracking, in-app surveys, and post-launch iteration in one platform; Amplitude goes deep on post-launch user journeys.
- Build real-time dashboards: Set up dashboards for product usage, new user activation, core feature engagement, and retention before launch day so you have a daily read from day one.
- Segment your users: One aggregate metric hides what’s actually happening. Segment by behavior and attributes to identify power users and at-risk cohorts separately.
- Run analytics reports: Trend, funnel, retention, and path reports each answer a different question about post-launch behavior. Run all four.
- Add qualitative feedback: Numbers show you where users drop off. Onboarding surveys, NPS, and post-launch surveys show you why.
- Iterate continuously: A launch is the start of a measurement cycle, not the end. AI-assisted tools like Lia can surface problems the day they emerge, not when you remember to check.

Product launch analytics: A step-by-step guide
Marketing and sales tactics can only do so much for a successful SaaS product launch. If you want your product to find its footing in the long run, consider the following steps.
Step 1: Define your product launch goals
Bringing a product to market isn’t just about building and marketing features. You also need to ensure that your product launch plan yields the results you’re aiming for and moves the business in the right direction.
That’s why product managers need to establish specific product goals before a feature hits users. Goals give your measurement plan something to measure against; without them, you’ll have data but no way to interpret it.
Use the SMART goal-setting framework to set objectives that are specific, measurable, achievable, relevant, and time-bound. Setting SMART goals helps you define clear objectives that align with business outcomes and give every team member the same definition of success. A team launching a new project management tool might target 1,000 sign-ups in the first month, a specific activation rate, and a 30-day retention threshold to confirm users found real value.
Step 2: Identify the right metrics and KPIs to track
Once you’ve set your goals, choose the KPIs that will tell you whether you’ve hit them. KPIs are measurable metrics that track progress toward specific launch milestones and indicate whether your overall strategy is working.
Select specific product KPIs for different launch stages:
Pre-launch metrics
- Number of sign-ups: The number of new users who sign up to receive updates or get early access before the public launch.
- Beta testing feedback scores: These scores show how well your product fulfills user needs and help identify friction points before you’re in front of your full audience.
Launch metrics
- Activation rate: The percentage of new sign-ups who take a desired action and reach the user activation point. This is the most direct early indicator of whether users understand and can use what you’ve shipped.
- Time to value: The time it takes for new users to reach their “Aha moment” and experience the first meaningful benefit of your product. Shorter time to value is consistently associated with higher long-term retention.
- Product adoption rate: The share of customers using your product to accomplish their core goals. Feature adoption rate specifically combines user interaction with a feature and the frequency of return visits, which tells you whether the feature is a must-have or a nice-to-have.
Post-launch metrics
- User retention: The percentage of users who continue using your product over a given period. Retention is the most honest measure of whether your launch delivered lasting value.
- Product engagement score: A composite metric that aggregates multiple interaction signals into a single number for fast triage. Product health scores like this are useful for surfacing accounts that look fine in raw usage data but are actually disengaging.
- Net Promoter Score (NPS): An indicator of how many users would recommend your product to others, and a reliable proxy for long-term retention.
- Customer acquisition cost (CAC): The total cost of acquiring a new customer, including marketing and sales spend. Tracking CAC during and after launch helps you evaluate the efficiency of your customer marketing strategy and tie launch investment to actual business returns.
Step 3: Choose the right analytics tools to track metrics
Product analytics tools provide in-depth insights into user behavior and product usage. The right tool depends on which launch phase you’re in and what questions you’re trying to answer.
Hotjar: Best for pre-launch
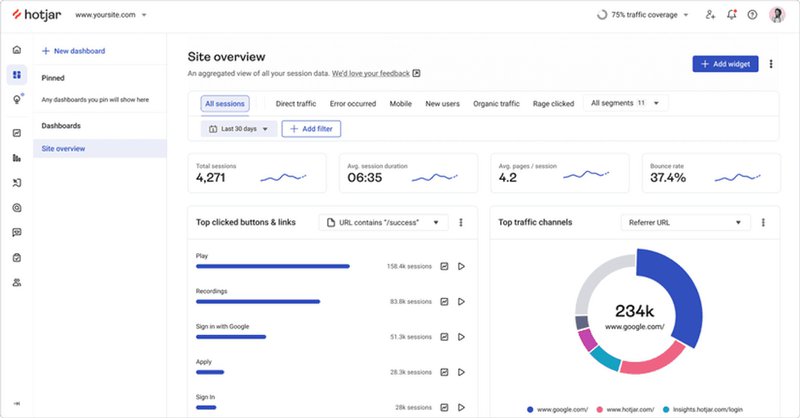
With heatmaps and session recordings, Hotjar gives you a clear view of how users navigate an MVP. You can run A/B tests to understand how users react to variations in the product experience before committing to a final build.
Userpilot: Best for behavior tracking during launch
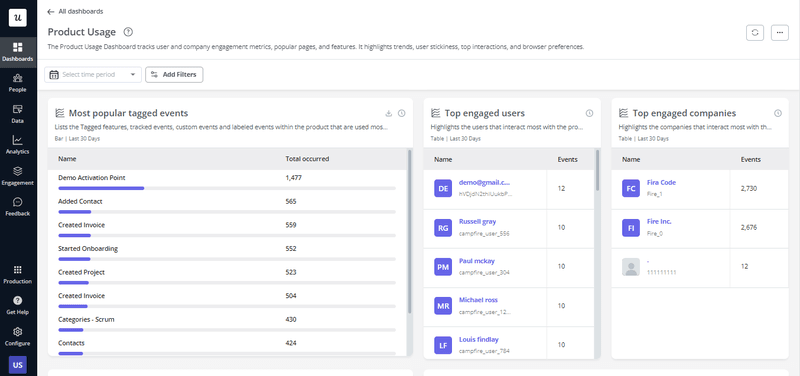
As an all-in-one product growth platform, Userpilot tracks in-app user interactions with auto-capture, session recordings, conversion funnels, and in-app surveys in one place. The key difference from standalone analytics tools: you can act on what you find without switching platforms. Lia, Userpilot’s AI agent, also monitors your key metrics continuously and flags where users get stuck, so your team doesn’t have to wait for a weekly review to catch a problem.
Amplitude: Best for post-launch
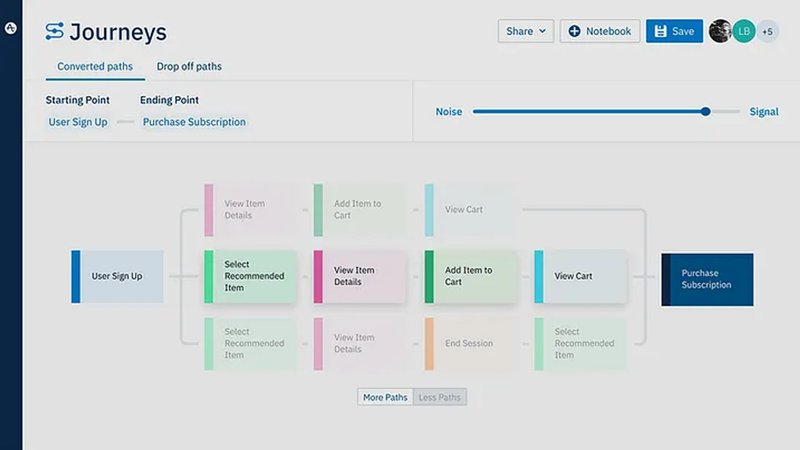
Amplitude offers cross-platform tracking and real-time analytics for deep user journey analysis. The platform’s automated reports and instant data visualizations help you decode user actions and behavior patterns across cohorts after launch.
Step 4: Visualize your analytics metrics with real-time dashboards
For a clear, fast view of your product launch performance, set up analytics dashboards before launch day, not after. Depending on your goals and launch phase, use your analytics platform or a dashboard reporting tool to build custom dashboards like these:
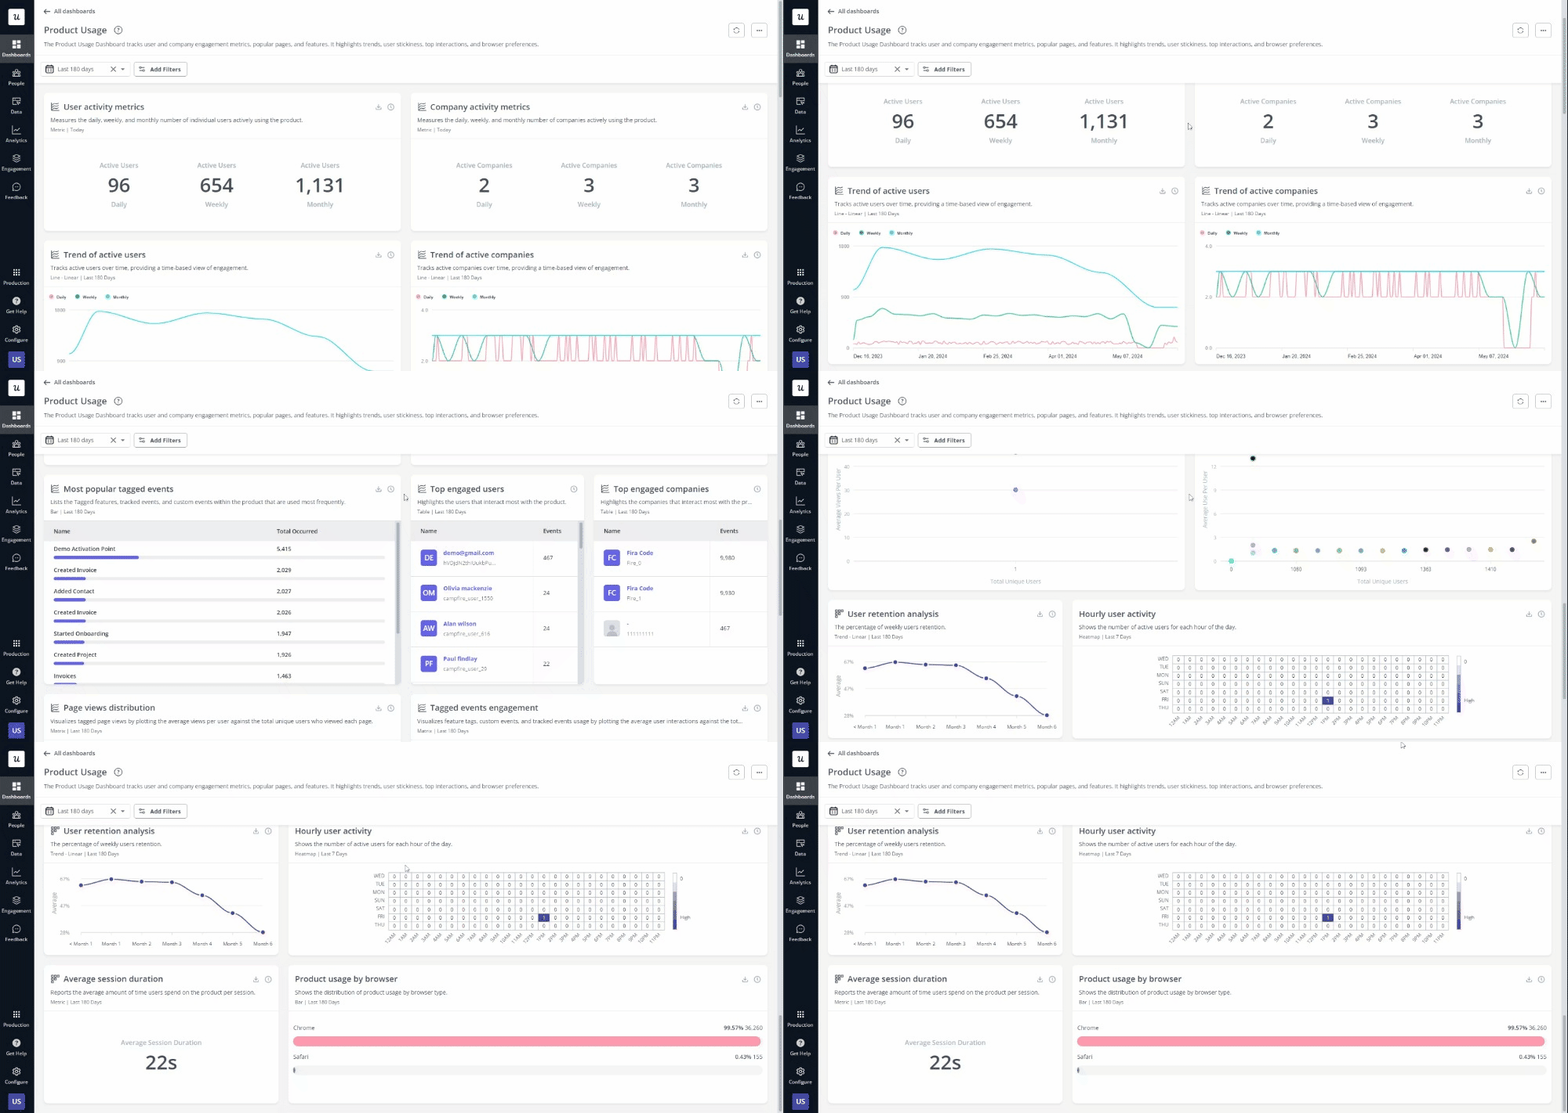
- Product usage dashboard: Track average session duration and stickiness to monitor in-app engagement day over day.
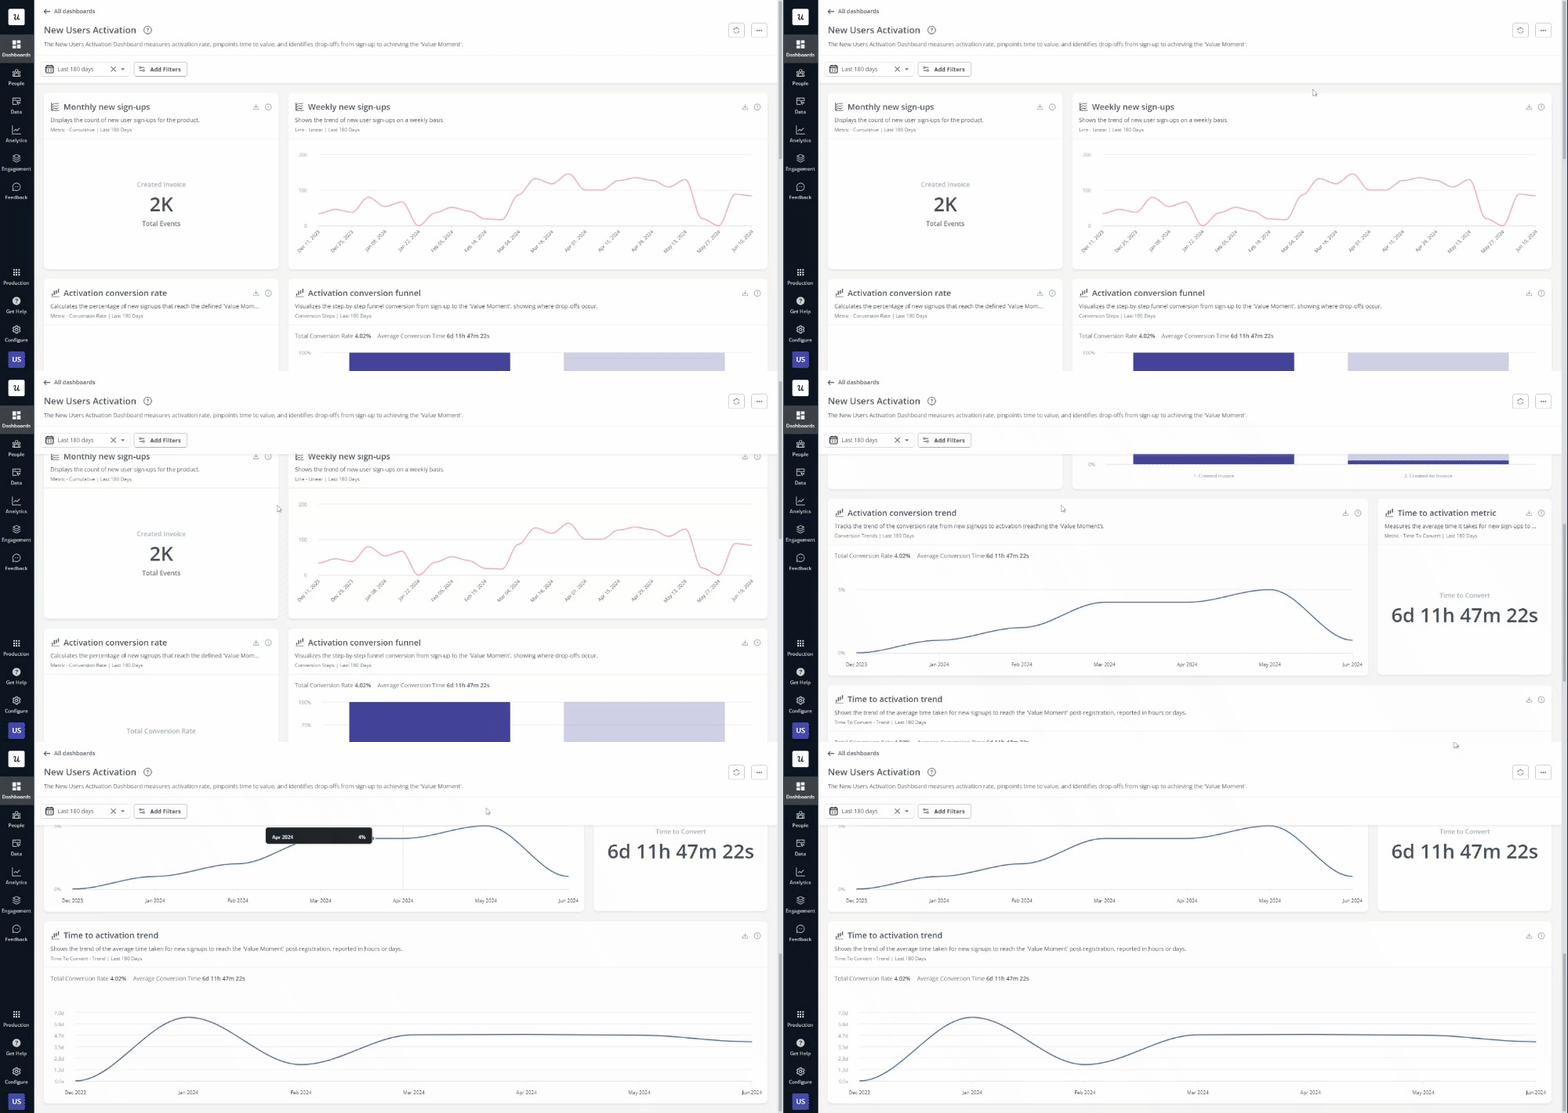
- New user activation dashboard: Monitor new sign-ups and conversion rates to track how quickly users reach their activation point after launch.
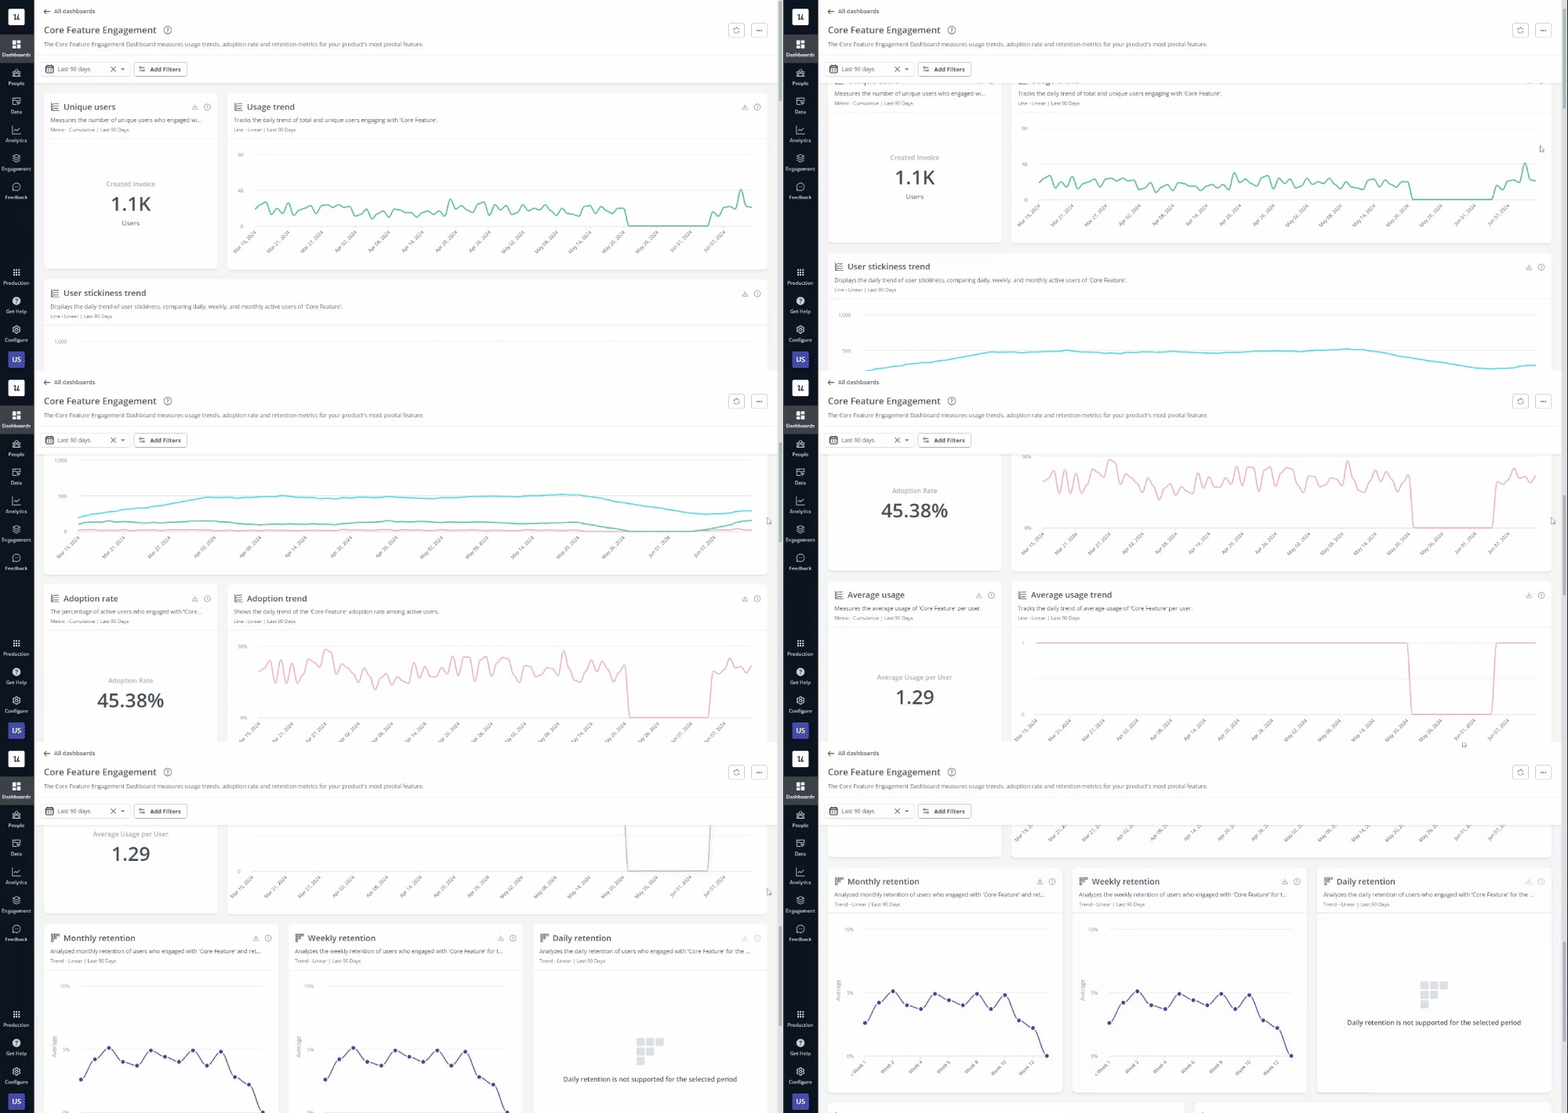
- Core feature engagement dashboard: Track new feature usage and adoption to see how customers are interacting with what you just shipped.
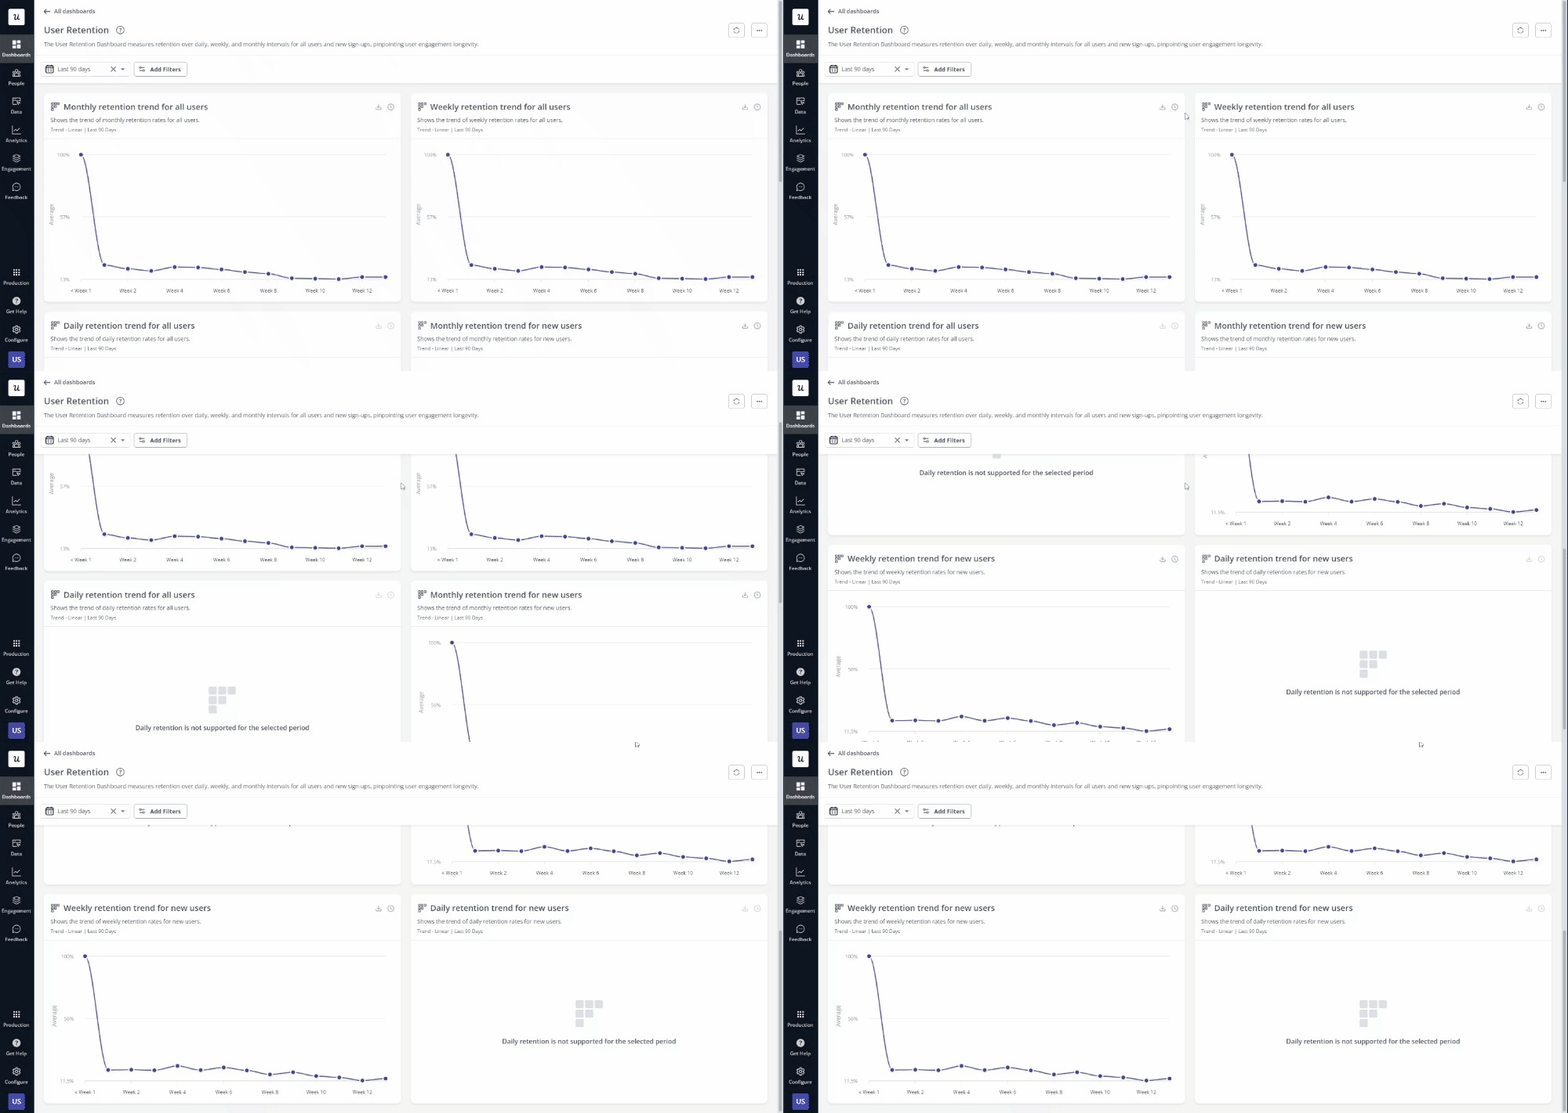
- User retention dashboard: Watch retention trends for different segments and time periods. Set alerts when a cohort drops below your threshold so you catch problems early rather than in a post-mortem.
Step 5: Analyze the behavior of different user segments
A single aggregate metric for your whole user base will mislead you. For your product to meet and exceed user expectations, you need to deliver personalized experiences, and that starts with user segmentation.
Divide your user base into segments based on shared attributes, demographics, and survey responses. You can use user behavior tracking to segment by in-app activity during the launch or by how different user groups engage with new features, which is useful for distinguishing users who found immediate value from those who signed up and went quiet.
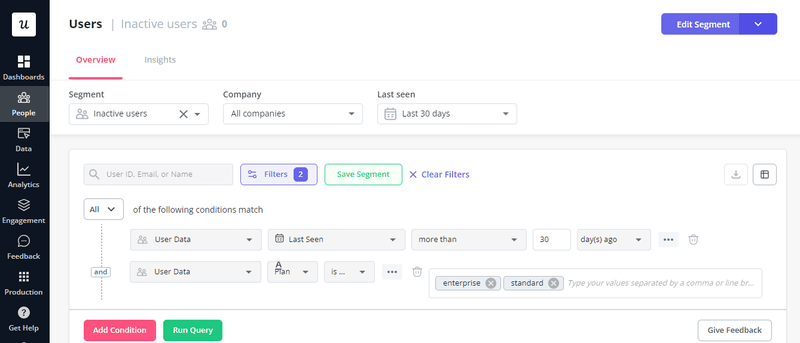
Analyze each segment’s in-app activity to identify power users and build customer retention strategies around what they do. For your least engaged segments, decide whether to re-engage them or reassess whether they fit your product-market fit.
Step 6: Understand product usage with analytics reports
Regardless of which analytics tool you pick, these four reports give you the clearest picture of how users interact with your product after launch. Each one answers a different question; run all four.
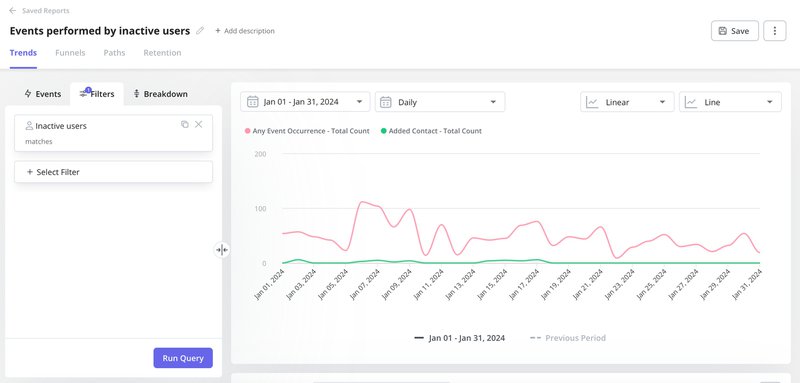
- Trend report: Monitor relevant user events and identify recurring patterns in behavior. You might spot that feature usage spikes on specific days of the week, or that a segment that activated in week one goes quiet in week three.
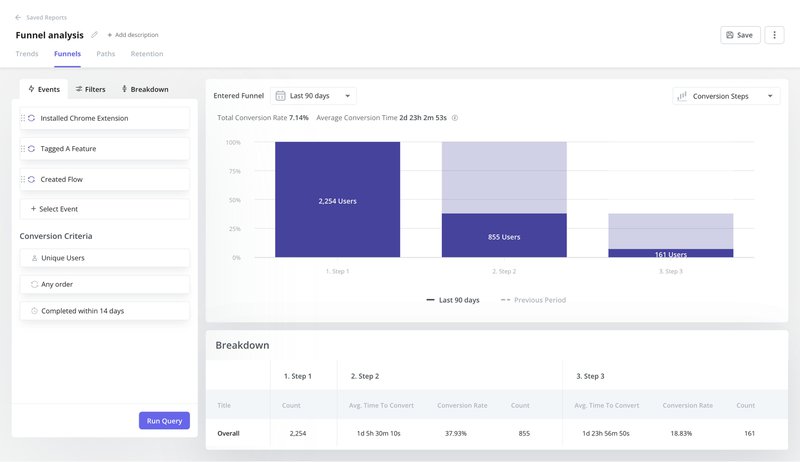
- Funnel report: Track how users progress from one step to the next and find the exact drop-off points. Each step’s conversion rate is a specific hypothesis about what’s working and what’s creating friction.
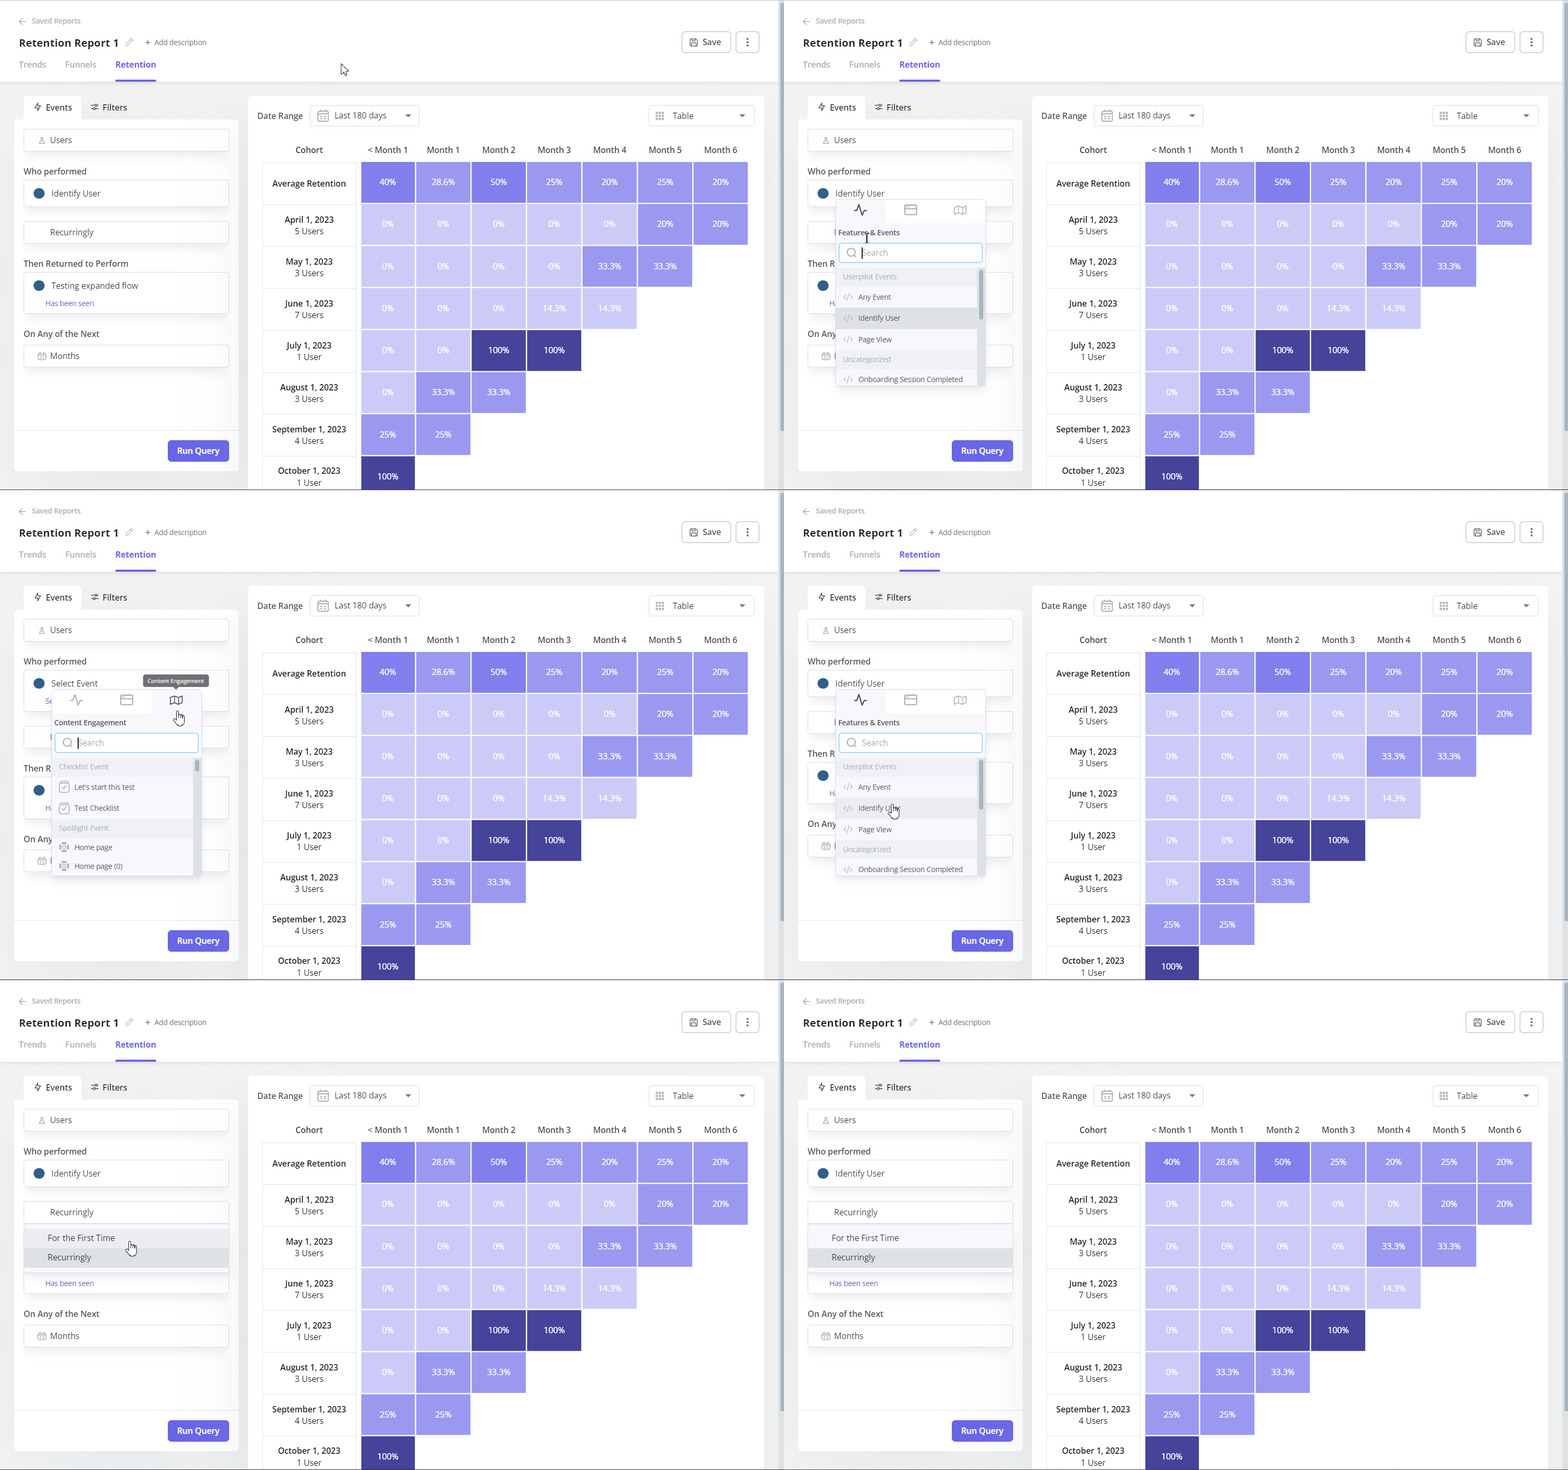
- Retention report: Track retention rates and identify the periods in the customer lifecycle when users stop paying. Cohort retention analysis segments users by sign-up date or acquisition channel so you can compare retention across groups, which is often the most actionable signal in the whole report.
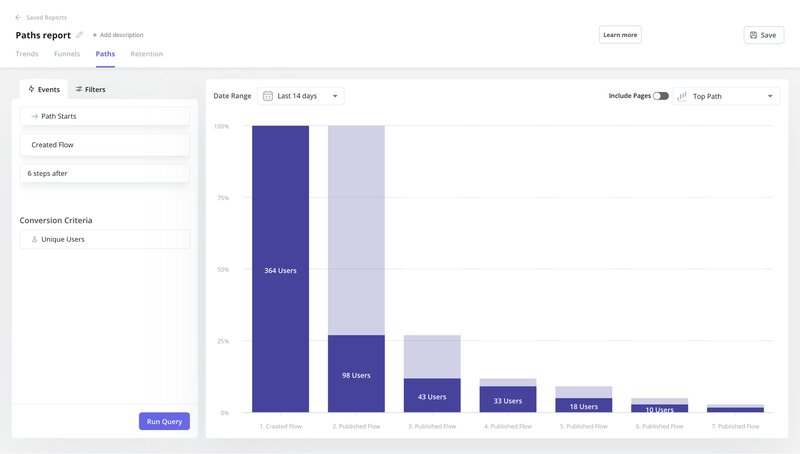
- Path report: Visualize the exact paths users take within your product to reach specific features or complete desired actions. Identify the happy paths and make them easier to find.
Step 7: Complement product launch analytics with user feedback
Analytics tools give you a lot of quantitative data at every stage of your launch. Support the numbers with qualitative data from user feedback so you understand what users are doing and why.
These survey types work well at different points in the launch cycle:
- Onboarding survey: Ask new users to rate their onboarding experience. This reveals where friction exists in the user journey and what’s slowing activation after launch.
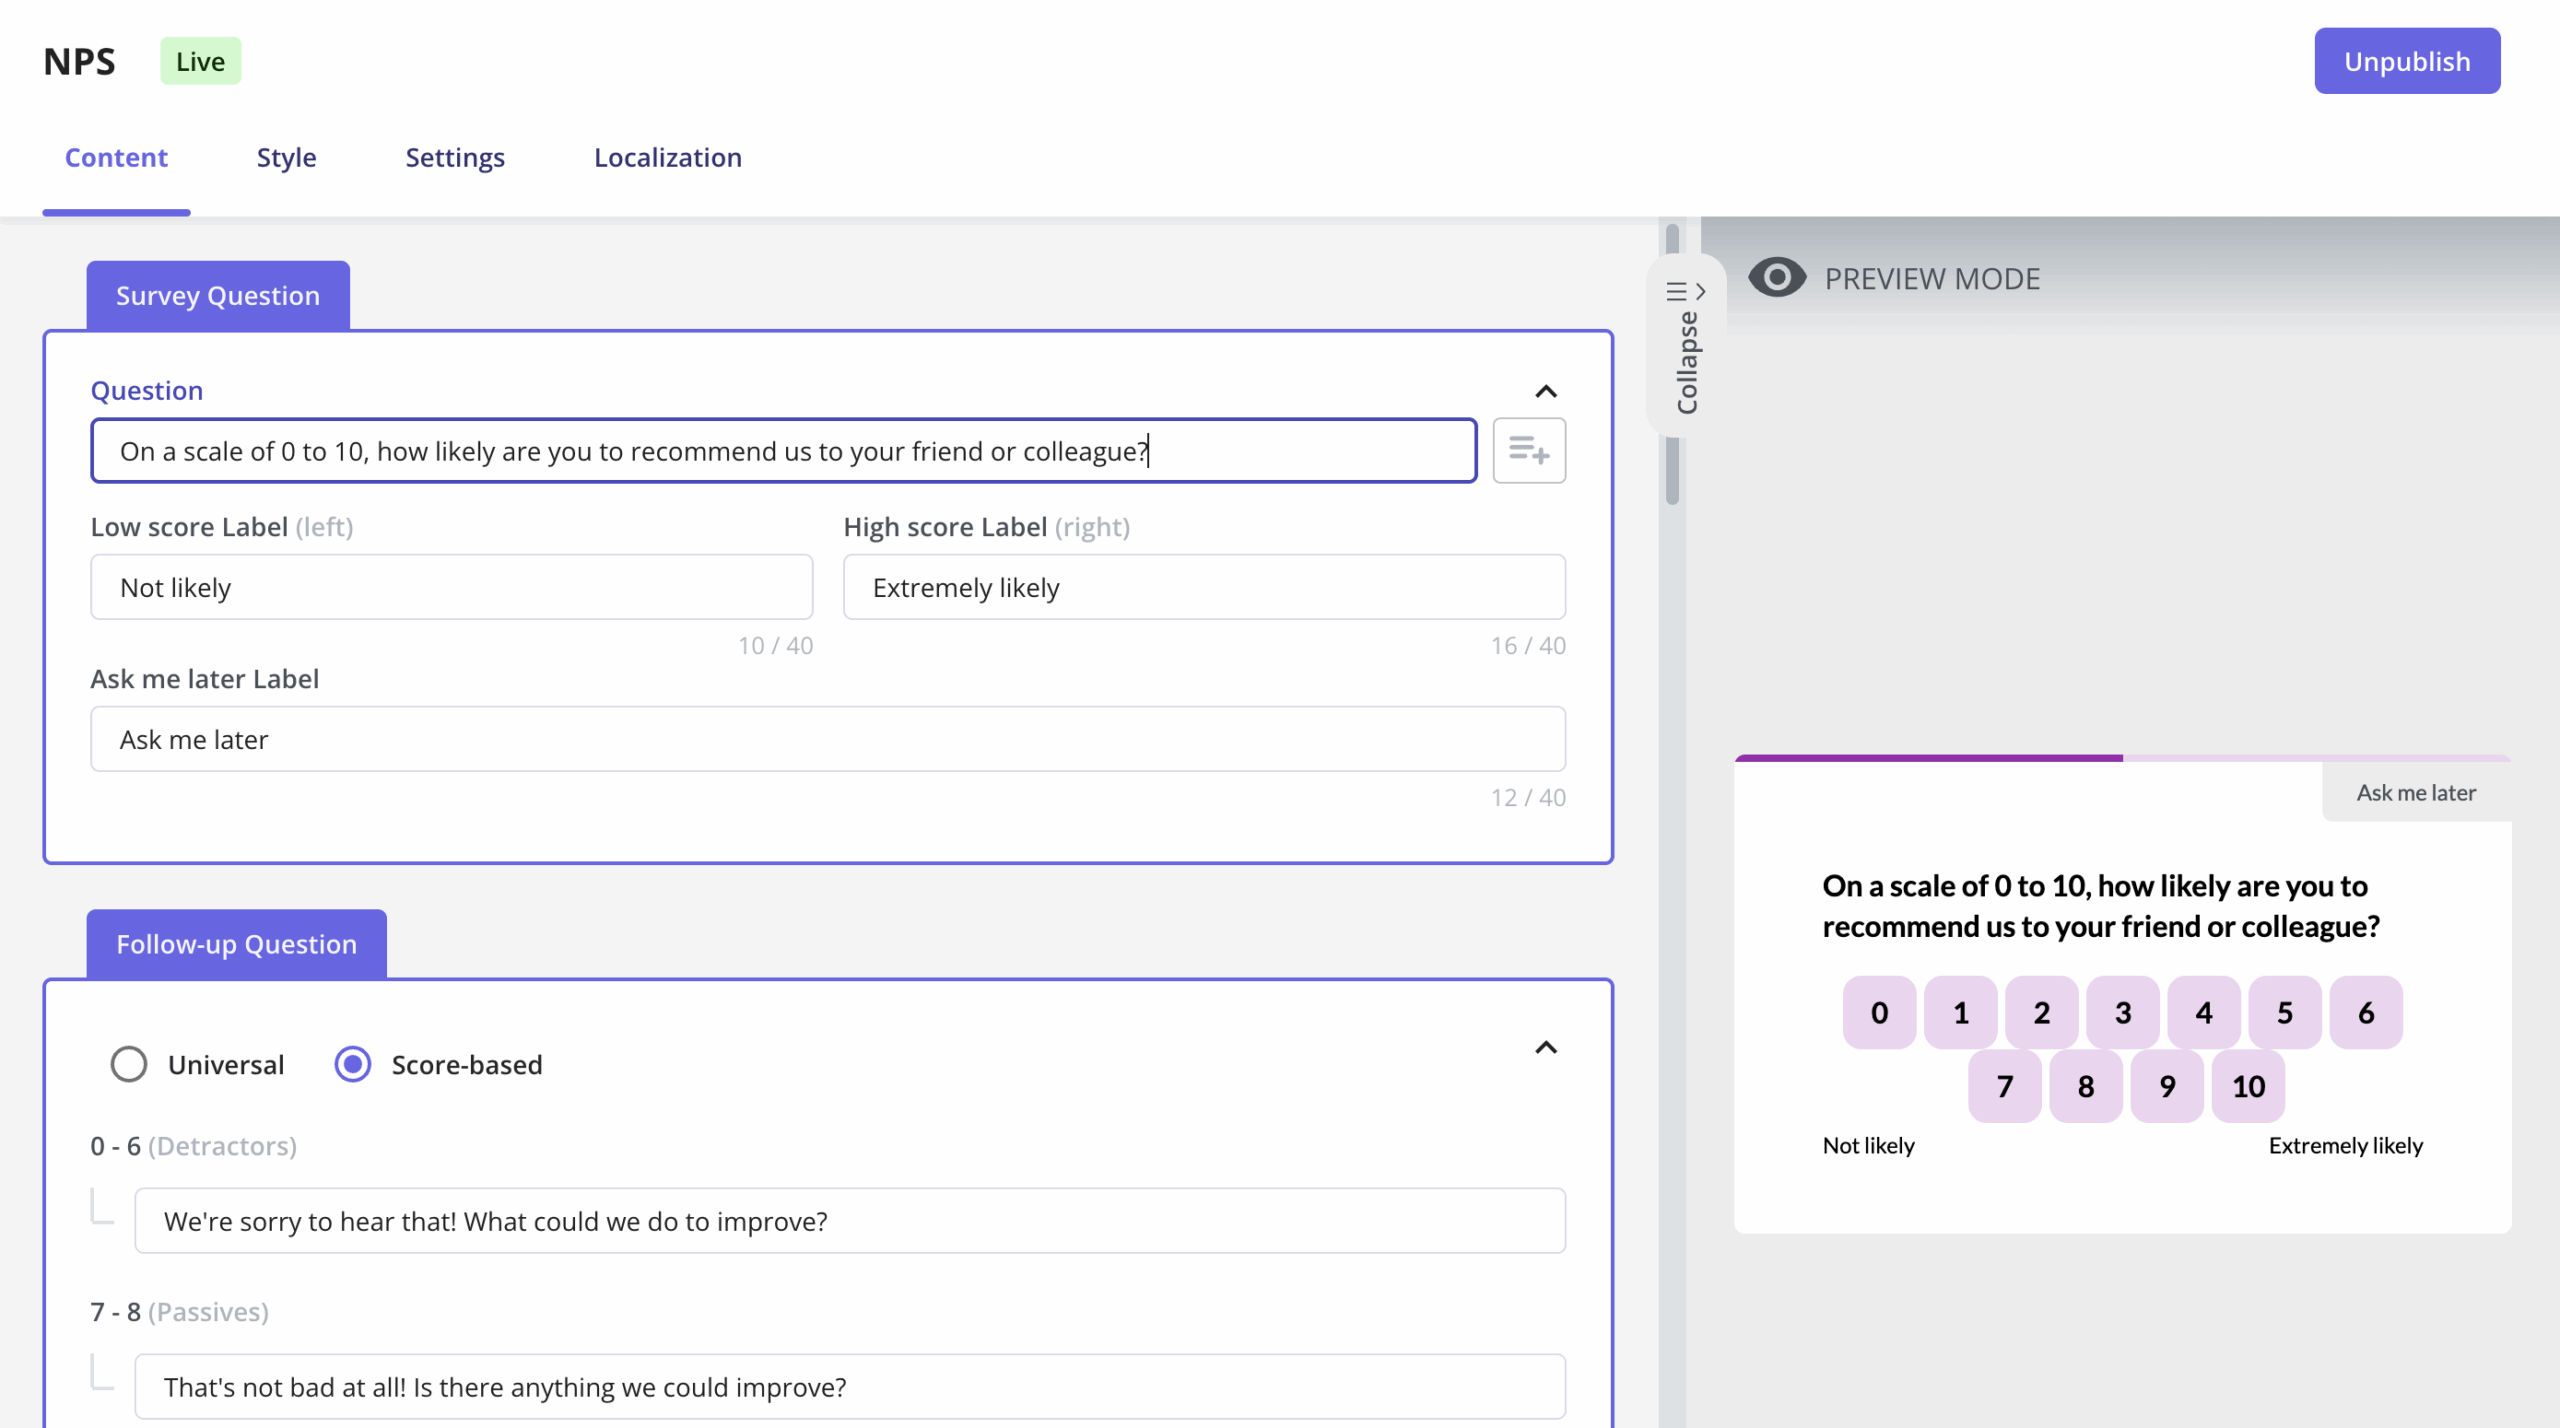
- Product NPS survey: Gain insights into user loyalty and sentiment by asking how likely they are to recommend your product. Run it 30 to 60 days post-launch for the most meaningful signal.
- Product satisfaction survey (CSAT): Ask users about their overall product experience to understand where they struggle and what they value most.
- Post-launch survey: Ask which features users find most valuable and which they rarely touch. This helps you allocate roadmap resources toward the enhancements that will have the most impact.
Step 8: Continuously iterate and improve post-launch
Shipping a product is when the measurement work starts, not ends. Your team’s job after launch is to ensure the product continues to attract and retain users, and the only way to do that is to iterate based on what the data shows.
Use the analytics and feedback from previous steps to identify areas of improvement. When a funnel report shows users dropping off at a specific feature, and CES survey responses confirm that feature feels complex, you have enough signal to act: cut the steps, build a targeted onboarding flow for that segment, and measure again.
In 2026, you don’t need to wait for a monthly review to catch these patterns. Lia, Userpilot’s AI agent, monitors your key metrics continuously and surfaces recommendations when usage patterns shift after a launch, so your team gets notified when something changes, not just when you happen to check the dashboard. Treating iteration as a continuous routine rather than a post-mortem is what compounds into a product that users keep coming back to.
Launch data tells you what happened. What you do next determines what happens to retention.
Tracking the right metrics and collecting user feedback at each launch stage are not optional. They’re the difference between iterating with confidence and shipping features that miss the mark two quarters in a row.
Userpilot gives you the analytics, in-app surveys, and AI-assisted insights to run this entire process in one platform, from the dashboards you build before launch day to the Lia alerts that surface problems the moment they emerge. Book a demo to see how it fits your team’s launch workflow.
Userpilot strives to provide accurate information to help businesses determine the best solution
for their particular needs. Due to the dynamic nature of the industry, the features offered by
Userpilot and others often change over time. The statements made in this article are accurate
to the best of Userpilot’s knowledge as of its publication/most recent update on May 26, 2026.
About the author