Customer Onboarding Checklist Completion Rate: 2024 Benchmark Report


An onboarding checklist is a list of tasks users need to complete to implement the product and experience its value.
Such a checklist enables users to discover and try out core product features necessary to achieve their goals.
Why does it matter?
Activation of these features is vital for product adoption, customer retention, and revenue! Fairmarkit has found that a 25% increase in activation leads to a 34% revenue boost.
Which makes perfect sense: Why would your customers keep using the product and upgrade to paid plans if it didn’t solve any problems?
What is the average rate for onboarding checklist completion?
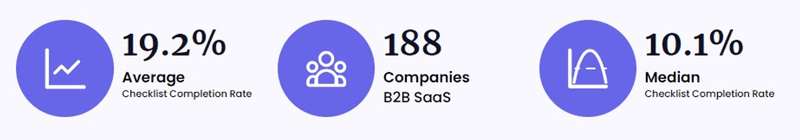
The average onboarding checklist completion rate at the companies we studied was 19.2%. And the median is 10.1%.
To obtain the rates, we studied the completion rate data from 188 companies that use Userpilot.
Should you worry if your checklist completion rate is lower than 19.2%?
It depends on your industry, company size, and acquisition model. Let’s look into this in more detail.
Average by industry
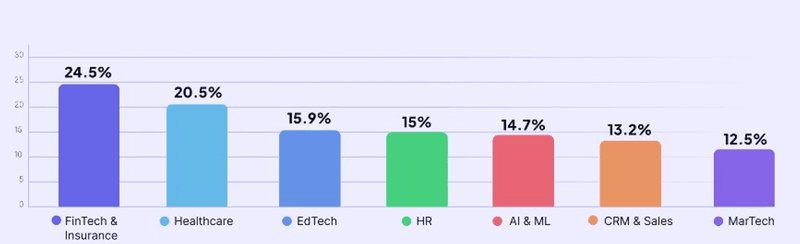
The average onboarding checklist completion rate in the best-performing industry, FinTech and Insurance, was nearly twice as high as in the lowest-performing one, MarTech (24.5 vs 12.5).
The reason?
In high-stakes domains like finance, mistakes can lead not only to financial loss but also to legal repercussions and irreparable reputation damage. So it’s essential for companies to fully implement and understand how their software works. Especially as these are often complex solutions.
In contrast, MarTech tools are less complex, so users don’t necessarily need to complete the onboarding process to start getting value from the product. They can often jump in and start using the core functionality without a comprehensive understanding of the product.
Here are the average completion rates in other industries:
- Healthcare – 20.5%
- EdTech – 15.9%
- HR – 15%
- AI & ML – 14.7%
- CRM & Sales – 13.2%
Average by company
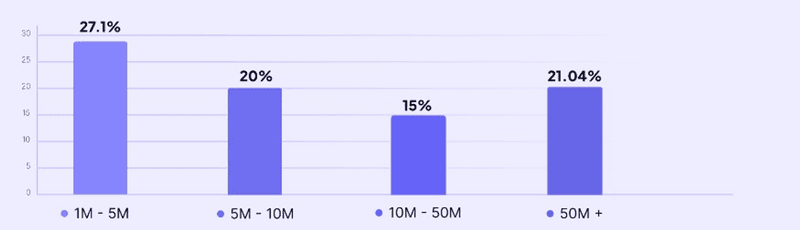
The breakdown of average completion rate data by company size shows that the completion rates decrease as the company revenue goes up. The rates were 27.1%, 20%, and 15% for companies with gross revenue of $1-5M, $5-10M, and $10-50M respectively.
How can we explain it?
The smaller companies might be closer to their user base. This allows them to better understand their customer needs and consequently design onboarding checklists that truly drive value.
Interestingly enough, the largest companies with revenue over $50M buck the trend with average completion rates of 21.04%.This could be attributed to having more resources they can invest in developing onboarding experiences.
Average by PLG or SLG
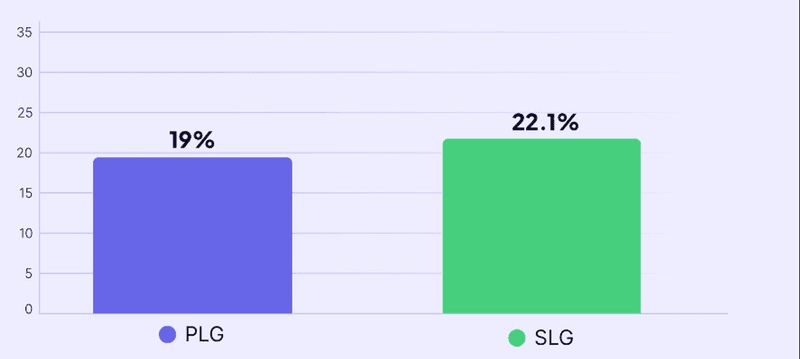
Sales-led companies outperform product-led ones when it comes to the customer onboarding checklist completion rate. However, the gap isn’t huge: 22.1% vs 19%.
How come? Aren’t PLG companies supposed to be better at designing engaging onboarding experiences?
As with the other metrics, we can attribute this perceived anomaly to product monetization. In SLG companies this happens before the user has a chance to use the product. And once they fork out thousands of $$$, they’re more motivated to get the value out of the product.
In case of the product-led companies, users can use the product without paying through free trials or freemium. This means there are more of them and they’re less committed.
What to include in your customer onboarding checklist
No-code growth tools like Userpilot make creating onboarding checklists a breeze.
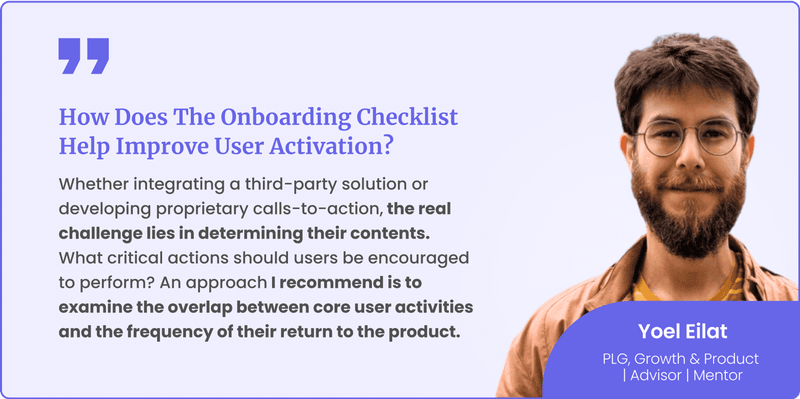
However, according to Yoel Eilat, a Growth and Product Advisor and Mentor, the main challenge is choosing the tasks for your checklists. That’s because the checklist should include only a handful of items (up to 7) that are absolutely essential for user activation.
He recommends looking for features whose usage is closely correlated with user retention:
An approach I recommend is to examine the overlap between core user activities and the frequency of their return to the product (e.g. logging in for another session, using the feature again). Actions with a large intersection (i.e. correlation) are prime candidates for increasing user activation through checklists.
Here’s an example of a Userpilot checklist. It includes only 4 essential tasks for users to start using the platform.
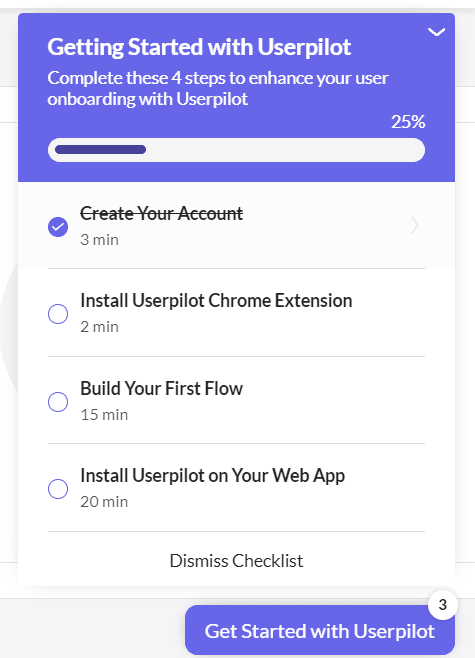
To make the checklist even more compelling, we’ve added the progress bar and a task they’ve already completed (creating an account). This reinforces the Zeigarnik effect.
We also back up the checklist with interactive walkthroughs which guide users through the tasks step by step.
Conclusion
Customer onboarding checklists help users set up the software and discover the most relevant features for their use cases. When combined with interactive walkthroughs, they enable users not only to witness the product value but also learn how to extract it in their contexts.
If you’d like to learn how to analyze user behavior to create onboarding checklists that resonate with your users, book the Userpilot demo!
About the author