
A product adoption dashboard helps you visualize key adoption metrics so you can make data-driven decisions and boost user engagement.
In this article, we cover the following:
- Why you need a product adoption dashboard.
- Steps to measure adoption using a comprehensive dashboard.
- The most important metrics to track and why they matter.
Try Userpilot Now
See Why 1,000+ Teams Choose Userpilot

What is a product adoption dashboard?
A product adoption dashboard is a visual tool that tracks and displays key metrics related to how users engage with your product.
Well designed, the dashboard will show you parts of your tool and flows most relevant to specific user segments and areas that may need improvement.
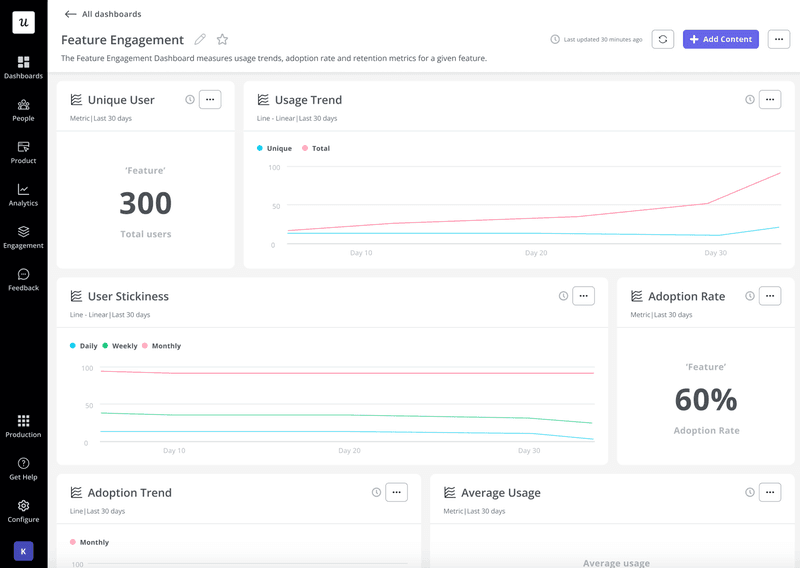
Benefits of using a product adoption dashboard
An adoption dashboard is a pivotal tool for businesses aiming to enhance their understanding of customer engagement and optimize product performance. Here are some key benefits:
- Find opportunities to increase product value more easily: By consolidating crucial metrics in one dashboard, your team can swiftly identify underutilized or misunderstood features and make targeted improvements that help new and existing users derive maximum satisfaction from your tool.
- Track product adoption metrics in one view: Gone are the days of juggling mountains of spreadsheets. A product adoption dashboard brings all your crucial adoption metrics under one roof, from user sign-ups to feature usage trends. Imagine instantly comparing new user onboarding with power user behavior, spotting patterns, and identifying gaps to bridge. It’s data analysis on autopilot, freeing you to focus on strategic action.
- Understand how new users adopt your product: The dashboard provides granular insights into the onboarding process, enabling you to understand how new users navigate and engage with your product. It reveals their pain points during onboarding, confusing interfaces, and features they miss. This knowledge is invaluable for refining your onboarding strategy and creating a positive initial user experience.
- Understand key features adoption: Data from the dashboard tells you if specific user segments are actively engaging with product features relevant to their use case. You can also see parts of your tool that appeal more to users and use that information to decide on feature redesigns, new features, and other strategies to boost your product usage frequency.
- Easier to make decisions on how to improve the adoption: The dashboard’s clear picture empowers you to make confident decisions backed by hard data. Whether it’s tweaking the UI, launching targeted tutorials, or revamping a feature, you’ll know your efforts are laser-focused on what truly matters.
How to measure product adoption using a comprehensive dashboard
Follow these four simple steps to measure adoption and glean value growth insights for your SaaS:
1. Choose a tool
You have two options here: Build a custom solution (from scratch or on a business intelligence platform) or use a product growth tool that, among other things, allows you to track, visualize, and act on user data. The latter is cheaper and less time-consuming, and Userpilot can help.
Here are some Userpilot features you’ll find interesting in this regard:
- Product adoption dashboard (launching in Q1 2024): While our platform currently has dashboards to let you measure engagement and analytics data, we’re rolling out a dedicated adoption dashboard soon.
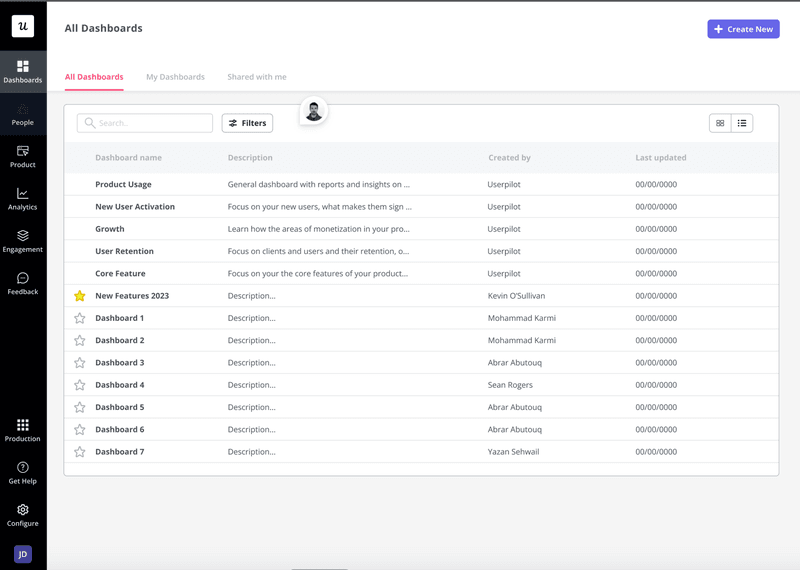
- Dashboard templates: Choose from multiple templates and design the look and feel of your dashboard.
- Custom dashboards: You can decide what metrics will appear in your report and how you’d like to visualize the results.
- Multiple product reports: Simultaneously conduct trends, funnels, feature usage, and user path analysis and add the reports to your dashboard. Seeing all these reports in one place gives you a holistic understanding of user behavior.
- App flows: Of course, it’s not just enough to see what’s happening in your product. You need to act on the data and make real-time changes to boost user adoption. Userpilot’s in-app flows come in handy here. You’ll have access to several UI patterns to create flows for better in-app communication and to prompt user action.
2. Define your main objectives
Clearly define your main objectives for measuring product adoption and what part of the customer journey you want to focus on.
Whether it’s improving the user onboarding process, enhancing key feature adoption, or boosting overall customer engagement, having well-defined goals helps in selecting the relevant metrics and ensures alignment with broader business objectives.
3. Set your product adoption metrics to track
Identify and define the key metrics that align with your objectives. For example, if your goal is to boost adoption among new users, you might want to focus on new user activation rate and onboarding completion.
If your objective is to increase product usage, look at tracking metrics like daily active users, monthly active users, churn, and customer retention rates.
4. Build your dashboard or use a template
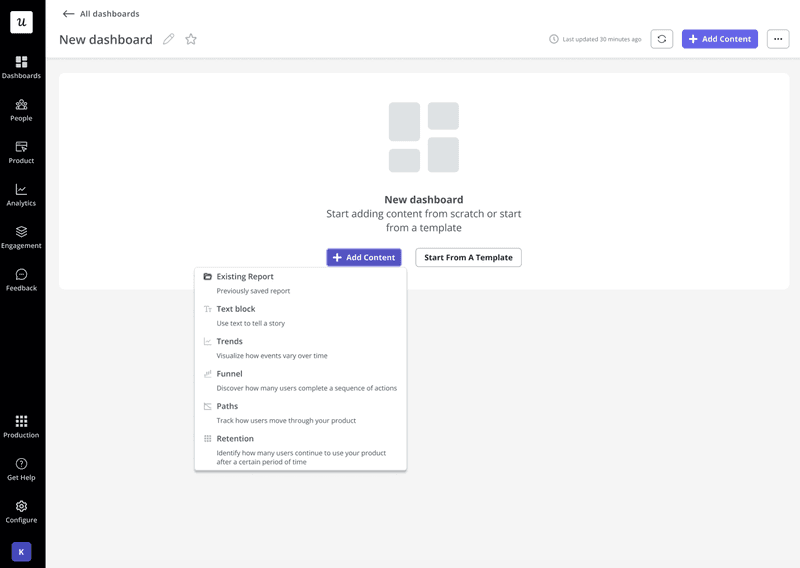
Once you’ve defined your objectives and selected the metrics, it’s time to build your product adoption dashboard.
Begin by deciding how best to visualize your reports and what core metrics to include. The most popular charts to use are bar charts, line graphs, pie charts, and dot charts, depending on your needs.
You can choose to use multiple visualization formats if the tool you’re using allows it.
For example, when Userpilot’s adoption dashboard is out in Q1 2024, it will provide full customization, allowing you to select what metrics to display and use any preferred chart. This allows for easy interpretation and decision-making.
Product adoption metrics to track in your dashboard
Wondering what to measure in your product adoption dashboard? The metrics in this section will give you a comprehensive understanding of the user journey and engagement.
You may not include everything to avoid cluttering your dashboard, but go through them and see the ones that best suit your adoption goals.
User activation rate
The activation rate measures the percentage of new users who have completed a specific set of actions or tasks that indicate successful onboarding and initial engagement with your product. This can be anything from setting up their profiles to completing a key action with one of your core features.
For example, if you’re a content management system like WordPress, new user activation could mean publishing the first blog post or adding essential plugins to a website.
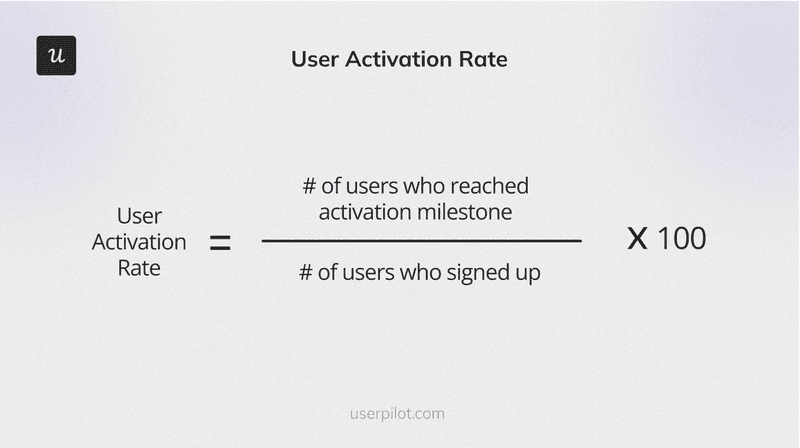
To calculate your activation rate, divide the number of users who reached your activation milestone by the number that signed up and multiply by 100.
Product stickiness
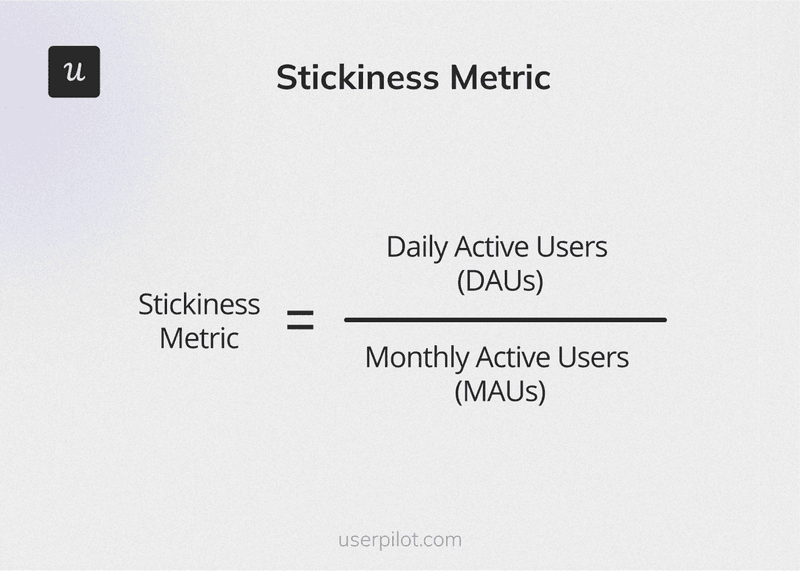
This metric measures how well your product retains users over time. There are many ways to calculate stickiness, but the most common method is by dividing the average number of daily active users (DAU) by the average number of monthly active users (MAU).
Important KPIs to know when tracking product stickiness:
- Daily active users: The number of unique users engaging with your product daily.
- Weekly active users: Unique users who engage in a given week.
- Monthly active users: The number of unique users who engage in a specific month.
By measuring your product usage frequency, you’ll see how many users depend on your tool regularly and, from there, easily determine what part of your tool resonates better with different user groups.
Conversion rate
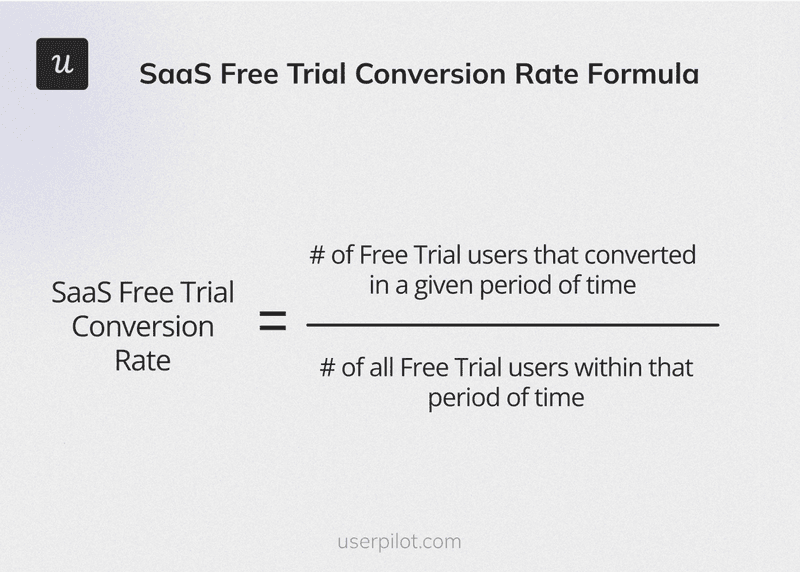
This metric measures how many users complete a desired action, such as making a purchase or upgrading to a premium plan.
An increasing conversion rate suggests that users are not only adopting your product but are also progressing through the desired user journey, whether it’s becoming a paying customer or taking another significant action.
To calculate your conversion rate, divide the number of conversions by the total number of users or visitors taking the desired action and multiply by 100.
Product adoption rate
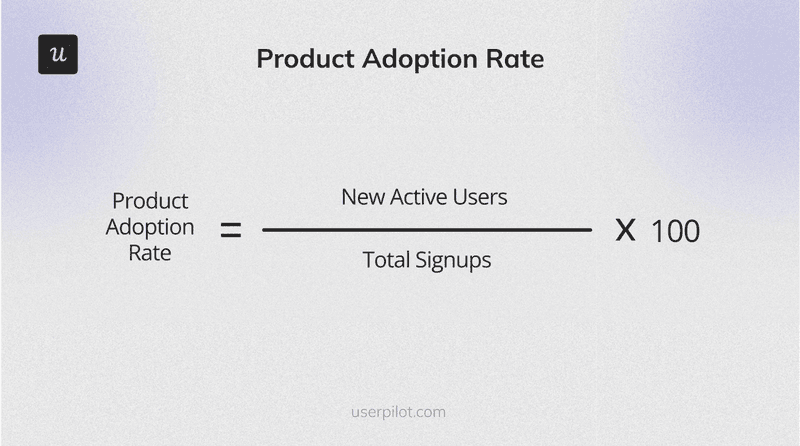
This is one of the core metrics to have in your product adoption dashboard. Simply put, it measures the percentage of new users who have successfully adopted your product.
An increased adoption rate means a significant portion of your new users actively use and derive value from your product.
Feature adoption rate
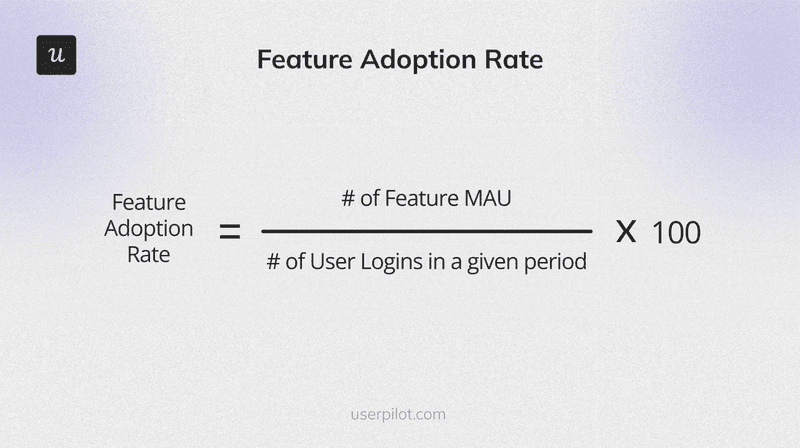
While product adoption focuses on user engagement with the core value proposition and overall benefits of your product, feature adoption aims to understand which individual features resonate with users and are used often.
By tracking your feature adoption rates, you can identify areas of your product adoption process to optimize for better customer satisfaction.
To measure this metric, divide the number of feature MAUs by the number of user logins in a given period. Multiply the result by 100 to get the percentage.
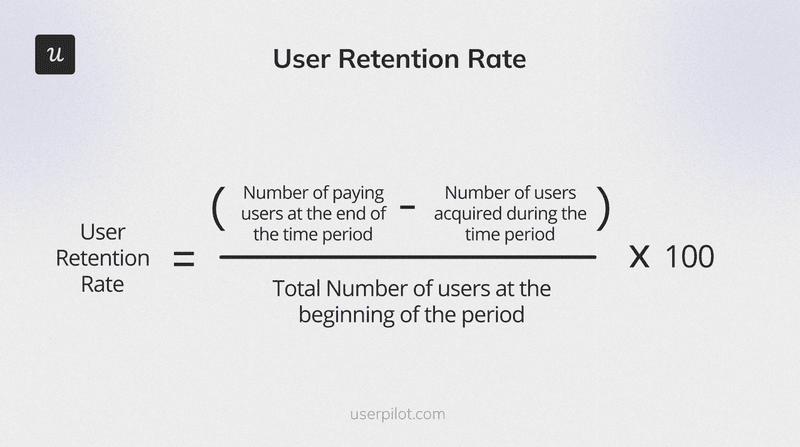
Customer retention rate
This metric tracks how many users continue actively using your product over a specific period. A high customer retention indicates users find your tool valuable and are enjoying a good return on their investment.
To calculate, subtract the number of users acquired in a specific period from the number of paying users at the end of that period. Divide the result by the number of users at the beginning and multiply by 100:
Average session duration
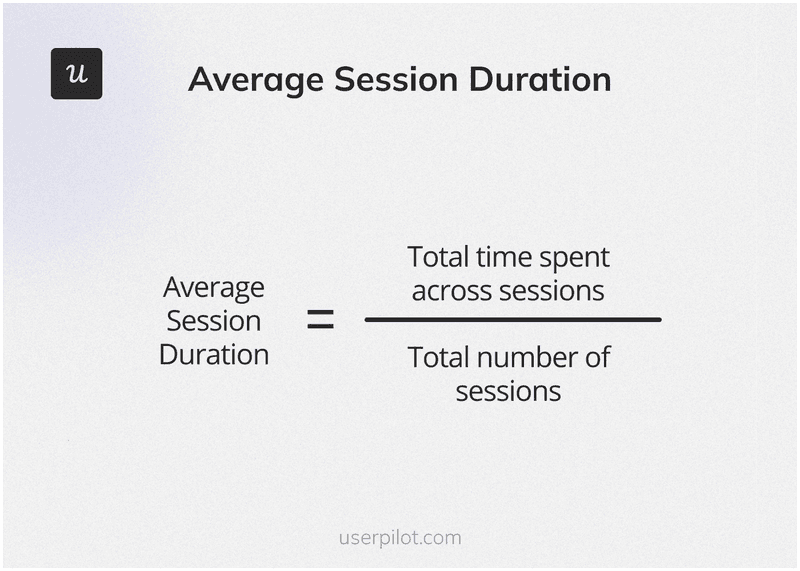
This metric measures the average amount of time users spend actively engaging with your product during a single session.
The average session duration helps gauge customer engagement and indicates whether they find your product useful enough to dedicate focused time. Increasing session duration can suggest successful onboarding, engaging features, and overall adoption.
To calculate, find the ratio of the total time spent across sessions and the total number of sessions:
Customer lifetime value
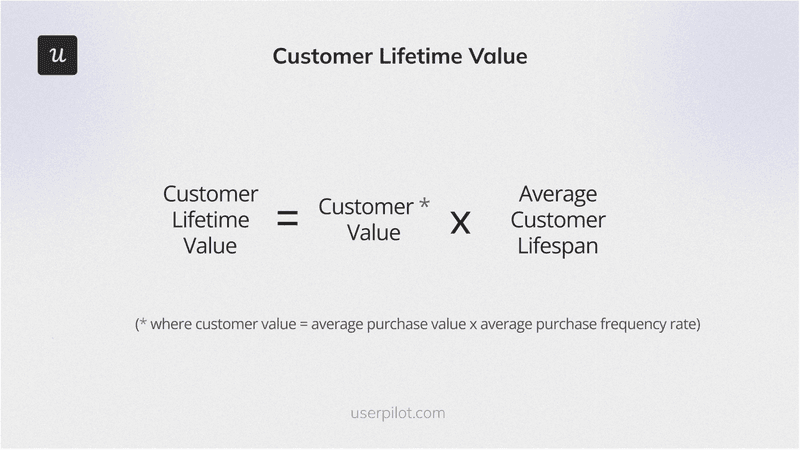
This metric helps you predict the total revenue your company can expect to get from a single customer throughout their relationship with you.
LTV may not look like it’s directly tied to adoption, but it certainly is. Have it on your product adoption dashboard so you can always look at the data and instantly understand the long-term value of acquiring and retaining customers. Real-time access to this data helps you make good decisions about how much to spend on your acquisition and retention efforts.
Calculate your LTV by multiplying the customer value and average customer lifespan (where customer value is average purchase value multiplied by the average purchase frequency rate):
Net Promoter Score (NPS)
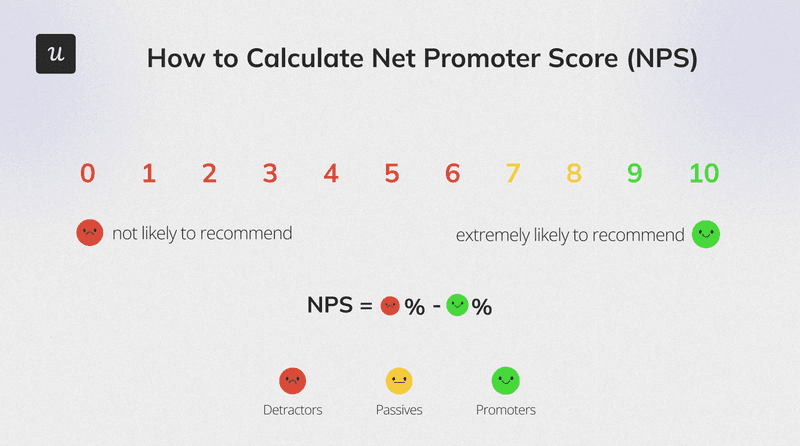
The Net Promoter Score uses an 11-point survey (0-10) to gauge customer sentiment, usually by asking how likely they are to recommend your product or service to those they know.
NPS respondents are divided into promoters, passives, and detractors, as portrayed in the image below. A good NPS score means more people are willing to promote your tool, and that’s generally good for business.
Calculate your NPS score by subtracting the percentage of detractors from the percentage of promoters.
Customer satisfaction score
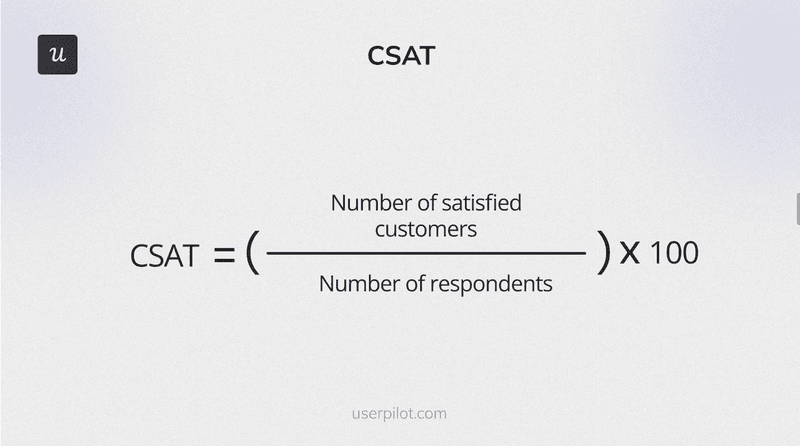
Similar to NPS, the customer satisfaction score (CSAT) is also calculated from surveys. It’s a figure that represents customer satisfaction with a specific feature, transaction, or overall experience with your product.
To measure customer satisfaction, divide the number of satisfied customers by the total number of users that responded to your CSAT survey. Multiply the result by 100:
Conclusion
The purpose of an adoption dashboard isn’t just to chase numbers; it’s about understanding your users and creating a product experience they truly love.
Userpilot can help facilitate that. Aside from creating and customizing a product adoption dashboard, you can use our tool to conduct in-depth product analytics, collect customer feedback, and trigger contextual in-app experiences to drive growth.
Book a demo now to discuss your growth objectives and challenges with our team.


