
What are the B2B SaaS metrics you should be tracking right now?
It’s easy to get swept away by the plethora of vanity metrics out there. But, to get product growth insights and measure the success of your product marketing efforts, it’s crucial to know and optimize the actionable B2B metrics.
So let’s dive in and see what B2B SaaS metrics you need to track to unlock growth.
Try Userpilot Now
See Why 1,000+ Teams Choose Userpilot

What is B2B SaaS?
B2B SaaS involves businesses that provide cloud-based software solutions to other businesses. These solutions cover a wide range of topics, such as customer relationship management, work productivity, onboarding, analytics, accounting, and more.
What are B2B SaaS metrics?
B2B SaaS metrics are specially designed to help you understand and improve your ability to gain more visitors, leads, and customers. There are certain B2B metrics you must track to gain business growth.
Why is tracking B2B SaaS metrics important?
As of 2021, the SaaS market was worth approximately USD 123 billion and is predicted to rise to USD 145 billion in 2022. SaaS businesses are facing increasing competition, which emphasizes how critical growth is compared to other industries.
This is where B2B metrics come in. They help you measure progress and track the overall health of your business. By tracking revenue, retention, churn, and other metrics, you can make sure your company is growing at an acceptable rate.
Moreover, these metrics help you identify and remove friction points to improve the user experience. You can also use them to align your whole team to a shared business objective.
6 key metrics that are critical for your SaaS
There are numerous B2B metrics, but here are the six most important metrics that will provide you with the product growth insights that you need.
Customer Acquisition Cost
The customer acquisition cost is the average cost of gaining one new customer for your business. And SaaS businesses that don’t get new users profitably fail to last in the long run.
To calculate this metric, add the sales and marketing expenses in a specific period (monthly or annually) and divide the value by the number of users acquired during that period.
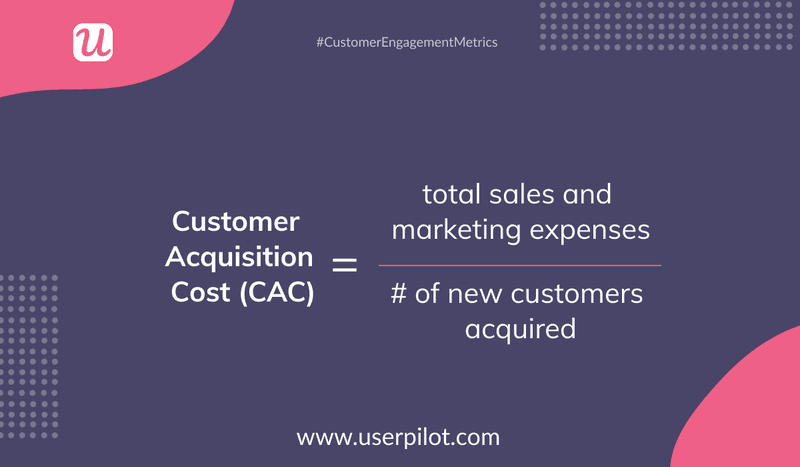
It’s also important to account for overhead expenses like paid advertising, payment to third-party sites for link building and publishing, and graphic design.
You can measure CAC for only one channel or across all your organization’s marketing and sales activities. It’s useful to calculate CAC for every channel to know where to raise or reduce the marketing budget.
Measuring CAC can help you understand whether you are earning your money’s worth as you invest in expanding your customer base.
Targeted marketing campaigns, coupled with CAC, let you focus on specific user segments and know how much you spend on each prospect to acquire them and finally convert them to paying customers.
Customer retention rate
The customer retention rate is the percentage of customers you retained during a specific period.
For a successful product marketing campaign, it’s vital to measure retention in a time range or at multiple points in a given period. Some time-based retention rates are:
- 1-month retention rate
- 7 days range retention rate
- Week 1 retention rate
- Day 0 retention rate.
Customer retention cost is a measure of retention, where you divide the total yearly cost of customer success, initiatives, and retention teams by the number of active users.
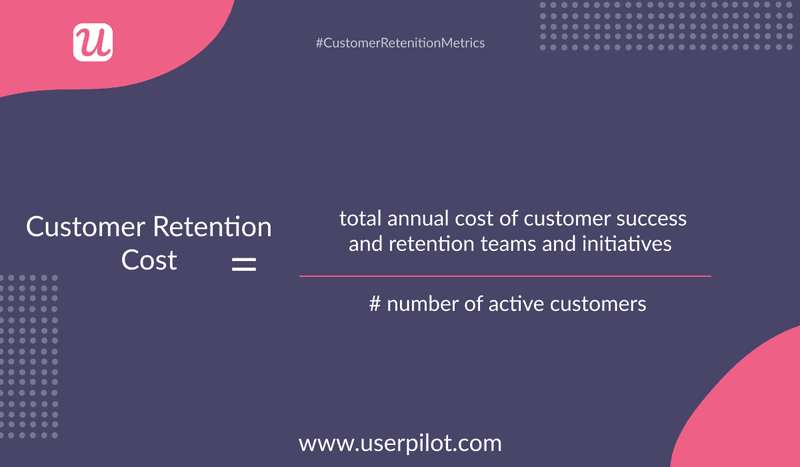
It gives you insight into how much your customers want to continue doing business with you.
Retention rate can never be a standalone metric. You should use it along with the customer churn rate (discussed later) to gain visibility into your company’s subscription renewal rates. This enables you to better estimate your future revenue stream and plan your team’s growth around it.
A low retention rate could suggest a low level of customer satisfaction, in which case you might lose more customers than you gain. Thus, this metric gives you an early warning so that you can address potential problems as fast as possible.
Monthly recurring revenue
The monthly recurring revenue is the total revenue your business is predicted to earn from all active subscriptions every month.
MRR involves recurring charges from coupons, recurring add-ons, and discounts. To measure MRR, multiply the average revenue per account by the number of monthly subscriptions.
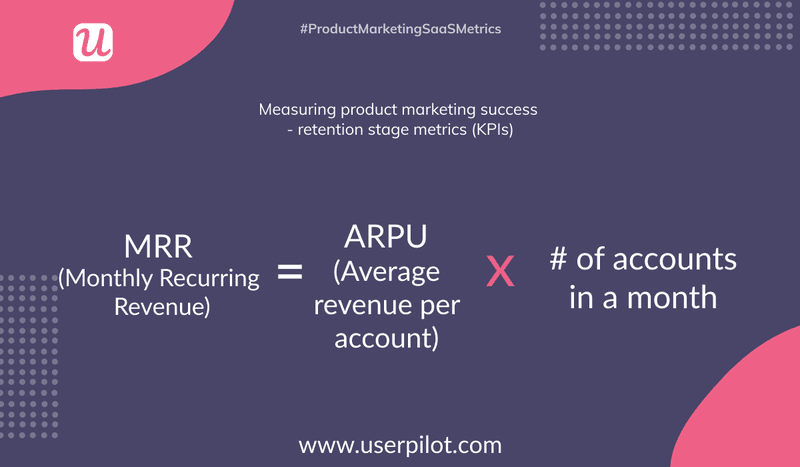
MRR creates a correlation between users and their accounts, presenting their subscription behavior before you.
An increasing MRR can indicate an increase in subscription plan updates or customer acquisition or both. On the other hand, a decreasing MRR can suggest cancellations or downgrades.
To grab hold of the exact reason behind changing MRR values, you should track the various factors that affect this metric separately.
Break down this metric into different types, such as expansion MRR, churn MRR, downgrade MRR, and upgrade MRR. Every type will provide unique insights into user behavior, revenue growth, and overall business health.
Adoption rate
Product adoption occurs when the user moves on from the initial trial phase to actively using your product for solutions. The adoption rate is thus the percentage of new users to all users, whether it is for a specific feature or the whole product.
For example, if you have 30 new users in July and the total number of users is 300, your product adoption rate is 30/300 x 100% = 10%. You can measure it on a daily, weekly, monthly, or annual basis.
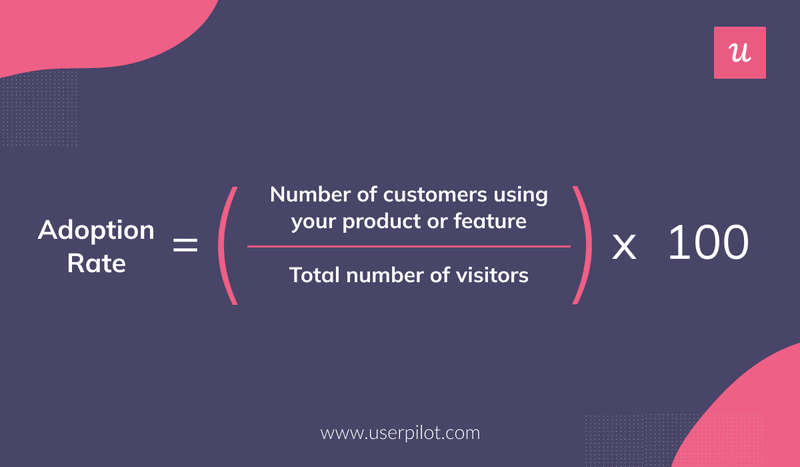
A customer adopts your product for the long run when they go through all phases in the adoption flyweehel.
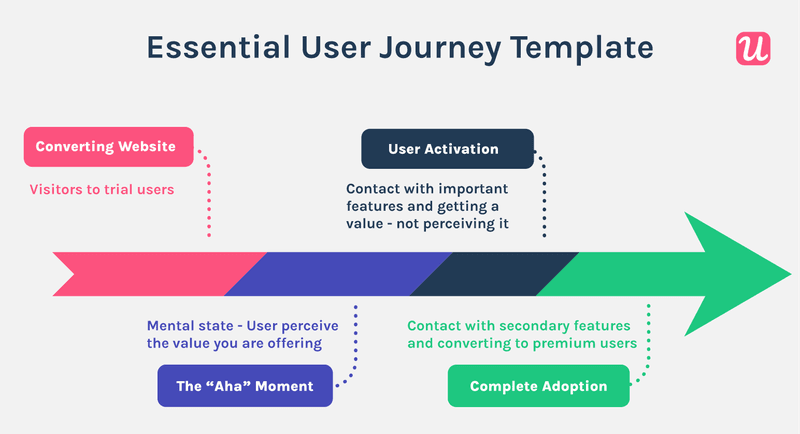
It covers the user journey, starting from the initial AHA moment when the user realizes your product’s value and activates to the point where they sign into the ‘Pro’ plan and become brand advocates.
The adoption rate allows you to understand what promotes initial and ongoing adoption. Once users convert to paying customers, you can maintain activation by improving in-app experiences and driving upselling to higher-tier plans. Thus this metric helps increase your customer lifetime value and expansion MRR.
Customer churn rate
The customer churn rate is the percentage of users lost in a given period due to account cancellations.
You can calculate this metric by dividing the number of customers lost during the period by the number of customers present at the beginning of that period and then multiplying the ratio by 100.
The churn rate can never be zero. However, you can reach a point of negative churn, where your revenue becomes high enough to exceed the losses due to churn.
Small SaaS businesses usually target a 5-7% churn rate, whereas enterprise-level ones should keep it under 5%.
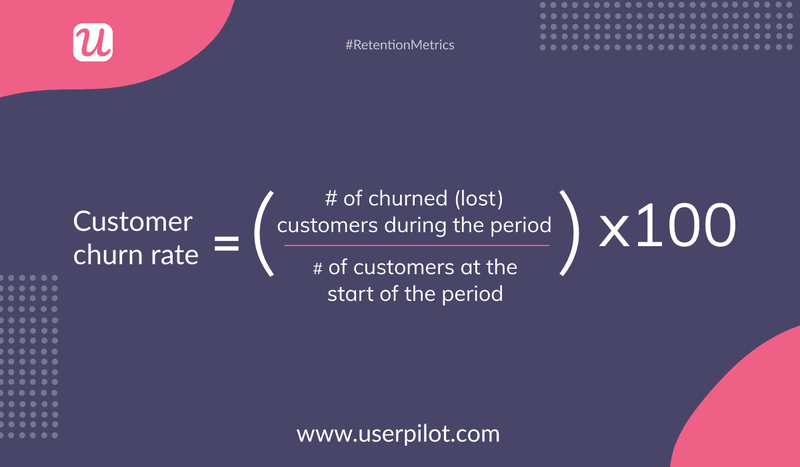
Customer churn rate is one of the most crucial product-led growth metrics. As mentioned before, in conjunction with the retention rate, the churn rate can help you develop successful retention strategies.
You can understand how users are leaving, where in the funnel they are leaving, and why they are leaving to create better in-app experiences and reduce churn.
NPS score
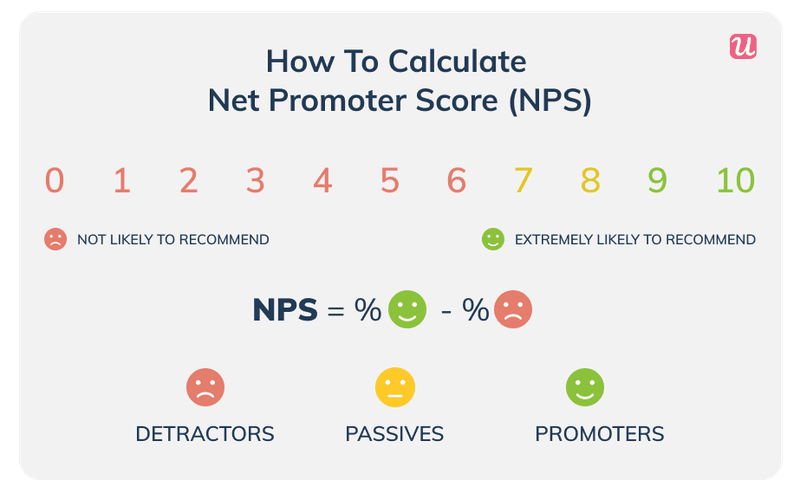
The Net Promoter Score is a great measure of user sentiment and customer satisfaction. You only need to use an NPS survey to ask users how likely they are to recommend your product to others on a scale of 1-10.
An NPS score is determined by dividing the percentage of promoters by the percentage of detractors. Customers who give you 9 or 10 are known as promoters. Customers who give you a score of 6 or lower are known as detractors. They are most likely to churn because they are unhappy, and disengaged.
Correlating the NPS score with product usage analytics can help you better understand what makes users happy. You can then identify key patterns of product usage.
You may find that your promoters have a particular feature in common, or your detractors are missing out on an important feature. So you can take steps to maintain your strengths or nudge users to the right feature.
How to improve B2B SaaS metrics?
Now let’s see how you can incorporate the insights from these metrics to improve them and drive product growth.
Improve Customer Acquisition Cost (CAC) with product analytics
Look into your product usage data and perform cohort analysis to find the most active, profitable customers. These customers are satisfied and engaged with your product.
Cross-reference them with acquisition sources to find the most profitable sources. Then optimize your budget allocation to media and channels that help you get the most relevant customers.
Userpilot’s product analytics allows you to create contextual in-app experiences for customers. In addition, you can track metrics around feature adoption, user sentiment, activation, self-serve, and help center usage.
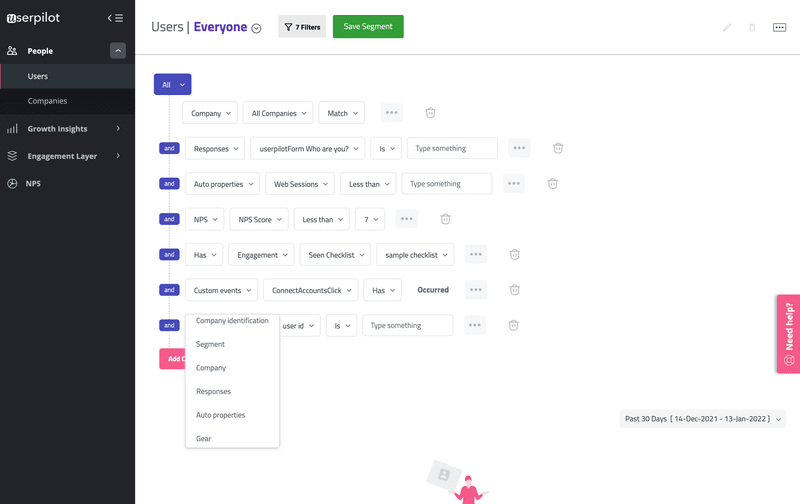
Below you can see how Userpilot provides advanced segmentation functionalities. You can group users into cohorts based on their NPS score, engagement level, custom events, and more to understand their behavior and design your marketing strategy accordingly.
Use secondary onboarding to retain existing customers
The user journey doesn’t end with the initial AHA moment and activation. You need to engage them at every stage of the journey to retain them. Onboarding is a continuous process through which users learn to use your product to reap the most benefits from it.
Secondary onboarding focuses on retaining customers by constantly engaging them. Proactive in-app guidance given by elements like modals or tooltips helps customers discover new features or use advanced features.
Such in-app messages drive repeated value and, therefore, retention. Exposure to relevant secondary features right when customers need it can convert them to premium and loyal users.
Use modals to prompt users to upgrade their accounts
Account expansion is the key to boosting your MRR. And you can achieve it through upsells, upgrades, cross-sells, and add-ons.
If you look closely at the MRR formula, you will find that it improves acquisition, reduces churn, and/or generates more revenue.
To this end, you can use modals to send contextual messages to customers about upgrades.
Modals are great for highlighting the fact that your freemium and basic plans have restrictions that users can overcome by upgrading. These modals are prompted at the right time, so users aren’t bombarded with irrelevant messages.

Use tooltips to drive users to the activation points
To adopt your product, users need to first experience its value. So you need to ensure they discover relevant features and adopt them over time.
You can make features visible using tooltips and push users toward the activation point. A tooltip is a short piece of text linked to a specific product element.
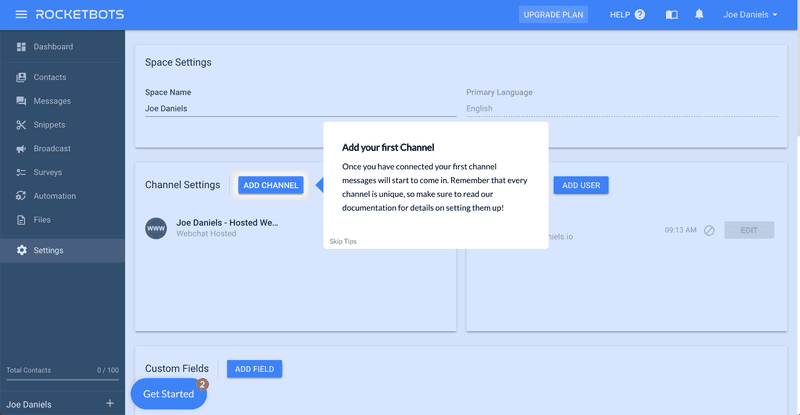
For instance, the image below shows how a tooltip pops up when a user’s cursor hovers above the “ADD CHANNEL” button.
Userpilot lets you build engaging tooltips to educate your customers without any coding. You can either create a native tooltip or build it as part of a flow.
Offer in-app self-service support to reduce churn rate
Harvard Business Review found that 81% of users try to handle software issues themselves. This proves how important it is for SaaS companies to offer in-app self-service support that users can resort to.
Self-service support makes customers feel accomplished to have solved something on their own. It also reduces customers’ dependence on the support team and allows agents to focus more on pressing non-repetitive matters.
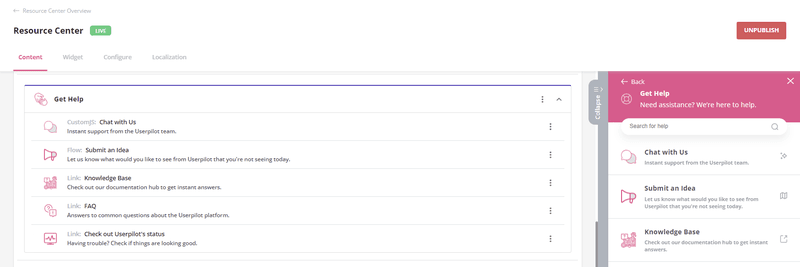
An in-app help center is perfect for providing this support. It’s packed with resources like FAQs, tutorial videos, troubleshooting tips, best practices, and more. This reduces friction in getting help and shortens the learning curve.
You can even insert a link to your knowledge base inside your help center. A survey by Coleman Parkes revealed that a self-service knowledge base could boost your retention rate by as high as 85%.
Launch NPS survey to find detractors and act on
Userpilot lets you launch NPS surveys and create advanced user segments based on their scores.
You can divide the whole group of respondents into promoters, passives, and detractors. Then you can use promoters’ opinions to build on your strengths and improve retention.
Knowing what disengages detractors can help you improve your product, customer support, product experiences, or all. This can not only reduce churn but also convert detractors to promoters.

Best tools to track B2B SaaS metrics
Tracking B2B metrics is tough without the right analytics tool at your disposal. So let’s go over the 3 best analytics tools for getting growth insights.
- Userpilot
- Mixpanel
- Chartmogul
Userpilot
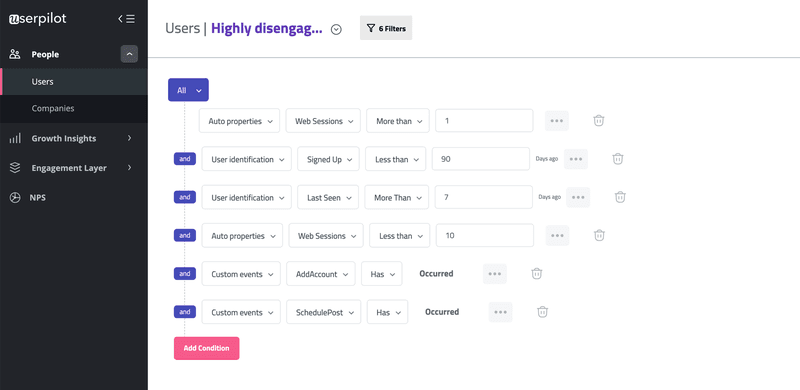
From customer segmentation to NPS surveys to feature usage, Userpilot helps you with all. The image below shows how the tool lets you segment and target highly disengaged users based on multiple criteria, such as the number of web sessions, sign-up date, last seen active, and custom events.
This will help you increase in-app engagement as well as your retention rates. You can convert inactive users into active ones. In addition, you can tag specific features to get an overview of feature usage. Userpilot can also prompt NPS surveys contextually to gather valuable user feedback and analyze the data for you.
Onboard and engage mobile app users by creating personalized messaging, push notifications, and surveys with Userpilot.
Mixpanel
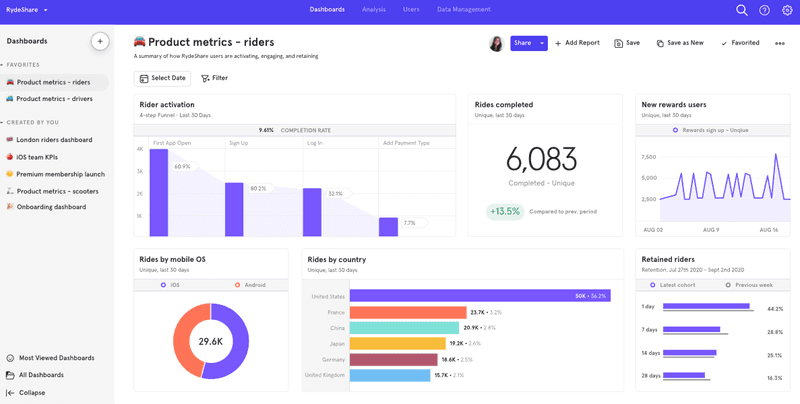
Mixpanel is a product analytics tool. It allows you to collect data on user interactions with your product. You can use this platform to analyze product data with simple yet interactive reports that let you visualize data and make queries.
Chartmogul
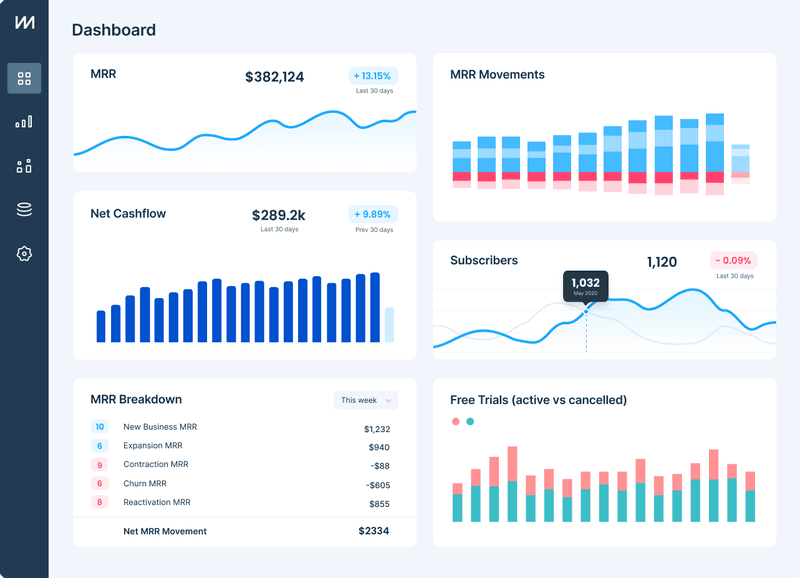
Chartmogul is another analytics platform that helps users run their subscription-based companies. It gives you a complete overview of the entire customer base, and the interface is user-friendly.
Its dashboard is easy to use and showcases metrics like churn, customer lifetime value, average revenue per account, monthly recurring revenue, etc.
Wrapping it up
Tracking B2B metrics is essential to make sure you are on the right growth trajectory. There are 6 such key metrics – customer acquisition cost, customer retention rate, adoption rate, customer churn rate, NPS score, and Monthly Recurring Revenue.
You need to use insights from each of these metrics to improve their value and, consequently, drive product growth.
Want to track B2B SaaS metrics? Get a Userpilot demo to not only measure them but also analyze the results to form growth strategies.


