Customer Churn Analytics: A Product Manager’s Guide


Lighter Capital’s Benchmarking Insights show median churn sits around 16.21% for B2B SaaS. Behind that number are stories of users who tried your product, hit friction, and quietly left.
Customer churn analytics is how you’ll uncover and rewrite those stories.
Done right, it helps you spot churn warning signs early and improve retention. In this guide, I’ll show you how, plus a tool that makes the process fully actionable for a product manager like you.
What is customer churn analytics?
Customer churn analytics is the process of understanding why users leave your product. On top of simply looking at the churn rate, it helps diagnose the health of your product experience.
To better understand churn analytics, look at it from two angles:
- Churn is a symptom, not the diagnosis: It points to deeper issues, like a confusing onboarding flow, a buggy feature, or pricing that doesn’t match perceived value.
- Churn analysis is more than the churn metrics: Instead of stopping at “we lost 5% of users last month,” churn analytics helps you say, “we lost 5%, and most were new signups who never invited a teammate, which shows that your early ‘Aha!’ moment isn’t landing.”
Why is customer churn analytics important?
Churn quietly erodes your revenue, momentum, and reputation long before it shows up in a quarterly report. Even a “low” 1% monthly churn rate can wipe out more than 11% of your customer base each year. And that surface-level number often masks deeper problems in specific customer journeys.
Churn analytics uncovers those risks. It also strengthens three core parts of your product strategy:
- Profitability: High churn forces you to accrue high customer acquisition costs just to maintain your baseline. Analytics helps you pinpoint where users drop off and proves why investing in retention delivers better returns than constantly replacing lost customers.
- Feature impact: Building features that go unused can be frustrating, even making it difficult to rally teammates for the next build. Churn analysis fixes this by revealing why users disengage. This insight guides teams to build features that customers want and use.
- Customer loyalty: Satisfied customers expand, advocate, and refer. Frustrated ones churn, often leaving negative reviews that slow future growth. Churn analytics highlights the exact patterns behind those exits so you can fix issues before they become public complaints.
In short, churn analytics protects your revenue, sharpens product decisions, and keeps your customers loyal. That’s why it matters.
How to conduct customer churn analysis (and figure out your key to better retention)
In 4 steps: measure the right metrics, analyze customer behavior in the data, translate those insights into churn-reduction actions, and build a customer-churn-prediction system that surfaces risk before customers leave. Below, I break down each step so you can follow right away.
Step 1: Measure churn metrics
Before you uncover why users leave, you need an accurate view of what happened. To do this, track two metrics every week: customer churn and revenue churn.
The goal? Connect outcomes to user behaviors that preceded them.
1. Customer churn rate
Also called customer attrition rate, this metric shows the percentage of customers you lose within a specific period. And it’s what most teams mean when they say “churn.” As a benchmark, small to medium-sized SaaS businesses typically see monthly churn rates between 3% and 7%.
How to calculate Customer Churn Rate: (Customers Lost in Period / Total Number of Customers at Start of Period) x 100
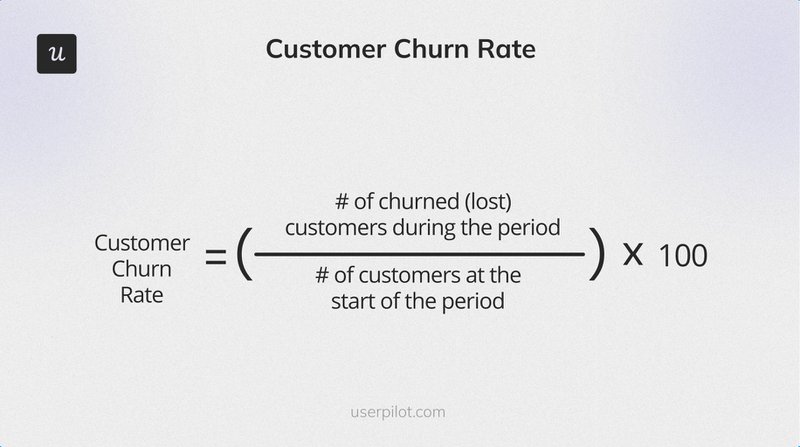
For example, say you start the month with 1,000 customers and lose 50, your churn rate is 5%. This falls within the 3-7% range, the benchmark for SMBs.
2. Revenue churn rate
Revenue churn reveals the financial impact behind customer churn. It shows the percentage of Monthly Recurring Revenue (MRR) lost due to drop-offs. And when the number is high, it means your most valuable customers are leaving.
How to calculate Revenue Churn Rate: (MRR Lost from Churned Customers / Total MRR at Start of Period) x 100
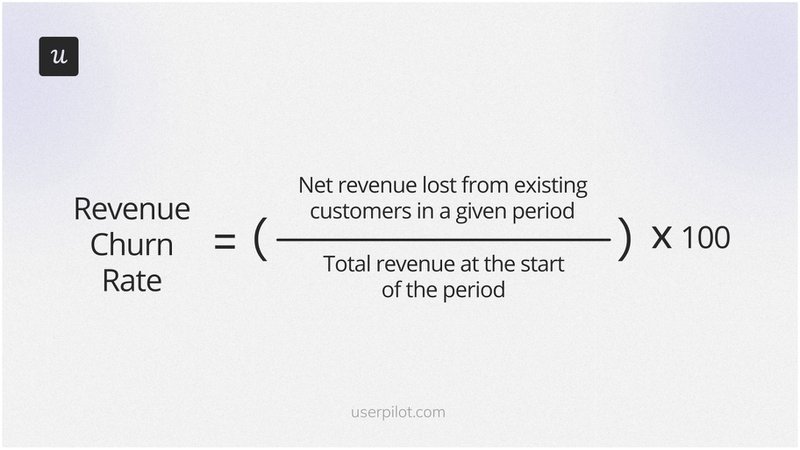
Say the 50 churned customers (from our example) were all on your highest-tier plan, while the remaining 950 were on your lowest tier. Your revenue churn could exceed 5%, even though the customer churn rate stayed the same.
Step 2: Analyze your data to uncover the real causes of churn
Once you know how much churn you have, the next step is figuring out why. That requires collecting and comparing quantitative and qualitative data, like usage patterns, survey responses, and cohorts.
💡 Doing all that analysis in spreadsheets might lead to missing critical insights. A proper analytics platform makes this work faster, cleaner, and far more accurate.
Now, let’s go through the customer data types you should collect and how to use them.
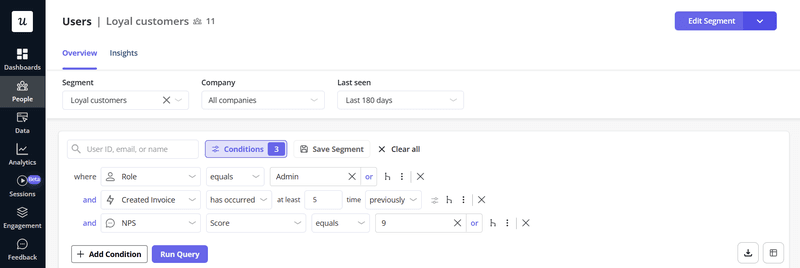
Segment churn data to identify patterns
Aggregate churn doesn’t exactly show the full picture. Let me explain:
Your SMB can have a “healthy” 5% monthly churn, while there’s a 30% churn rate in a crucial new-user cohort. But you’d never see it unless you break down the data.
Segmentation reveals these losses. Here are some crucial segments to start with:
- By signup date (cohort analysis): Did users who joined after your UI redesign churn faster? Cohort analysis answers this question. It shows whether a feature launch, campaign, or onboarding flow unintentionally hurts retention.
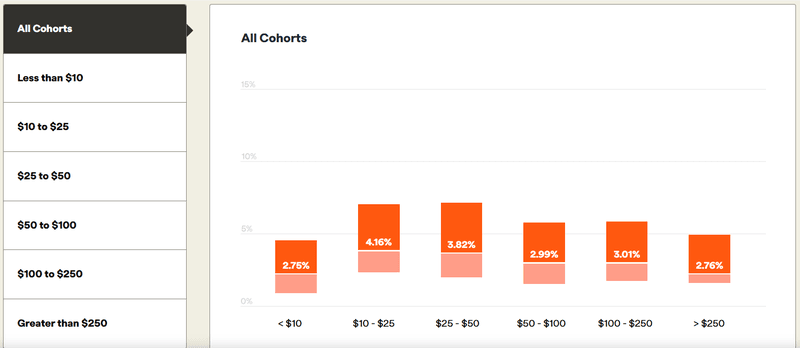
- By plan type: Did you lose more customers from the “Pro” plan than the “Starter” plan? In this case, you might have a value gap. It’s also common: subscriptions under $10 ARPC see ~4.16% monthly churn, while those above $250 see just 2.76%. Segmenting by plan tells you where customers feel the product isn’t worth it.
- By user persona: Is one user group (e.g., marketers) leaving at a higher rate than another (e.g., developers)? This means you’re likely missing the mark for a key use case. Persona-based churn shows which audiences you’re failing to support.
- By engagement level: How does churn differ between power users and infrequent users? Power users churn for different reasons than low-engagement users. Grouping them separately helps you spot risks earlier.
Collect customer feedback to find the story behind the numbers
Numbers show what’s happening. Feedback tells you why. And you need to learn both whys, i.e., the final reason and the early warning signals. Here is how:
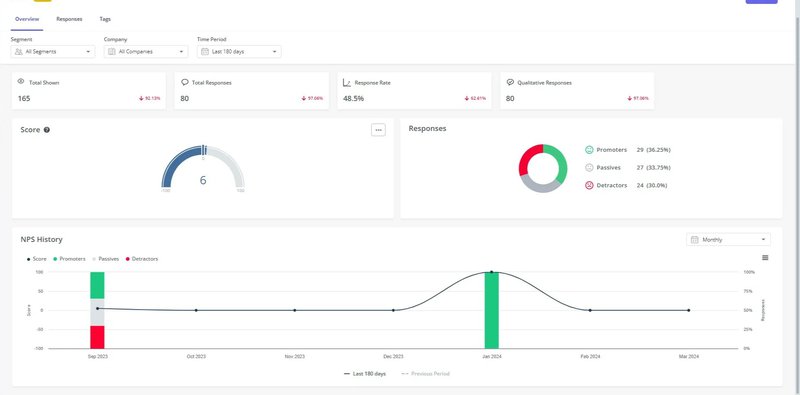
- Net Promoter Score (NPS) surveys: Companies with NPS ≥ 50 see 20% lower churn. But from my experience, the score matters less than diligently analyzing the answers to the follow-up questions: “What’s the main reason for your score?” These open-ended responses are early warning signals, and in-app NPS makes it easy to capture them while they’re still fresh and fixable.
- Exit surveys: This is where users tell you the unfiltered truth. And embedding a one-question exit survey (e.g., “What’s the primary reason you’re leaving?” ) inside your cancellation flow will suffice.
An all-in-one survey platform simplifies your work here. With one, you can target specific user segments, automate delivery, and connect survey results to usage analytics without messy integrations.
Behavioral analysis: Cross-reference what users say vs. do
This is where you check whether user feedback and actual behavior line up. And from experience, they often don’t.
A common pattern I’ve noticed in over a decade as a product manager: users tend to blame factors like “high pricing” for churning. But the real issue is that they never discovered the feature that would make the product worth the cost for them.
Pairing feedback with usage data (behavioral analysis) reveals the “issues” behind the surface excuses:
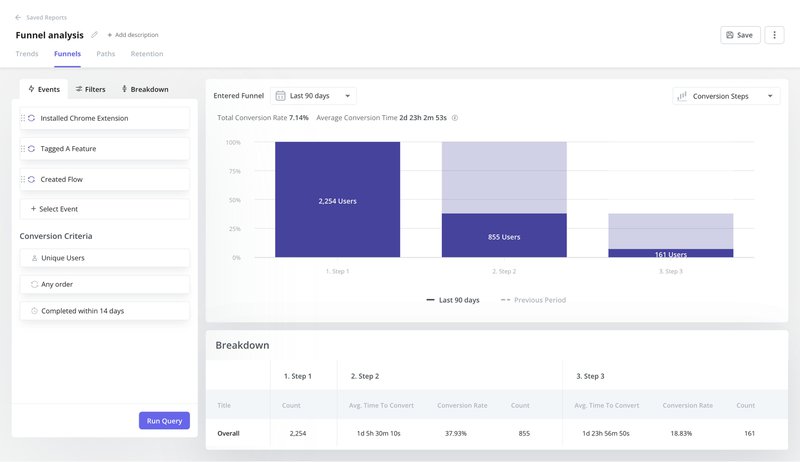
- Analyze feature adoption: Use funnel analytics to see whether churning users reached the activation events that correlate with long-term customer retention. If they didn’t, the issue is your onboarding, not your pricing page.
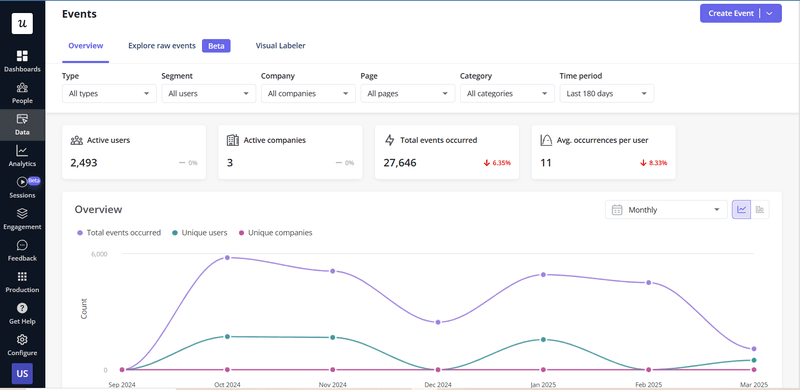
- Monitor engagement trends: Watch for drops in logins or session duration. A sharp decline two weeks before cancellation is one of the clearest churn indicators you can track.
- Look for friction signals: High error rates, abandoned tasks, repeated “undo” actions, or users getting stuck in loops all point to hidden UX problems. These behaviors appear long before a user hits “cancel.”
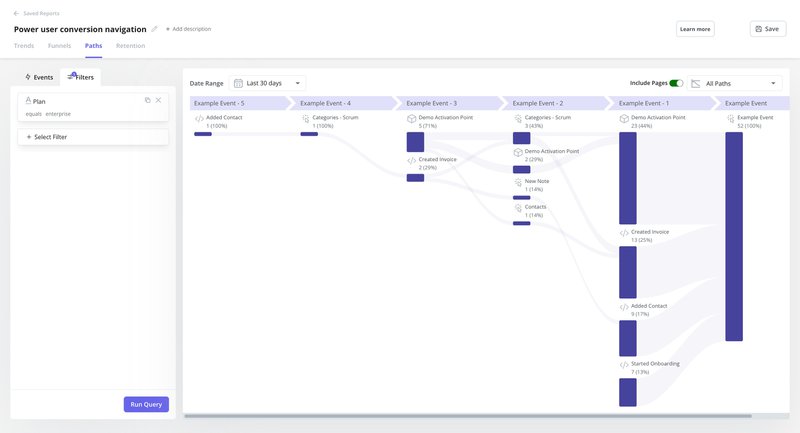
- Track the paths of churning users: Path analysis shows the exact actions churned users took before leaving and the moments that pushed them away. This way, you will see which elements malfunction, maybe it’s something in the UI or onboarding.
- Track happy paths: Don’t dwell only on why users leave; find out why the loyal customers stay too. Which features did they adopt early? Which workflows do they rely on repeatedly? The patterns will highlight behaviors that predict retention. Use them to shape onboarding and guide new users toward the same proven path.
💡 “Churned users’ path” + “happy path” gives you a blueprint: replicate the behaviors of your most successful users, and fix the patterns that drive others out.
As you collect all this data, document the patterns (segments, feedback, and friction points) in a central friction log. Doing this turns scattered insights into a prioritized, fixable roadmap for reducing churn.
Step 3: Use your findings to reduce customer churn
Once you spot patterns in your cohorts, surveys, or usage data, the next step is fixing the issues behind them. That’s the whole point of churn analysis.
But knowing why users leave isn’t the same as knowing what to do next. To make this easier, I described some of the most common churn drivers, paired with clear, practical actions you can take to address each.
Problem 1: High churn in the first 14 days
Users have never reached the “Aha!” moment, nor adopted sticky features, and churn before they reach activation.
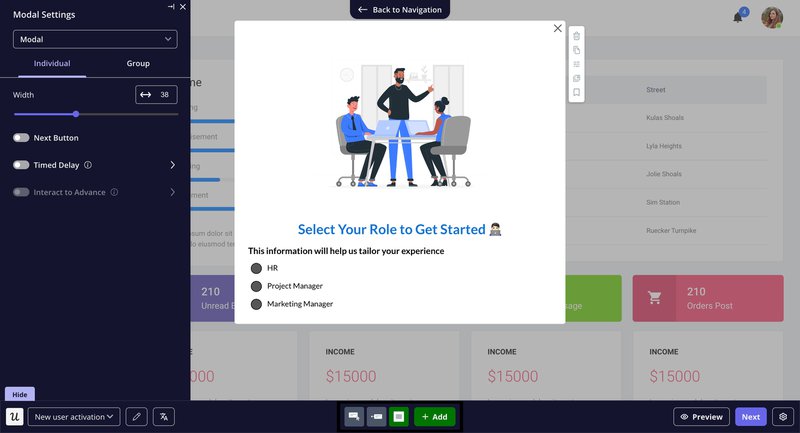
Action: Personalize onboarding. Use a short welcome survey to capture goals. Then, tailor the onboarding checklist so each user sees the features that matter most to them.
Once that’s done, turn core tasks into interactive walkthroughs tied to specific JTBDs. This helps new customers activate faster.
Problem 2: NPS detractors report confusion with an advanced feature
Some of the more tenured users become disappointed with the functions of the product that go beyond the basics.
Action: Add proactive in-app guidance. Target users who match the persona but show low feature adoption. Use tooltips, modals, and short tutorials to walk them through the feature step by step. For the high-value customers, CSMs can reach out directly with help or a quick call.
Problem 3: Exit survey answers “I couldn’t figure out how to do X.”
Users cannot take full advantage of the app, so much so that they cancel their subscription in frustration.
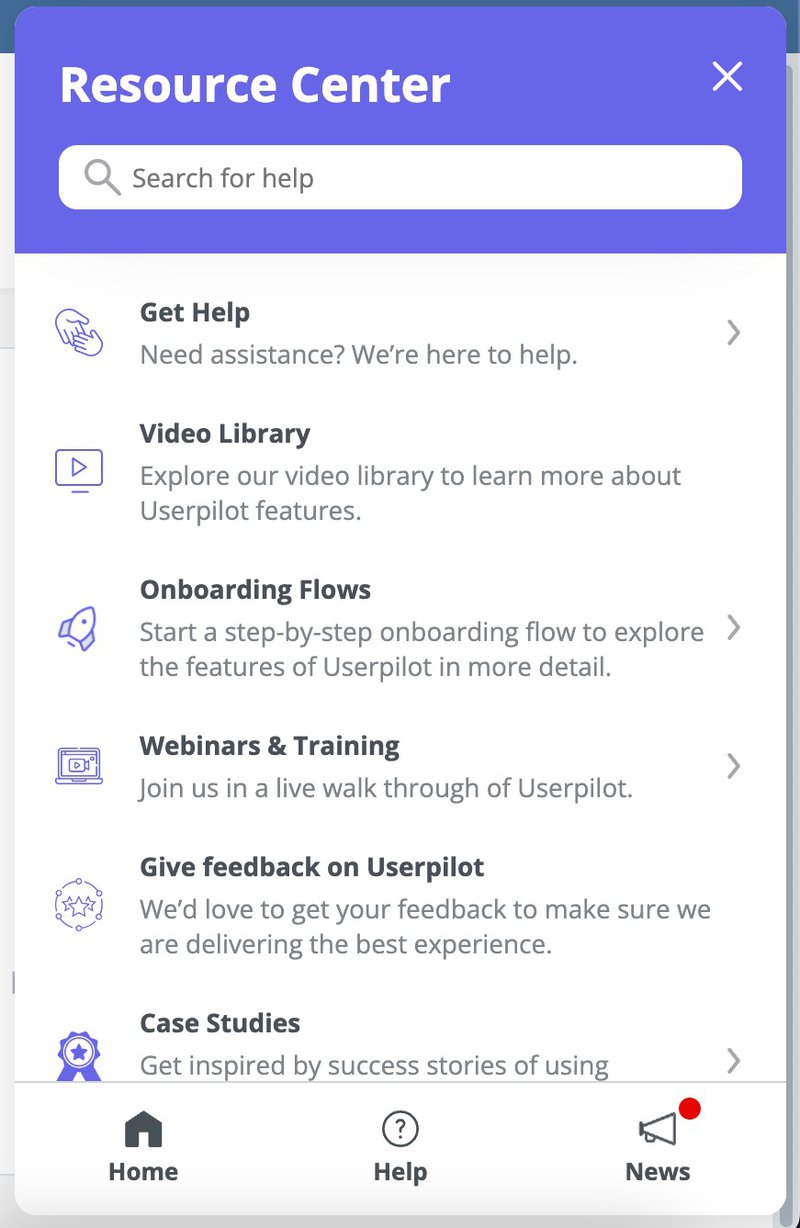
Action: Build an in-app resource center. The resource could be searchable guides, short videos, and troubleshooting steps (or a combo of the three). More importantly, make it easy to contact support through a chat widget or “Talk to us” button. This nudges users to get help before giving up.
Problem 4: Users abandon a core workflow halfway through
Feature adoption analysis reveals that one of the features is rarely used to the full extent of its potential by core user groups, leading to lesser engagement.
Action: Map the drop-off point and fix the friction. The fix here can be reducing steps, simplifying forms, improving loading speed, or even adding autosave. As you test each solution, use event tracking to validate what works.
Problem 5: Customers on the “Pro” plan churn more than “Starter” users
Users are disappointed by the value proposition of the paid plan. This is a clear signal that the product is underdelivering on its promises.
Action: Repackage or reposition the plan. Highlight Pro-specific features earlier in your onboarding flow. Then, you can increase in-app prompts that showcase Pro-only value. You could also adjust pricing tiers to better meet expectations.
Problem 6: Power users disengage slowly over time
The group that should remain loyal either starts using your product less frequently or even cancels.
Action: Set up health scoring and proactive outreach. Combine product usage, support history, and NPS data to flag accounts at risk. Then, trigger automated check-ins or account reviews. To get the best results, target high-value customers just before they churn.
Step 4: Advanced churn analytics: Build a predictive early-warning system
Reacting to churn is necessary, but it’s no longer enough. Modern product teams need to prevent churn, not just diagnose it.
That’s where advanced churn analytics come in. And it’s quickly becoming standard practice: nearly half of B2B SaaS companies now use churn-prediction models to stay ahead of disengagement. You should, too.
A strong predictive system gives you early signals, clearer priorities, and improves your chances of retaining customers. Here’s what the system should include:
- Develop a Customer Health Score: This combines signals such as login frequency, feature adoption, onboarding progress, and recent NPS feedback into one metric. Hence, a drop in the score is a pointer that customers need attention before they mentally check out.
- Tracks a product engagement score (PES): PES measures the breadth, depth, and frequency of product usage. In other words, it shows how often users engage with your core workflows. When the score slows down, that’s a sign of disengagement. This will prevent churn even before support tickets or negative feedback appear.
As your analytics maturity grows, you can layer in machine-learning models. These models sift through hundreds of behavioral signals to pinpoint at-risk customers with far greater accuracy.
The payoff is clear: you’ll know who needs help, why they’re slipping, and what intervention will keep them engaged.
Build a customer churn analytics engine
Churn is more than a bad KPI you report at the end of the month. It’s a feedback loop.
If you look closely, you’ll see it:
- Every existing customer who leaves is showing you where the product didn’t meet their expectations.
- Customer churn analytics brings those gaps into focus so you’re not guessing.
- When you combine that insight with real user feedback, you spot patterns early and stop firefighting. And now, you’ll start building products that retain existing customers.
Userpilot makes the entire process easy. It monitors churn, uncovers the ‘why’ behind it, and soon, will even predict customer churn and what actions to take.
Book a demo now and get ready for the AI features when they roll out!
FAQ
What are the most common causes of customer churn?
Customers don’t churn out of nowhere. Something pushed them out. Often, it comes down to a few patterns:
- Poor onboarding: The user never reached their “aha” moment. They signed up, got lost, and left before seeing real value.
- Unmet expectations: The product didn’t match what your marketing promised, e.g., confusing UX and workflows that are harder to adopt.
- Poor customer service: Users hit a roadblock, couldn’t get help, and felt ignored. Even a great product can lose loyal users if support drops the ball.
- Price vs. value mismatch: The cost didn’t feel worth it. And often, that’s a value perception issue and not just the price tag.
- Competitors offering more: If an alternative feels faster, cheaper, or easier, users will switch.
Once your customer churn analytics reveal the underlying issues, set up corrective and then preventive measures. This is how to fix your user experience, retention, and improve customer lifetime value.
About the author