Customer Engagement Analytics: How To Collect Analytics Data and Increase Customer Engagement


Thinking of using customer engagement analytics to improve customer relationships and increase user engagement?
Customer engagement analysis helps you understand your users’ buying behavior and sentiments. It helps you anticipate customer demand and gives you a competitive advantage.
If you’re looking to create and implement highly effective customer engagement strategies, then this article is for you!
Ready to get started? Let’s go!
What is customer engagement analytics?
Customer engagement analytics refers to measuring customer data from all interactions to evaluate customer health, identify preferences, and forecast future behavior.
What are the benefits of customer engagement analytics?
Want to build an effective customer engagement strategy for your SaaS? Then you need data. Customer engagement analytics provides that data, giving you the insights needed to make smart, strategic decisions. Here’s how it helps:
- Decode customer behavior: Forget guesswork. Engagement analytics shows you exactly all customer interactions with the product. You’ll see which features they’re using, where they’re getting stuck, and what’s driving their behavior.
- Identify and eliminate roadblocks: No product is perfect. Users will inevitably encounter friction points that disrupt their journey and hurt engagement. Engagement analytics helps you pinpoint these problem areas. Once you know where users are struggling, you can take action to remove those roadblocks.
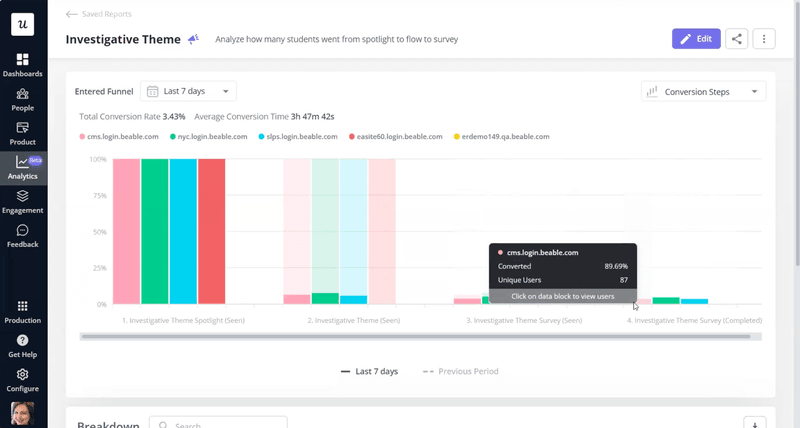
💡 For example, Beable Education uses Userpilot’s funnel analysis to track how students move through their educational content. This helps them identify any bottlenecks or areas where students are dropping off, allowing them to optimize the learning flow and improve engagement.
- Boost retention and build loyalty: Here’s where it pays off. By analyzing user behavior, you can identify different product use cases and tailor experiences accordingly. Personalized flows, based on actual user data, lead to increased engagement, improved retention, and ultimately, a significant reduction in churn.
![]()
Try Userpilot and Collect Actionable Customer Engagement Analytics Insights

Key metrics to measure customer engagement
While tracking customer engagement metrics is essential for every company, identifying the meaningful ones can be challenging.
Therefore here are five essential metrics that you can use to analyze your customer engagement processes.
Customer engagement score
The Customer Engagement Score (CES) is an essential metric that measures your current paid users and free trial prospects’ engagement.
This metric attempts to quantify user engagement and is reflected through a score based on several event values.
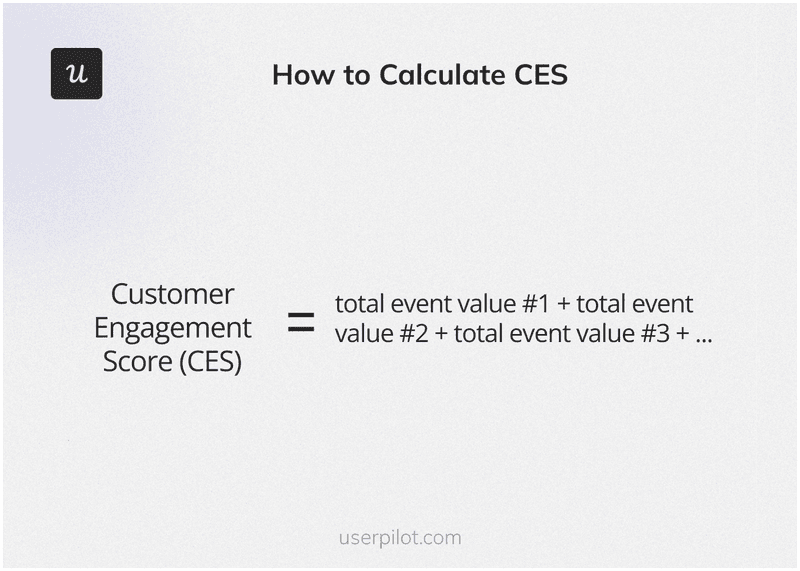
To calculate the CES, you need to first identify what events define customer engagement for you. For example:
- Frequency of Product Usage: How often do users open your software?
- Key Features: What features do your customers use the most often or don’t?
- Customer Upgrades and Renewals: How often do customers switch to the next paid tier or renew their subscriptions?
- The Number of Support Tickets: How many tickets, within a given period, are issued by customers? Additionally, how many are solved?
The events mentioned above can vary between products and companies. They can differ in terms of importance from one SaaS company to another.
Once you’ve defined all the events, you can sum their scores to measure your customer’s overall success, health, and engagement.
Product stickiness
Product stickiness refers to users’ tendency to return to your product because they find value in it and are highly engaged by it.
Measuring this metric helps you identify scopes for providing account expansion opportunities, improving customer retention, and increasing CLV (customer lifetime value).
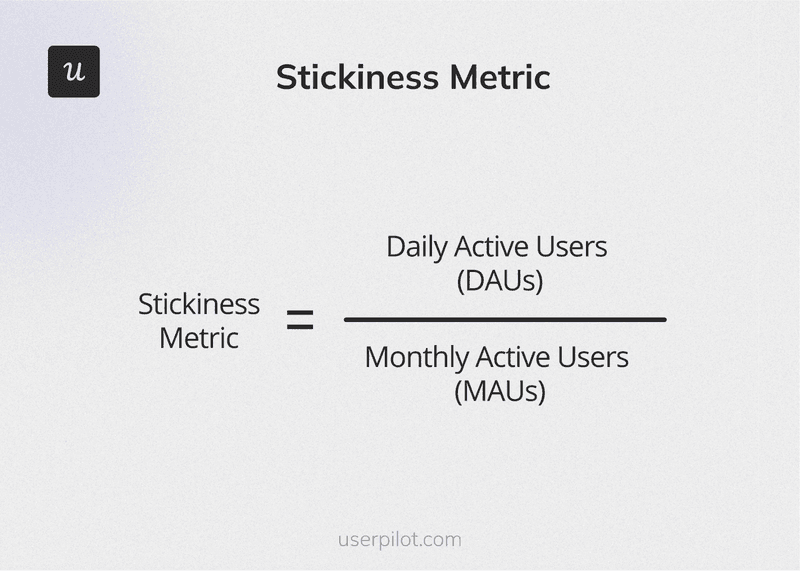
The DAU to MAU ratio is one of the best ways to measure product stickiness. To calculate this for a given period, you need to find out the number of daily active users and monthly active users and then divide them as shown in the image above.
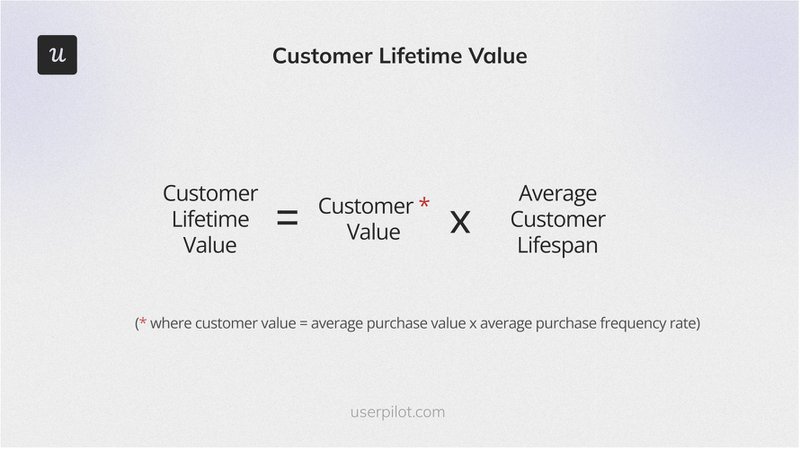
Customer lifetime value
Customer Lifetime Value (CLV or LTV) is the average amount of money your product gets from one customer over the entire duration of their relationship with you. In other words, it is an estimation of the net profit one customer can bring you in the future.
To calculate the CLV, you need to first find out the average revenue of the account(s) whose total lifetime value you’re trying to measure. Then, divide this by your existing customer churn rate.
CLV is a crucial indicator of customer engagement as it is directly connected to customer retention. Additionally, it is a predictive metric that aids in the improvement of financial decisions for your SaaS business.
Customer Satisfaction Score
The Customer Satisfaction Score (CSAT) measures how satisfied your current users are with your product and helps you understand their expectations. For example, you can use this metric to gauge customers’ satisfaction levels with your product’s features or customer service quality.
A high CSAT score shows that your efforts have exceeded user expectations, which leads to greater customer loyalty and retention and, consequently, reduced churn rates.
To calculate this, you need to first conduct a survey where you ask existing users how they feel about a certain product or feature. Here’s an example built with Userpilot.
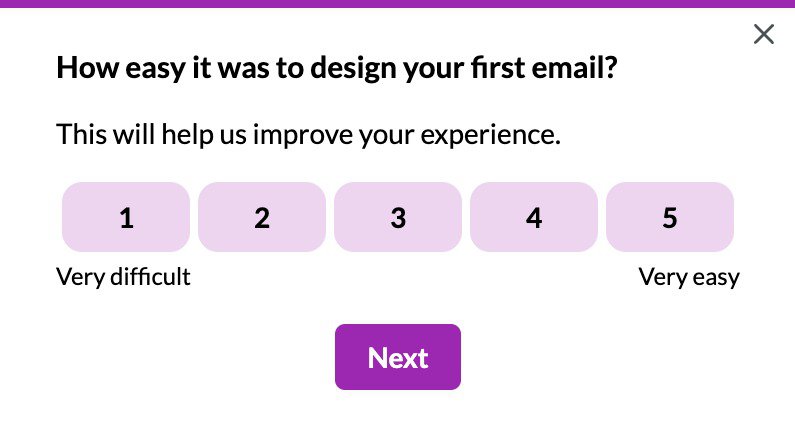
The score is calculated by dividing the number of respondents who are highly satisfied by the total number of people who answered the survey.
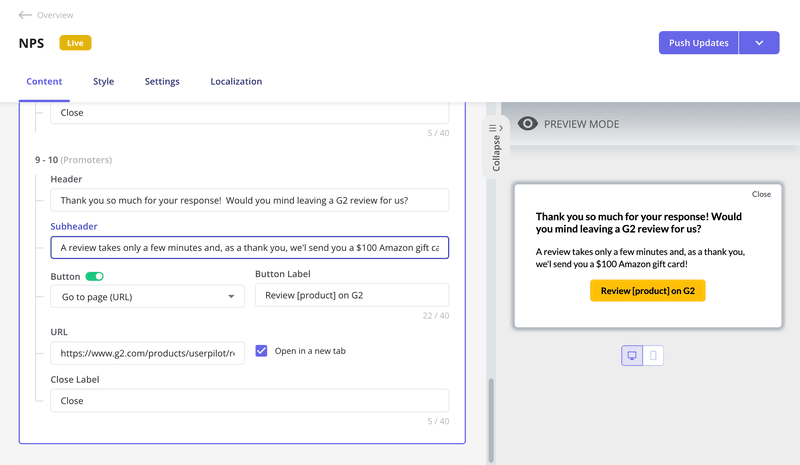
Net Promoter Score
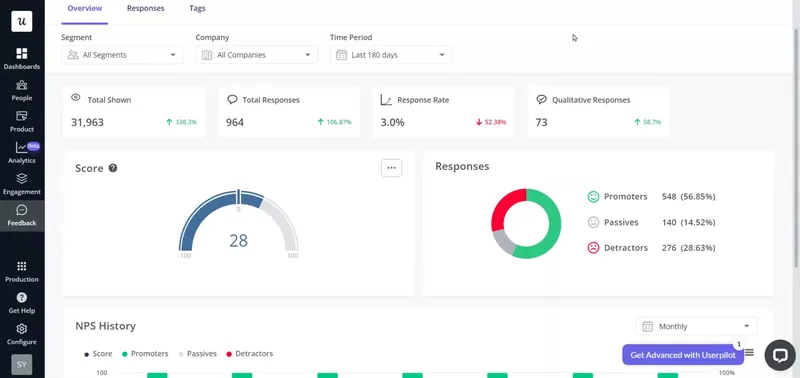
The Net Promoter Score (NPS) measures the likelihood of your users promoting your product. A high NPS shows that users are very happy with your product. They are likely to suggest your product to their friends, family, or colleagues, thus directly contributing to your product’s growth.
To measure this, you must conduct a survey asking your customers a singular question, “How likely are you to recommend us to a friend or colleague on a scale from 1 to 10?”
NPS divides your respondents into three categories:
- Users selecting 9 or 10 are your most loyal customers. They are highly engaged customers who are advocates for your brand.
- Passives are users who select 7 or 8. They are neutral customers who are not harmful.
- Detractors are users responding with a 6 or below. They are particularly dangerous as they can ruin your brand image through negative word-of-mouth.
Using your survey and the total number of respondents, you can calculate your score by subtracting the percentage of detractors from the percentage of promoters. Usually, this should be calculated automatically using a tool like Userpilot.
Additionally, customer feedback from the follow-up questions of NPS surveys is a great source of actionable insights into the reasons behind scores. You can also leverage it for making product improvements.
💡 For example, Unolo, a field service management software, used Userpilot’s NPS surveys to easily track their score and understand customer sentiment. They found that by closely monitoring their NPS and addressing the feedback from detractors, they were able to reduce churn by 0.5% to 1%.

How to collect customer engagement analytics data?
Here are four proven ways to collect accurate and relevant data for customer engagement analytics.
Track in-app interactions to understand how customers are engaging with your product
Tracking customer interactions within your product is a great way to collect data about customer engagement and find how users spend their time on your product.
For example, you can see where users’ cursors are hovering or clicking the most.
With Userpilot’s auto-capture, you can easily track all kinds of interactions automatically.
![]()
Customer Engagement Analytics Made Easy with Userpilot!
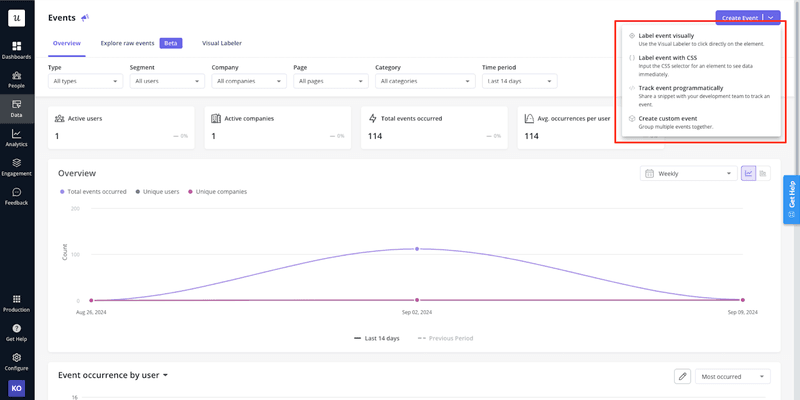
Group events to track engagement across a specific customer journey
Grouping events is a technique that allows you to track and analyze how customers interact across specific customer journeys.
Instead of looking at isolated actions, you can combine related events into meaningful sequences. This helps you understand how users are progressing toward a desired outcome.
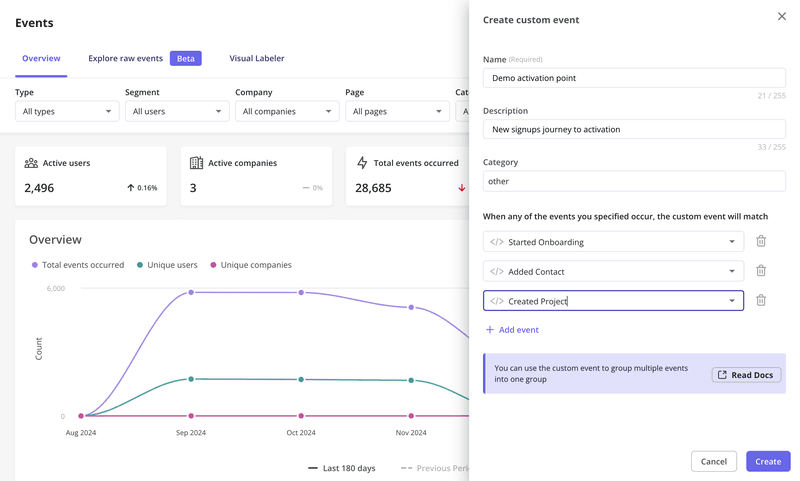
Let’s say your data shows that only 50% of users who create an account (“Account Created”) actually use your key feature (“Key Feature X Used”).
By analyzing the event group, you discover that a large percentage are dropping off after the “Profile Completed” step. Further investigation (maybe using session recordings) reveals that the profile form is too long and confusing. Then you can focus your effort on simplifying the form.
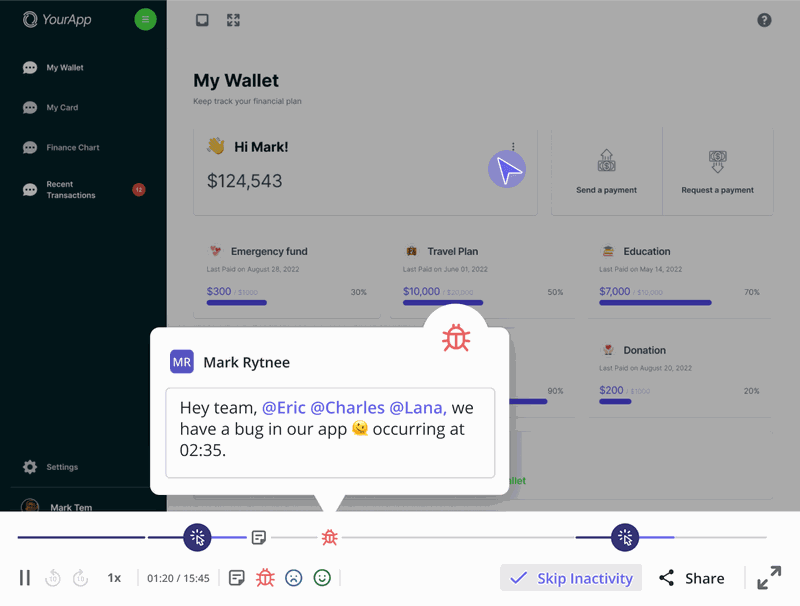
Use session replay to pinpoint reasons behind high and low engagement
Session recordings are a powerful tool for customer engagement analytics because they provide a visual, qualitative understanding of user behavior.
Think of them as “over-the-shoulder” views of users interacting with your product or website. By watching these recordings, you can pinpoint the specific moments and actions leading to high and low engagement.
With Userpilot’s session replay, you can even filter to watch sessions of inactive customers, for example, to see what makes them drop off.
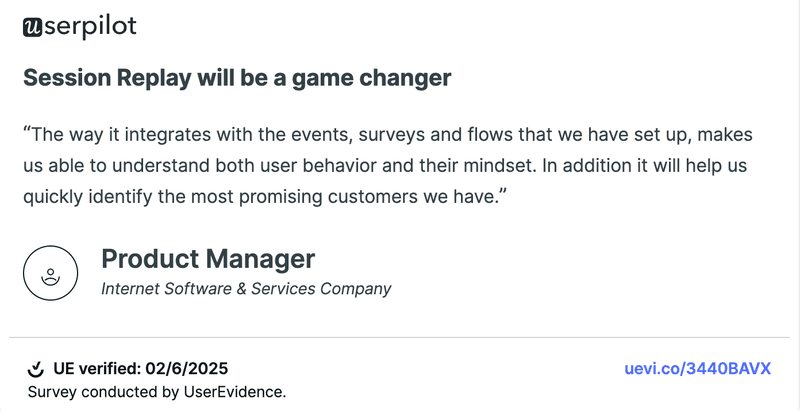
As our users put it:
Send surveys to collect direct feedback from customers
Do you want to understand customer engagement? Then you need to ask your customers directly.
But don’t just send out random surveys and hope for the best, you should be strategic about it: Think of key moments in the customer journey like post-onboarding, after a new feature release, or even after a support interaction.
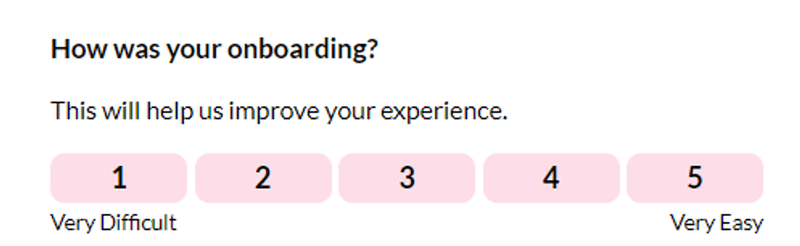
It’s also a good practice to combine close-ended and open-ended questions so you know why customers give a certain rating or score.
How to leverage analytics data and improve customer engagement
Now that you know how to collect data effectively, here are four strategic ways you can use it to improve customer engagement.
Segment customers based on engagement and send personalized marketing messages
With the data you’ve collected, you are likely to see that your existing customers have varying engagement levels with your product, which can be used for customer segmentation.
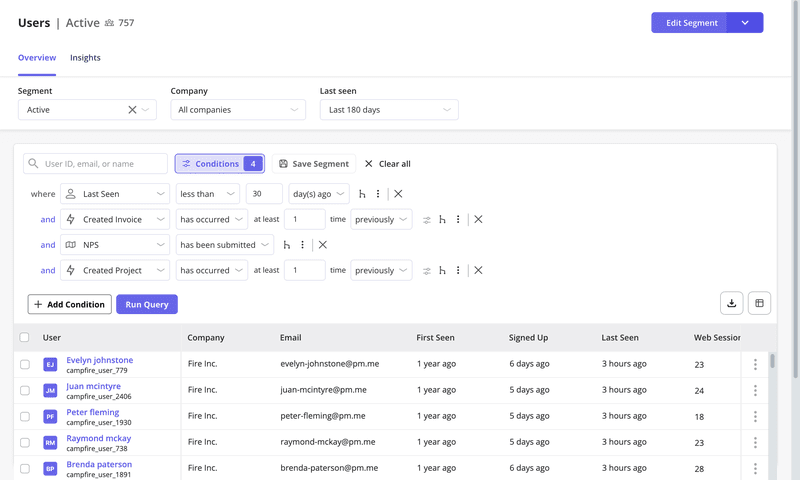
With this, you can create precise segments consisting of inactive customers, regular users, and highly engaged users. You can then send them personalized messages and create custom flows relevant to their use case.
For example, you can encourage your regular users to switch to the next tier, unlock more features, and gradually become power users.
Userpilot allows you to segment customers by different attributes, such as user data, company data, user feedback, features, events, etc.
Implement a loyalty program to engage loyal customers and make them power users
Your product’s most loyal users deserve to be treated specially. You can do this through loyalty programs that award highly engaged customers. This keeps them even more engaged and motivated.
You can also nudge them to become your power users if they aren’t already. “Power users” are your most valuable users who have reached full product activation, i.e., they are subscribed at the highest possible tiers, have access to all the features, and use your product regularly.
Identify lapsed customers and try to re-engage them
Customer segmentation grants you opportunities to identify lapsed or inactive customers and re-engage them. As they are not using the app, you can send them an email in an attempt to win them back.
Here’s how Eversign sends one.
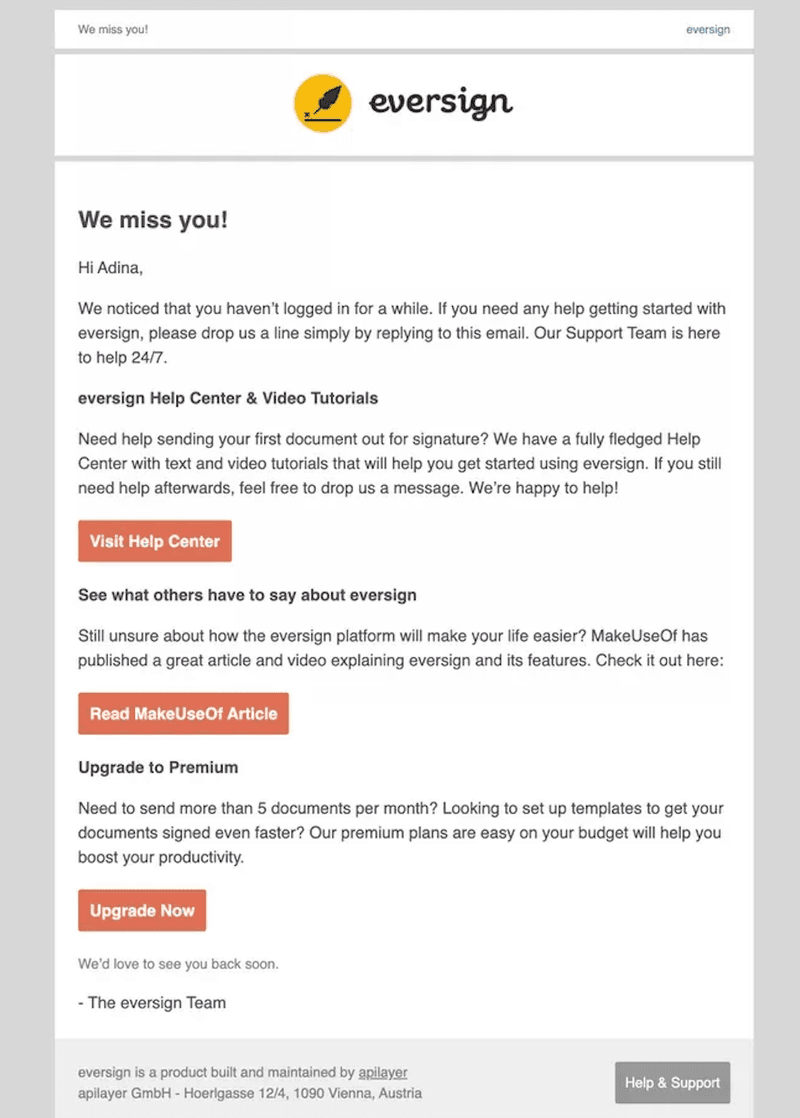
Additionally, you can ask your customers what aspects of your product made them lose interest. This can be sent as a cancellation email once users have churned completely or be included in the re-engagement email.
With this insight, you can create a smarter win-back strategy to bring them back to the app.
Looking for a customer engagement analytics tool?
Analyzing customer engagement involves much more than just comprehending their purchasing patterns. It takes into account a wide range of other user interactions, including social media mentions, website visits, and customer service feedback that also provides information and value to the company.
Customers who are highly engaged are more likely to upgrade your service. But for building and maintaining such loyalty, customer engagement analysis is essential.
Want to track in-app engagement, and collect customer data for customer engagement analytics? Get a Userpilot Demo and see how you can increase revenue and customer loyalty and foster stronger relationships with your users.
![]()
Try Userpilot for Effective Customer Engagement Analytics!
FAQ
What are the 4 pillars of customer engagement?
While there isn’t one universally accepted framework, the four pillars of customer engagement are often considered to be:
- Value: Providing customers with valuable products, services, and experiences.
- Relevance: Delivering the right message, to the right person, at the right time.
- Communication: Establishing open and consistent communication channels with customers.
- Emotional connection: Building a relationship with customers that goes beyond transactions.
What does a customer engagement analyst do?
A customer engagement analyst collects, analyzes, and interprets data related to customer interactions and behavior. They identify trends, patterns, and insights to help companies improve customer engagement strategies, optimize user journeys, and drive business growth.
What is engagement analytics?
Meaning the same as customer engagement analytics, engagement analytics is the process of tracking, measuring, and analyzing how users interact with a product, website, or brand. It provides data-driven insights into user behavior, preferences, and engagement levels, which can be used to improve the user experience and achieve business objectives.
About the author