
Tracking customer engagement can feel overwhelming—so many metrics, so much data, and no easy way to make sense of it all. That’s where a customer engagement dashboard comes in. Instead of digging through scattered reports, you get a clear, visual overview of how users interact with your product, helping you make smarter, data-driven decisions.
In this article, I’ll break down what a customer engagement dashboard is, why it’s essential, and the key metrics you should track to optimize user experience and retention. Plus, I’ll walk you through how to build one tailored to your business needs.
What is a customer engagement dashboard?
A customer engagement dashboard helps you collect customer engagement data in one place, providing an instant overview of user interactions with your product.
It also helps with data visualization and making data-driven changes to the customer journey.
Why do you need a customer engagement dashboard?
A user engagement dashboard comprises text, graphs, images, data points, etc., that summarize your engagement data over specific periods.
This makes it easy to interpret critical customer data—you can simply pull out the information and immediately know how the company has been performing.
Engagement dashboards also enable you to make data-driven decisions. You can conduct experiments and check the engagement data to know if your hypothesis was right or not.
Access to user data also translates to increased productivity, as your team wouldn’t have to be second-guessing its steps.
Types of customer engagement metrics to track using the customer engagement dashboard
This section shows you a list of important metrics to track with your customer dashboards.
Before we get into it, it’s worth noting that the examples below are not universal. Your goals may be different and you may have different needs based on your customers.
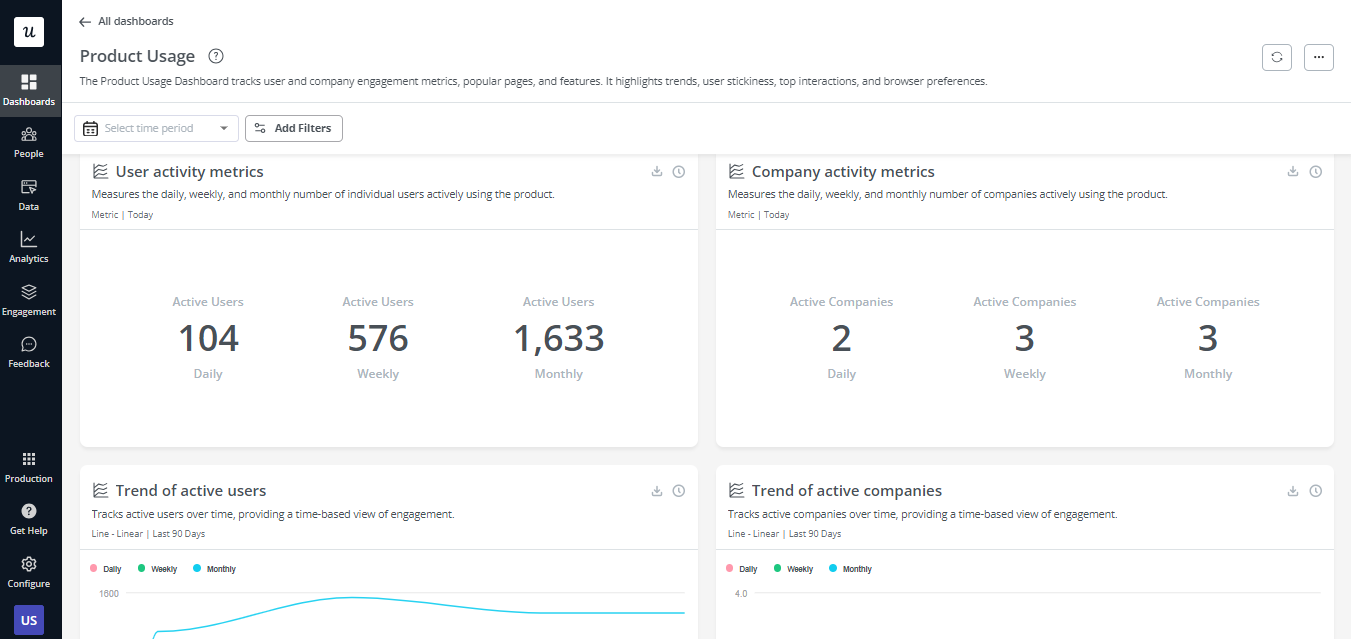
Product usage metrics
Product usage data helps you understand how and when customers interact with your product. By tracking the right metrics and key performance indicators, your team can see what features customers love the most, identify friction points, pinpoint improvement areas, etc.
👉🏻 Examples of product usage metrics to track:
- User stickiness: Tells you the rate at which customers log in to use your platform. Product stickiness varies depending on how often the ideal user needs to use your tool—some products require more frequent visits than others.
- Customer engagement data: Customer engagement score is a key metric that measures how engaged your existing customers and free trial prospects are.
- Most popular features and pages: This shows you the most popular pages and features your different users are engaging with over a specific period.
- User retention rate: This metric shows the percentage of daily/weekly/monthly user retention.
- Average session duration: This reports the average amount of time users spend on the product per session.
How are you currently tracking customer engagement?
Understanding your starting point helps tailor the right solution. A good customer engagement dashboard centralizes this data.
New user activation metrics
Tracking new user activation metrics helps businesses understand how effectively they are onboarding and engaging new users, which is crucial for improving user retention and overall product success.
👉🏻 Examples of new user activation metrics to track:
- New sign-ups: The number of new users who register or sign up for your product or service within a specific time frame.
- Activation rates: The percentage of new users who complete a specific action or reach a predefined milestone that indicates successful activation, such as completing their profile setup or making their first purchase.
- Time to activation: The average duration it takes for new users to complete the activation process and begin actively using the product or service after signing up.
Core feature engagement metrics
Tracking core feature engagement metrics is essential for optimizing product performance and ensuring overall customer satisfaction levels.
By monitoring how users interact with the key functionalities of your product, you gain valuable data about their preferences and behaviors. This information enables you to prioritize enhancements and updates to those core features, ultimately improving the overall user experience.
Additionally, understanding core feature engagement helps in reducing churn by identifying users who may be at risk of disengagement or abandonment.
👉🏻 Examples of feature engagement metrics to track:
- Number of unique users: The count of distinct individuals who have interacted with a feature within a specified time frame.
- Adoption rate: The percentage of users who have adopted (started using) a new feature out of the total user base.
- Average usage: The average amount of time or frequency users spend using a feature.
User retention metrics
Tracking user retention metrics is essential for assessing the long-term viability and success of a product or service. It helps businesses understand how effectively they are retaining users over time.
By monitoring retention rates, businesses can identify trends, patterns, and potential issues in user behavior, allowing them to make informed decisions to improve their product or service, enhance user experience, and ultimately drive sustainable growth.
👉🏻 Examples of user retention metrics to track:
- Daily/weekly/monthly retention rates: Percentage of users who return to use the product/service daily/weekly/monthly.
- Daily/weekly/monthly retention trends: The trend in retention rates over time, indicates whether retention is improving, declining, or remaining stable.
Customer loyalty and support metrics
Customer loyalty and support metrics help you see how loyal and satisfied your users are and how likely they are to make repeat purchases. Armed with this data, it becomes easier to prevent churn and improve the overall customer experience.
👉🏻 Examples of customer loyalty and support metrics:
- Net Promoter Score (NPS): NPS is an 11-point scale that asks customers how likely they are to recommend you to friends. Customers who score you a 9 or 10 are called promoters, and they’re the most likely to remain loyal.
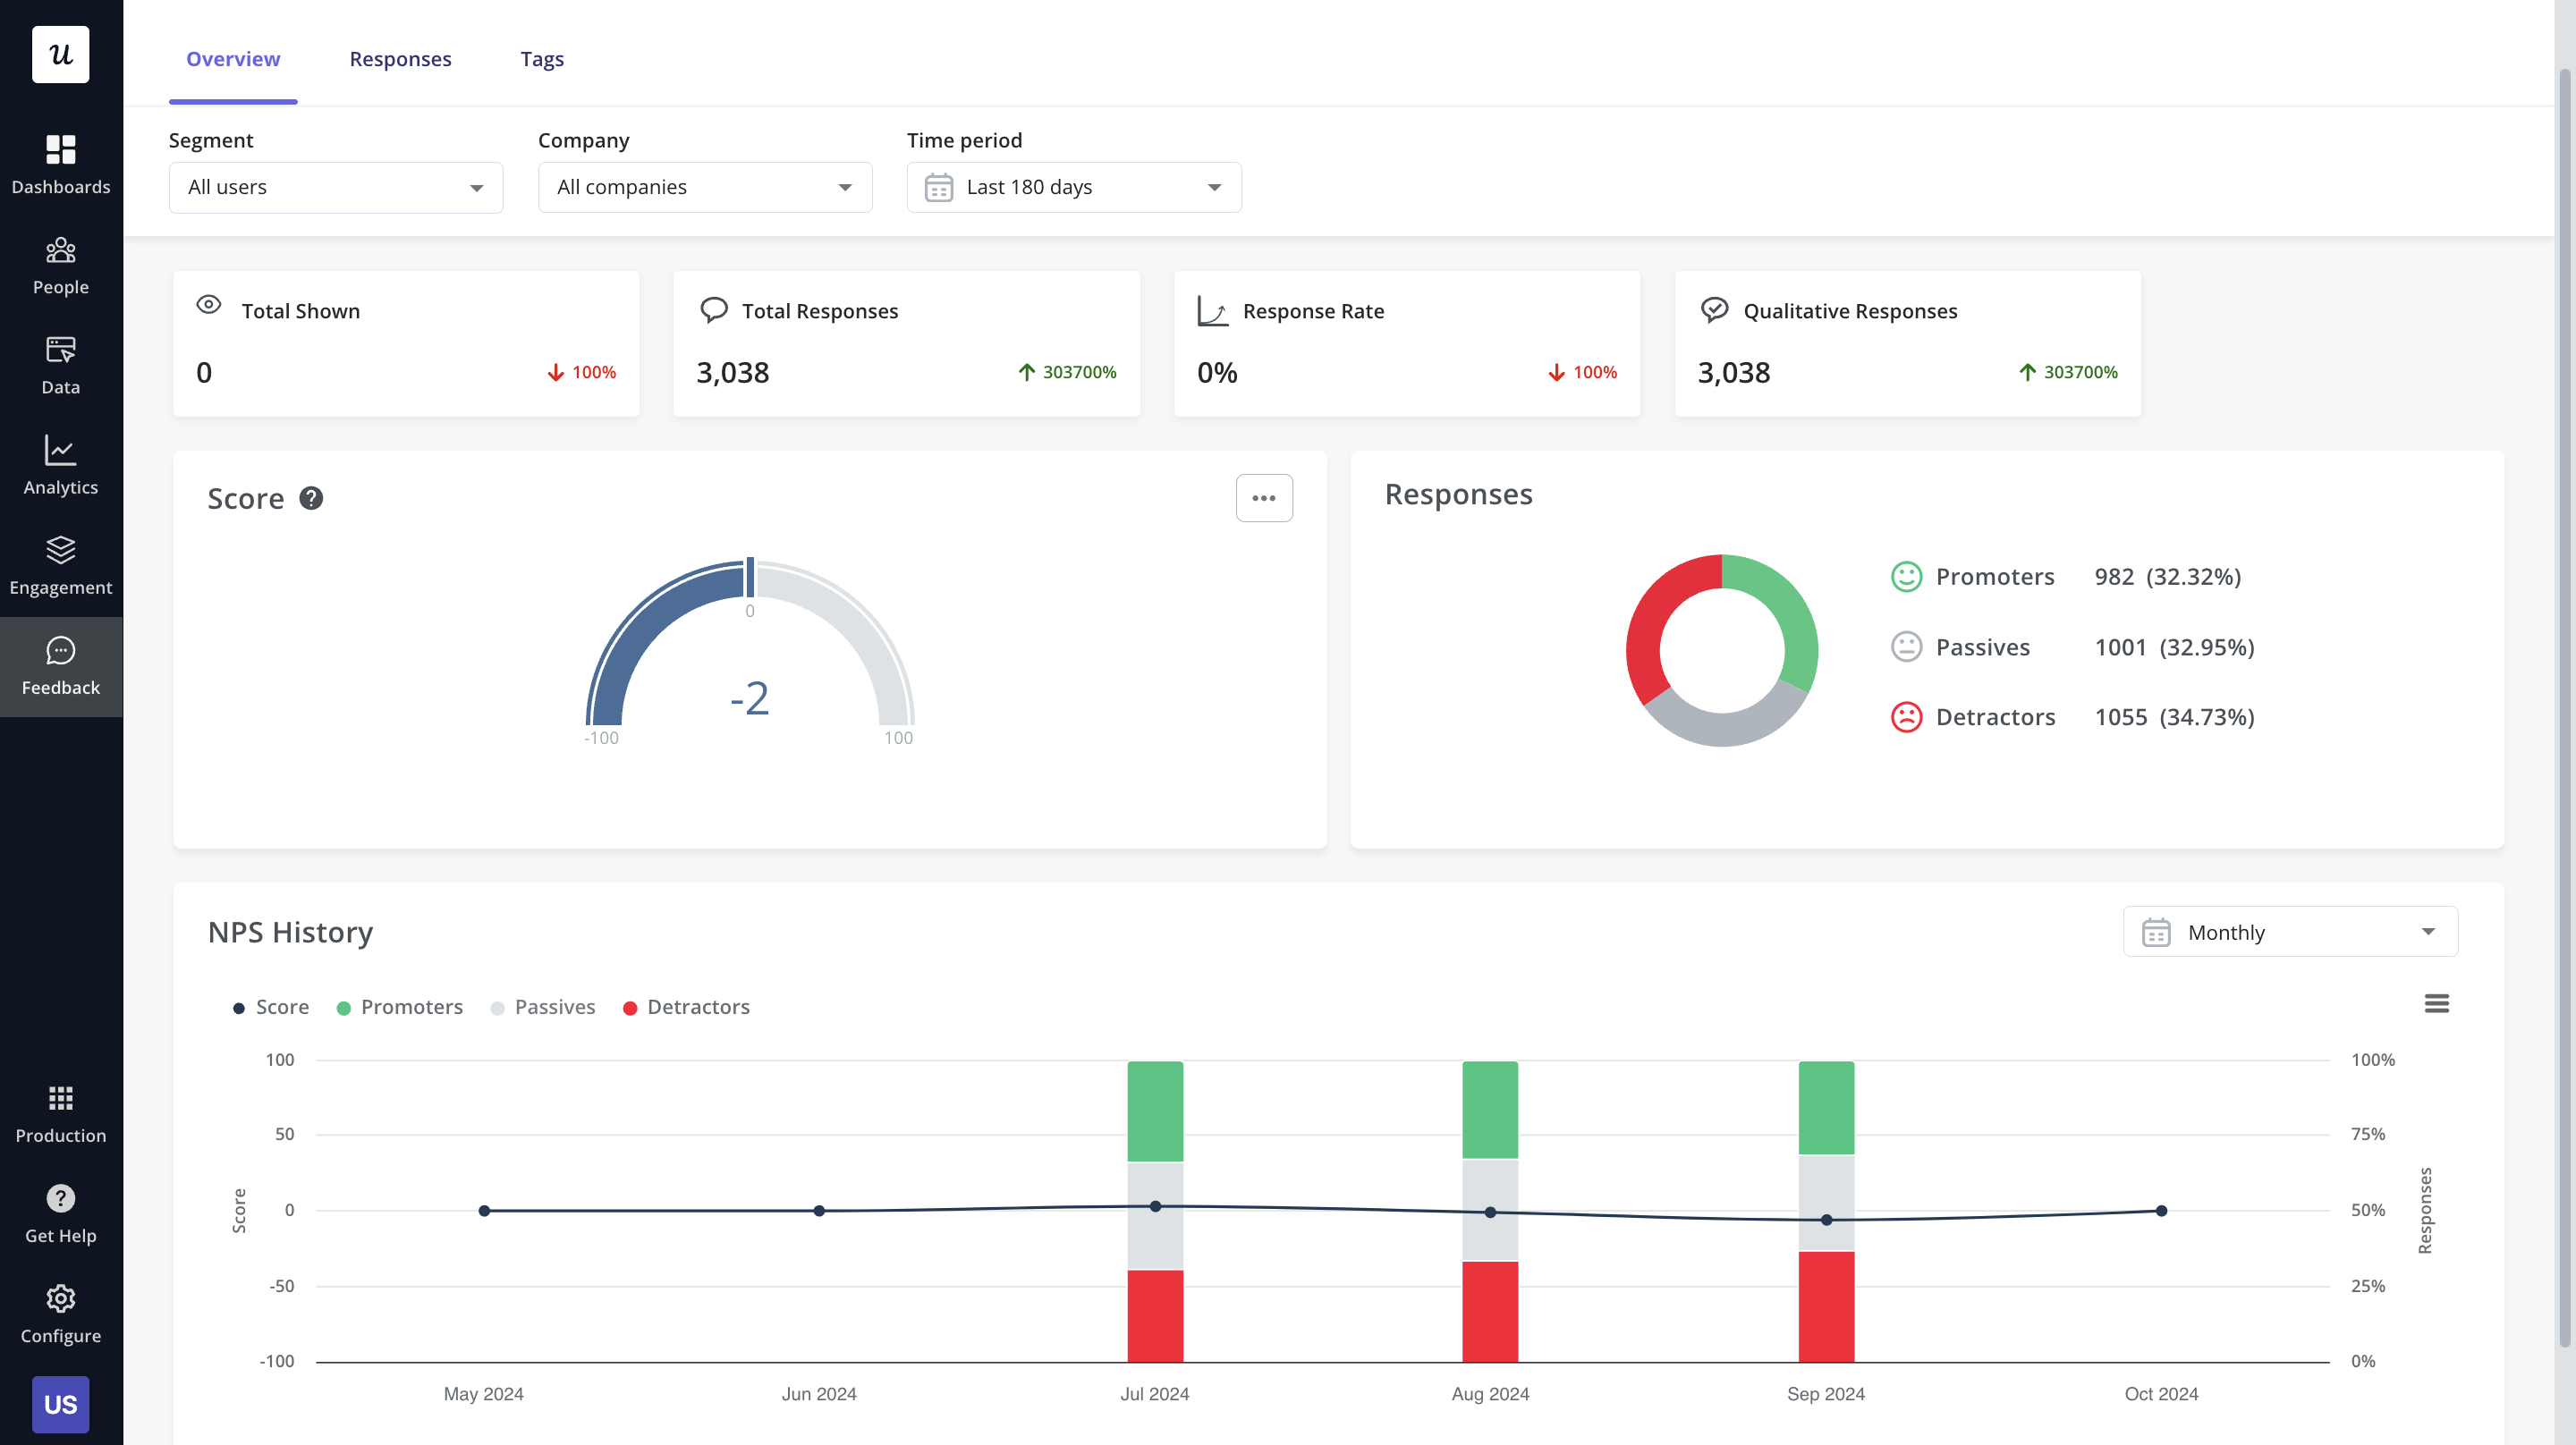
- Customer satisfaction score (CSAT): This metric is similar to NPS but more short-term. CSAT surveys typically measure customer satisfaction after a meaningful interaction with a feature.
- Customer effort score: This metric measures your product’s ease of use. It’s something you should constantly track to ensure your product remains intuitive.
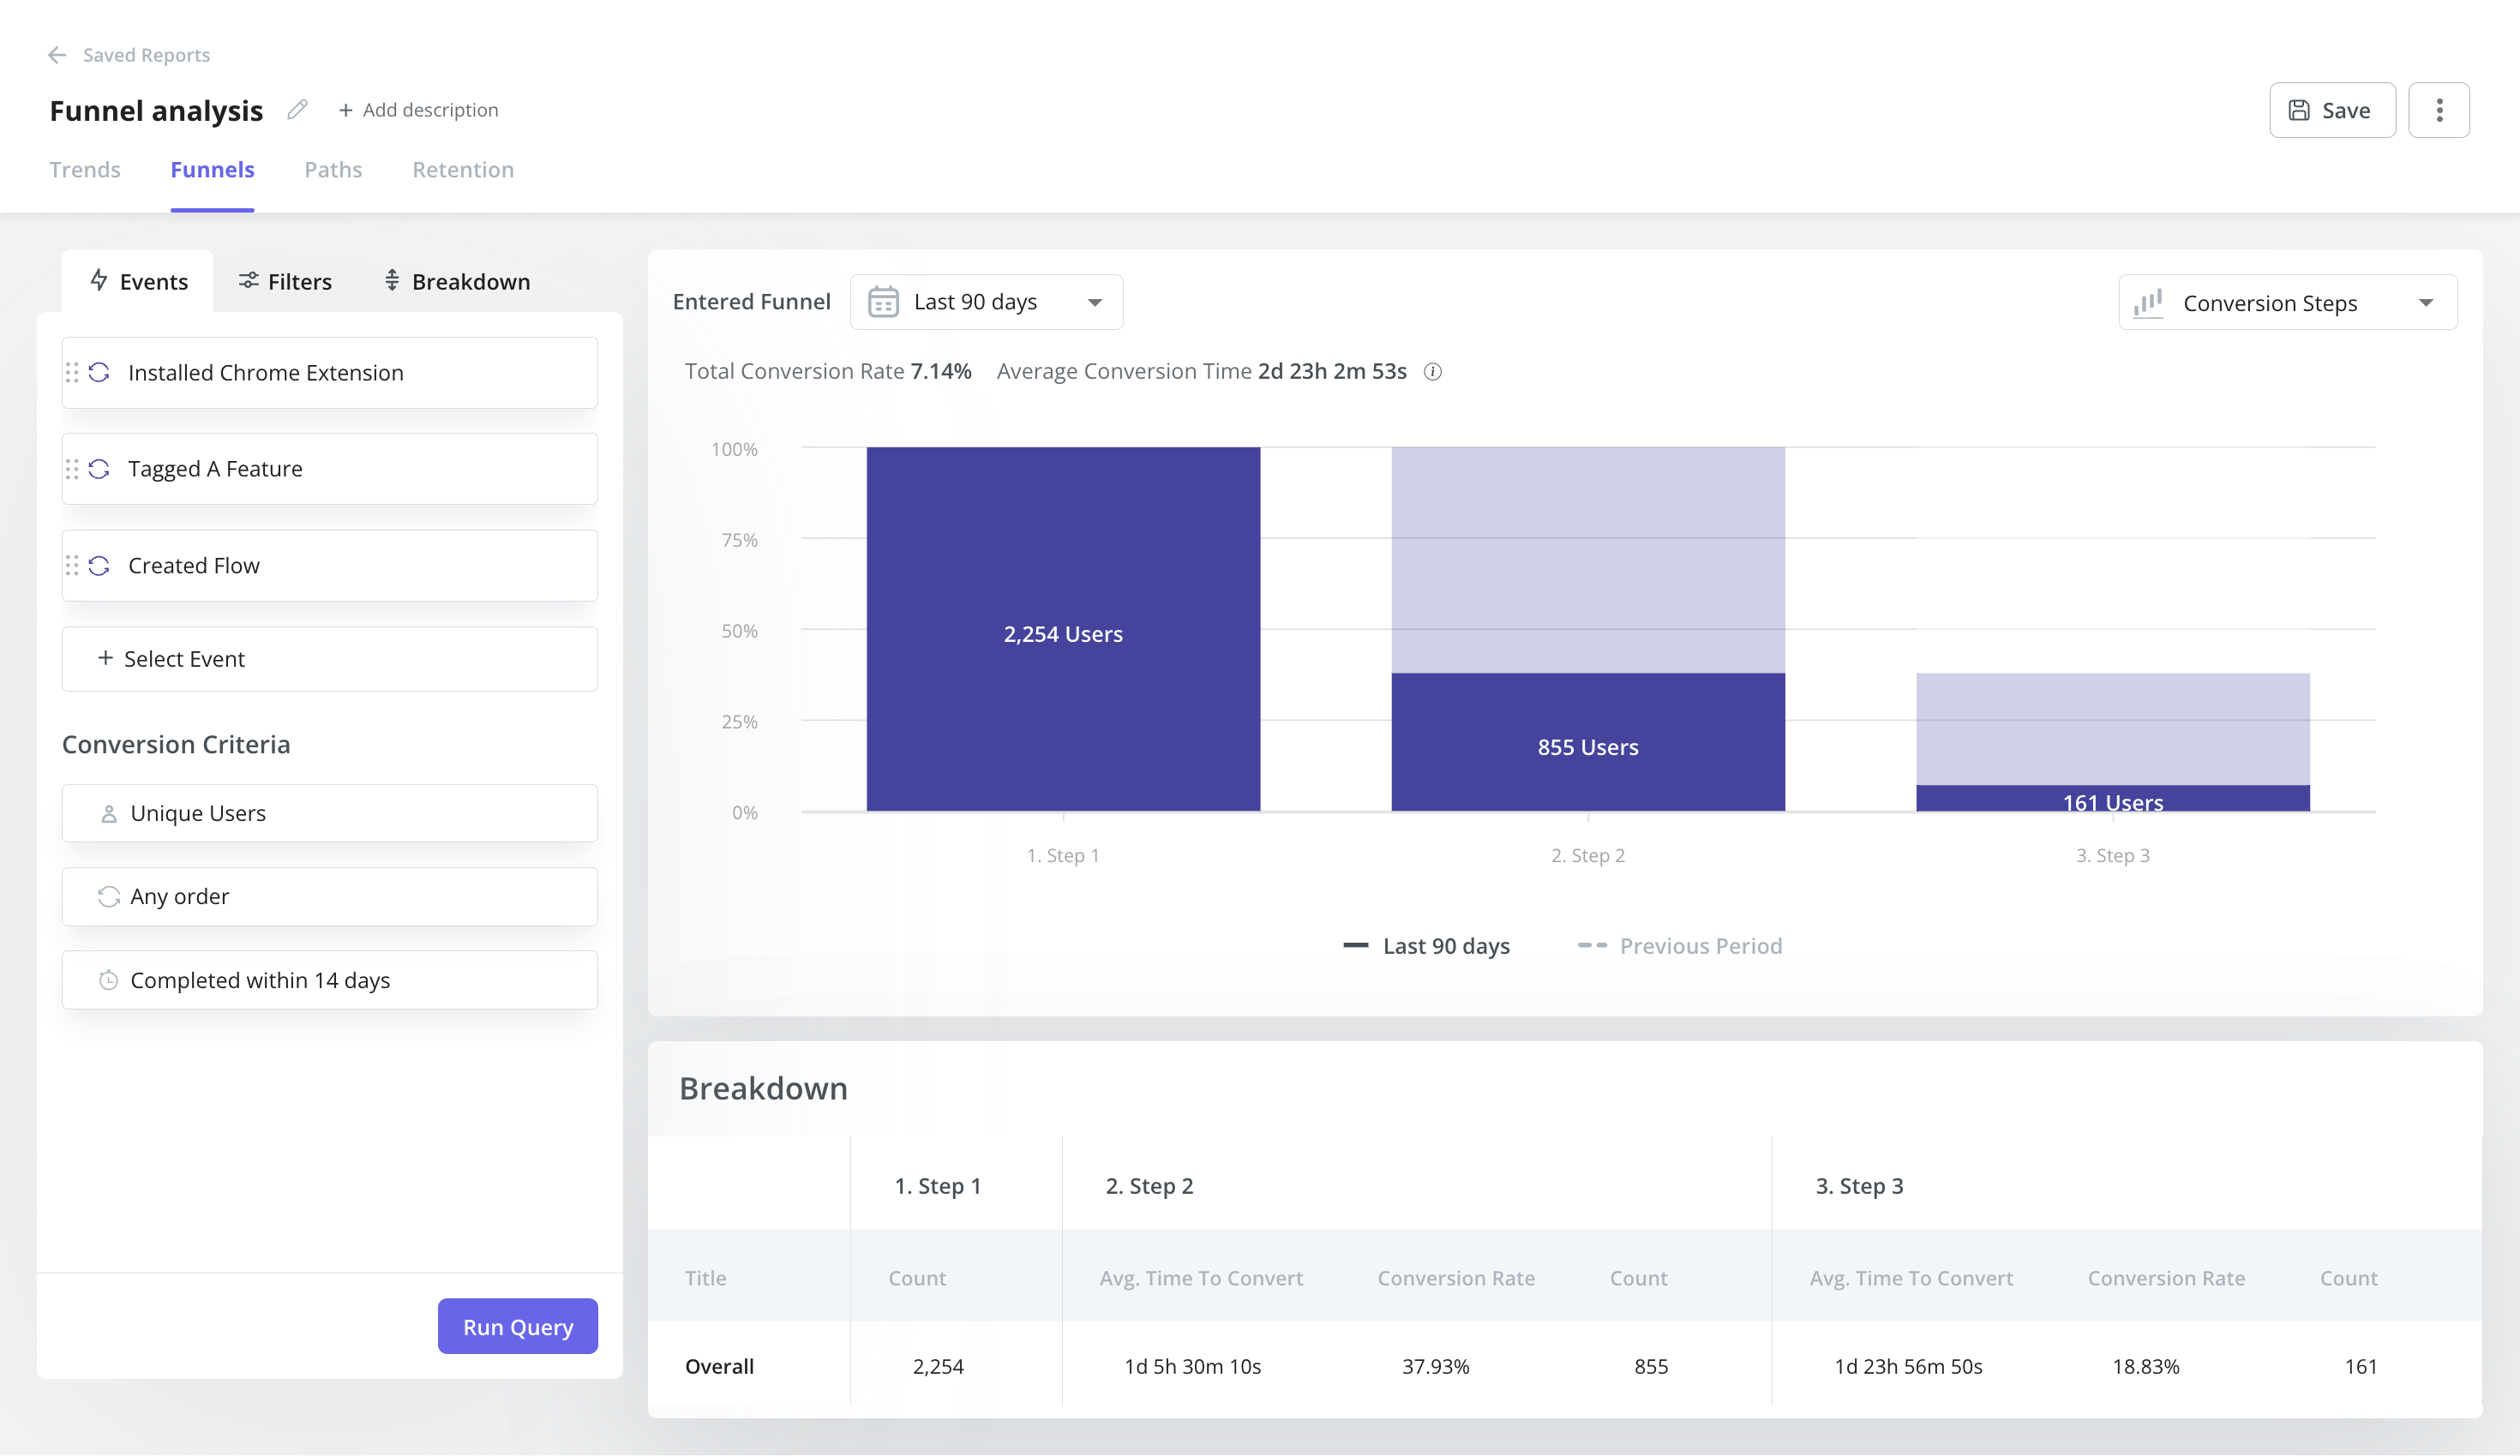
Customer funnel metrics
Funnel metrics are useful for measuring the effectiveness of your funnels. Start tracking your funnel analytics to know why users drop off and how to prevent that.
👉🏻 Examples of customer funnel metrics:
- Cost per acquisition: The cost incurred in pushing a lead down your sales funnel. Tracking this metric helps you test different acquisition strategies and see which works best.
- Customer Lifetime Value (CLV): The total money a customer spends with you throughout their use of your product. High retention means more CLV and increased revenue.
- Conversion rates: This metric measures the total number of users that convert from freemium to premium or trial to paid, depending on your pricing model.
How to build a customer engagement dashboard?
So far, you’ve seen the importance of customer engagement metrics and dashboards. It’s time now to build one for yourself.
Follow the step-by-step guide below:
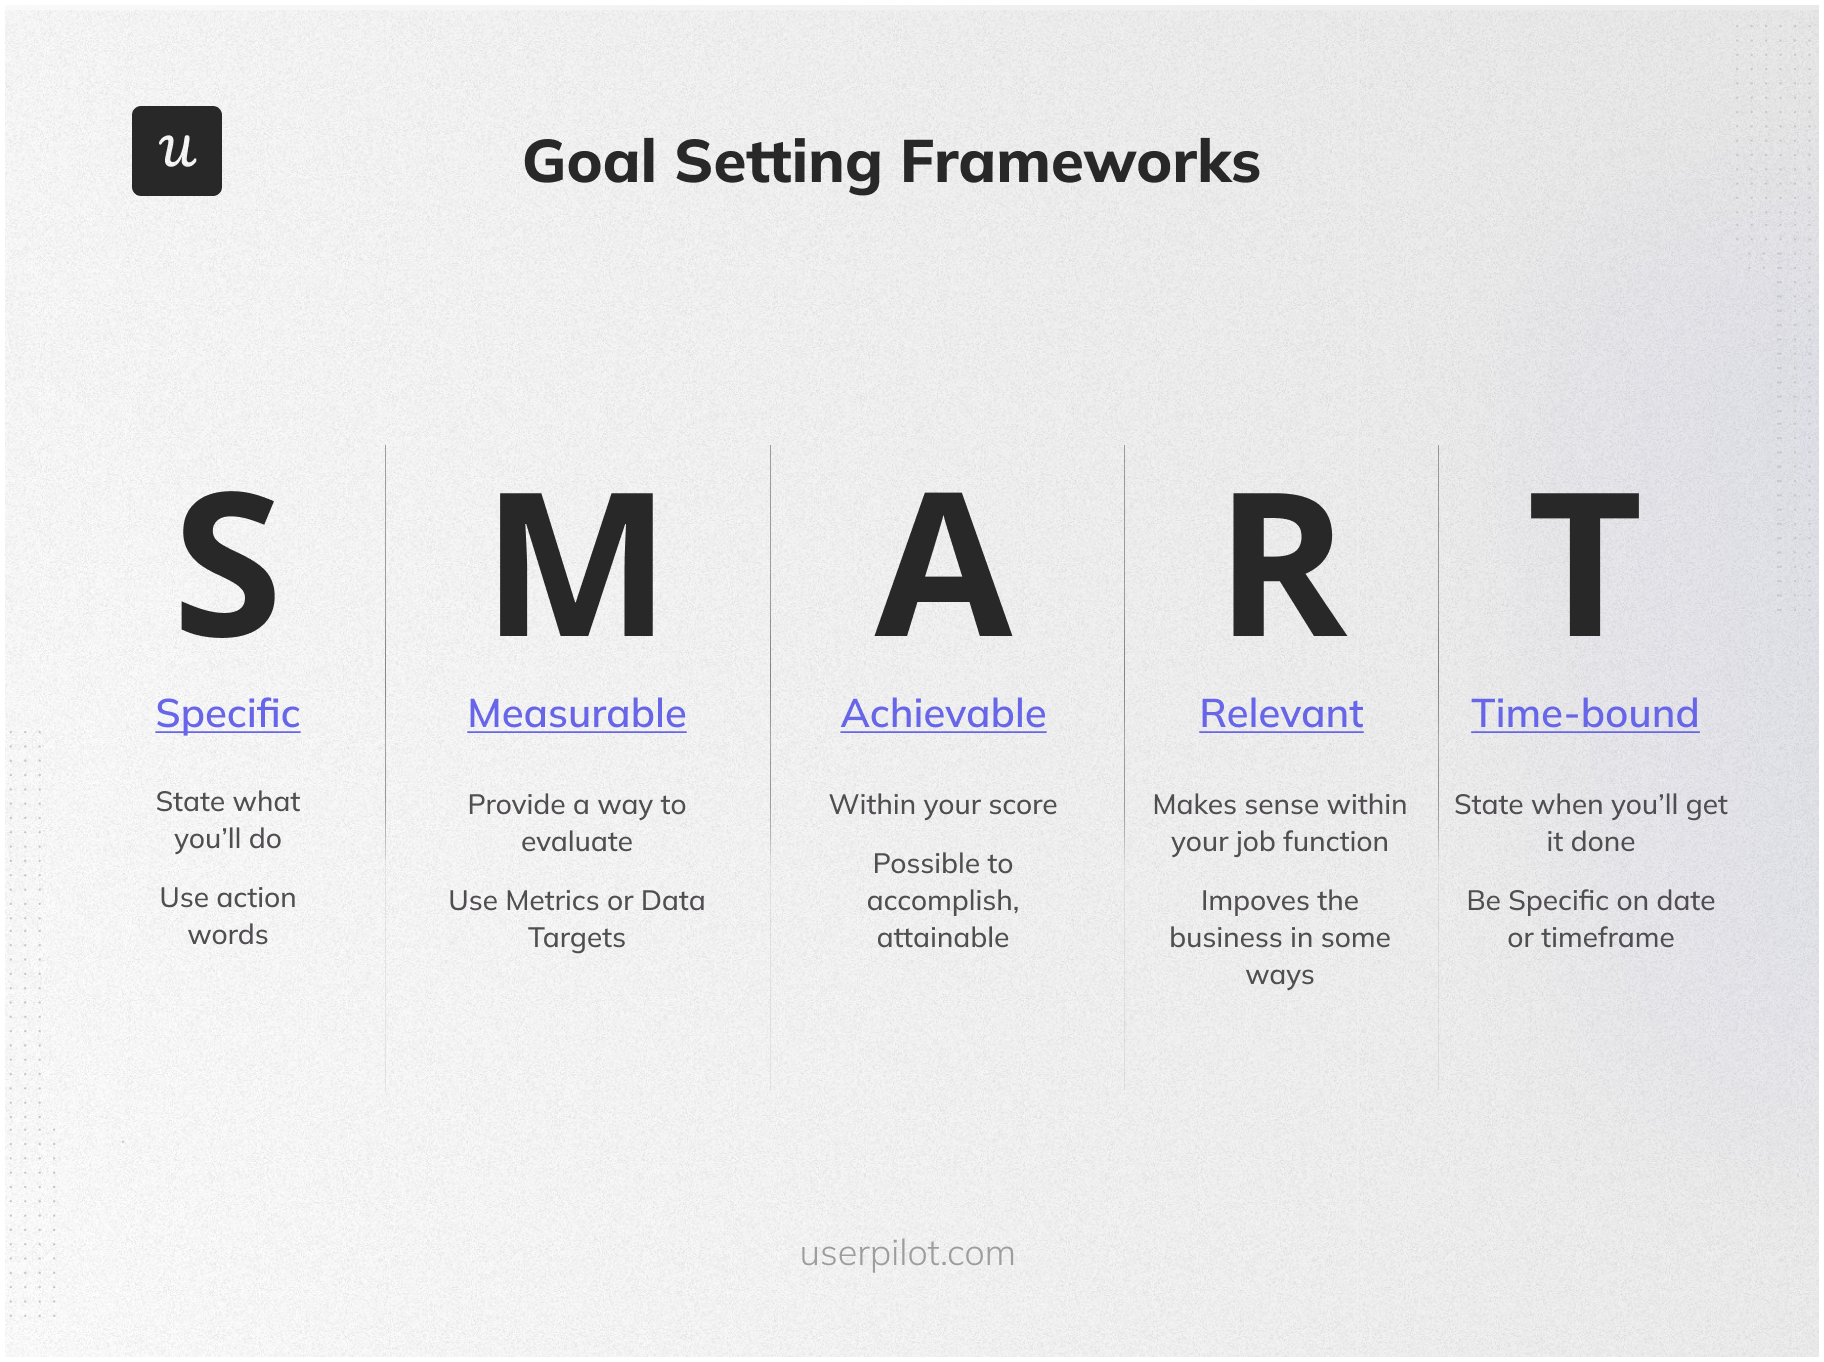
1. Set SMART customer engagement goals
There is no one-size-fits-all in customer engagement. Each team has different goals based on where they are on the growth curve.
So, take some time to think about your most important goals and the results you want to drive.
If your goal is boosting customer loyalty, focus on improving NPS and personalizing customer experiences. If you want to increase the activation rate, you need to concentrate on proactive engagement and onboarding. The list goes on.
2. Select key metrics to focus on
Knowing which metrics you need to track will come from your goal. If your objective falls under the categories considered in the previous section, simply check to see which of the metrics mentioned you should focus more on.
If you’re unsure what to prioritize, it might be best to dig into your customer engagement data and discuss it with other teams.
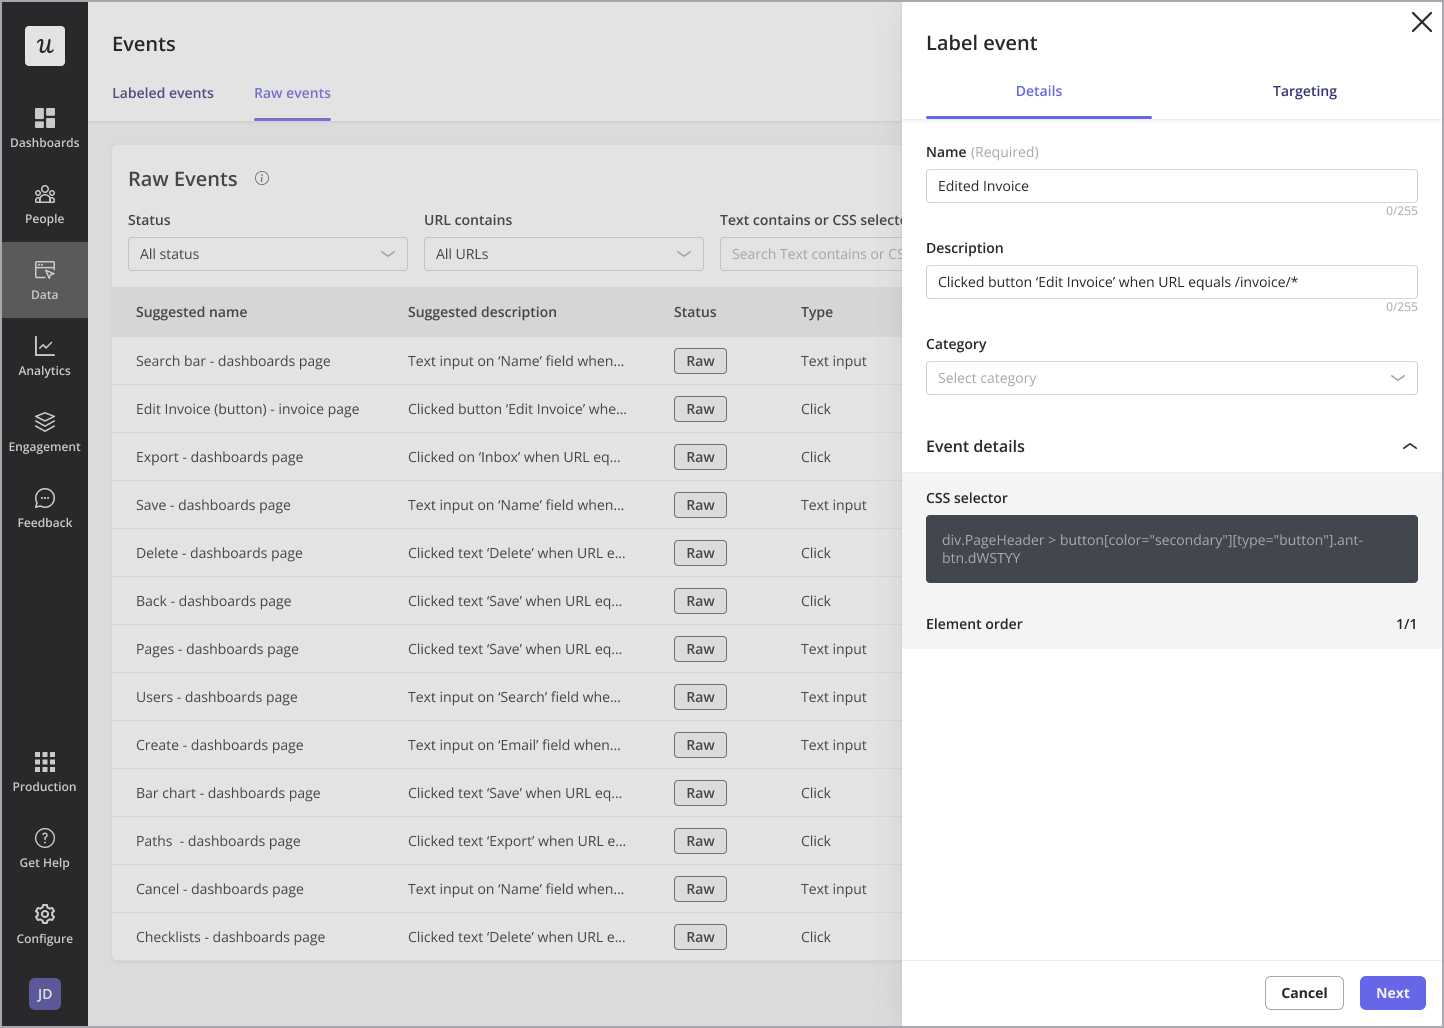
3. Track key customer engagement event data automatically
To effectively measure customer engagement, you need to track key user actions in your product. The best way to do this is through autocapture, which automatically records user interactions without requiring manual event setup.
Autocapture ensures that you don’t miss out on important engagement data, helps in retroactive analysis (since all interactions are recorded), and enables faster iteration based on real user behavior.
Use an analytics tool like Userpilot for this purpose. However, to avoid clutter and confusion, label meaningful events post-capture.
4. Customize your customer engagement dashboard
A well-structured customer engagement dashboard should be tailored to your specific goals, team needs, and business objectives. Instead of using a generic dashboard, customizing it ensures that the right stakeholders can easily access and interpret the most relevant engagement data.
Here are a few best practices to keep in mind when building your first engagement dashboard:
- Break down engagement metrics by user type (e.g., new users vs. returning users, active users vs, inactive users, etc.).
- Choose charts and graphs that make data easy to interpret at a glance.
- Make dashboards easily shareable so product, marketing, and success teams can work together.
5. Pair data with qualitative insights to understand the why behind user behavior
Numbers alone don’t tell the full story, you need qualitative insights to understand the reasons behind user actions. Here are two methods I recommend:
- Watch session recordings: This allows you to see how users navigate your product. By watching these recordings, you can identify friction points (e.g., users hesitating on a step, rage-clicking, or dropping off unexpectedly).
- Collect user feedback: In-app surveys and customer interviews help you understand why users behave the way they do. For example, if engagement drops after onboarding, qualitative feedback might reveal that users find the setup process too complex.
The best customer engagement dashboard tools
The tools below are some of the best in the market. They require no coding and are easy to use:
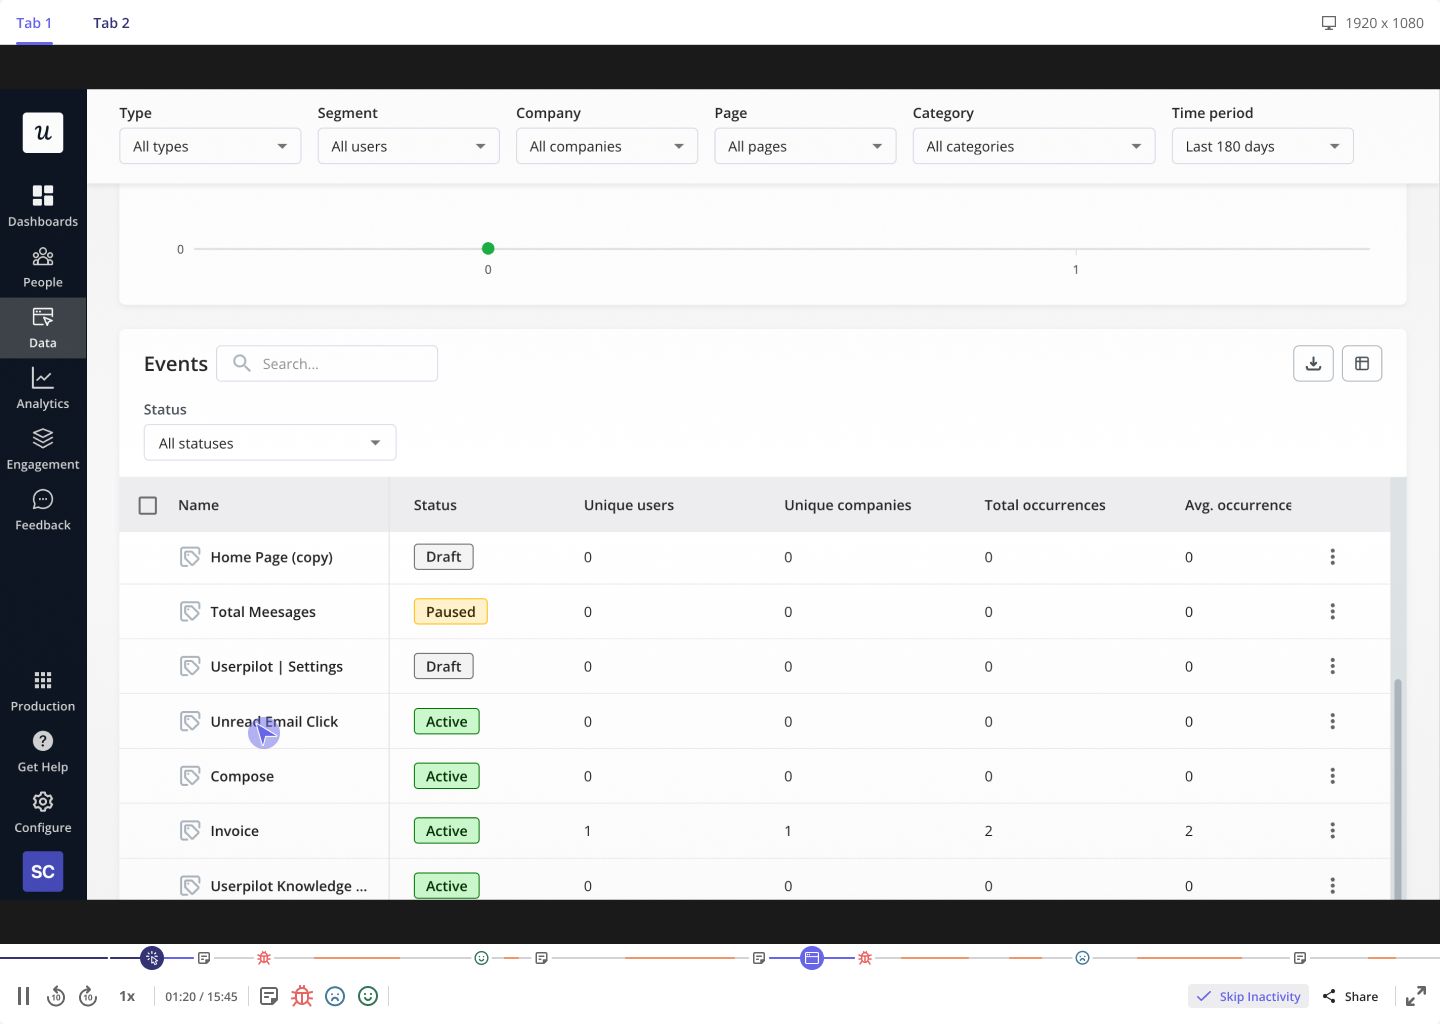
Userpilot
Userpilot makes it easy to track user engagement with its built-in analytics dashboards. You can use pre-designed dashboards for a quick overview or create custom ones tailored to the specific engagement metrics you want to track.
Beyond numbers, Userpilot helps you collect qualitative insights by triggering feedback surveys and watching session recordings. But it doesn’t stop at analysis—its in-app messaging capability lets you act on those insights instantly.
With Userpilot, you’re not just tracking data—you’re using it to improve user experience and drive growth, all within a single platform.
Here’s what Mason, a senior user experience researcher and Userpilot customer, has to say:
Dashboards are crucial for us, and the preloaded ones are particularly useful. We can also add our own custom dashboards, which are valuable for creating organization-specific metrics that provide our teams with insights into feature usage and product engagement. We use these regularly to demonstrate the ROI of our solution.
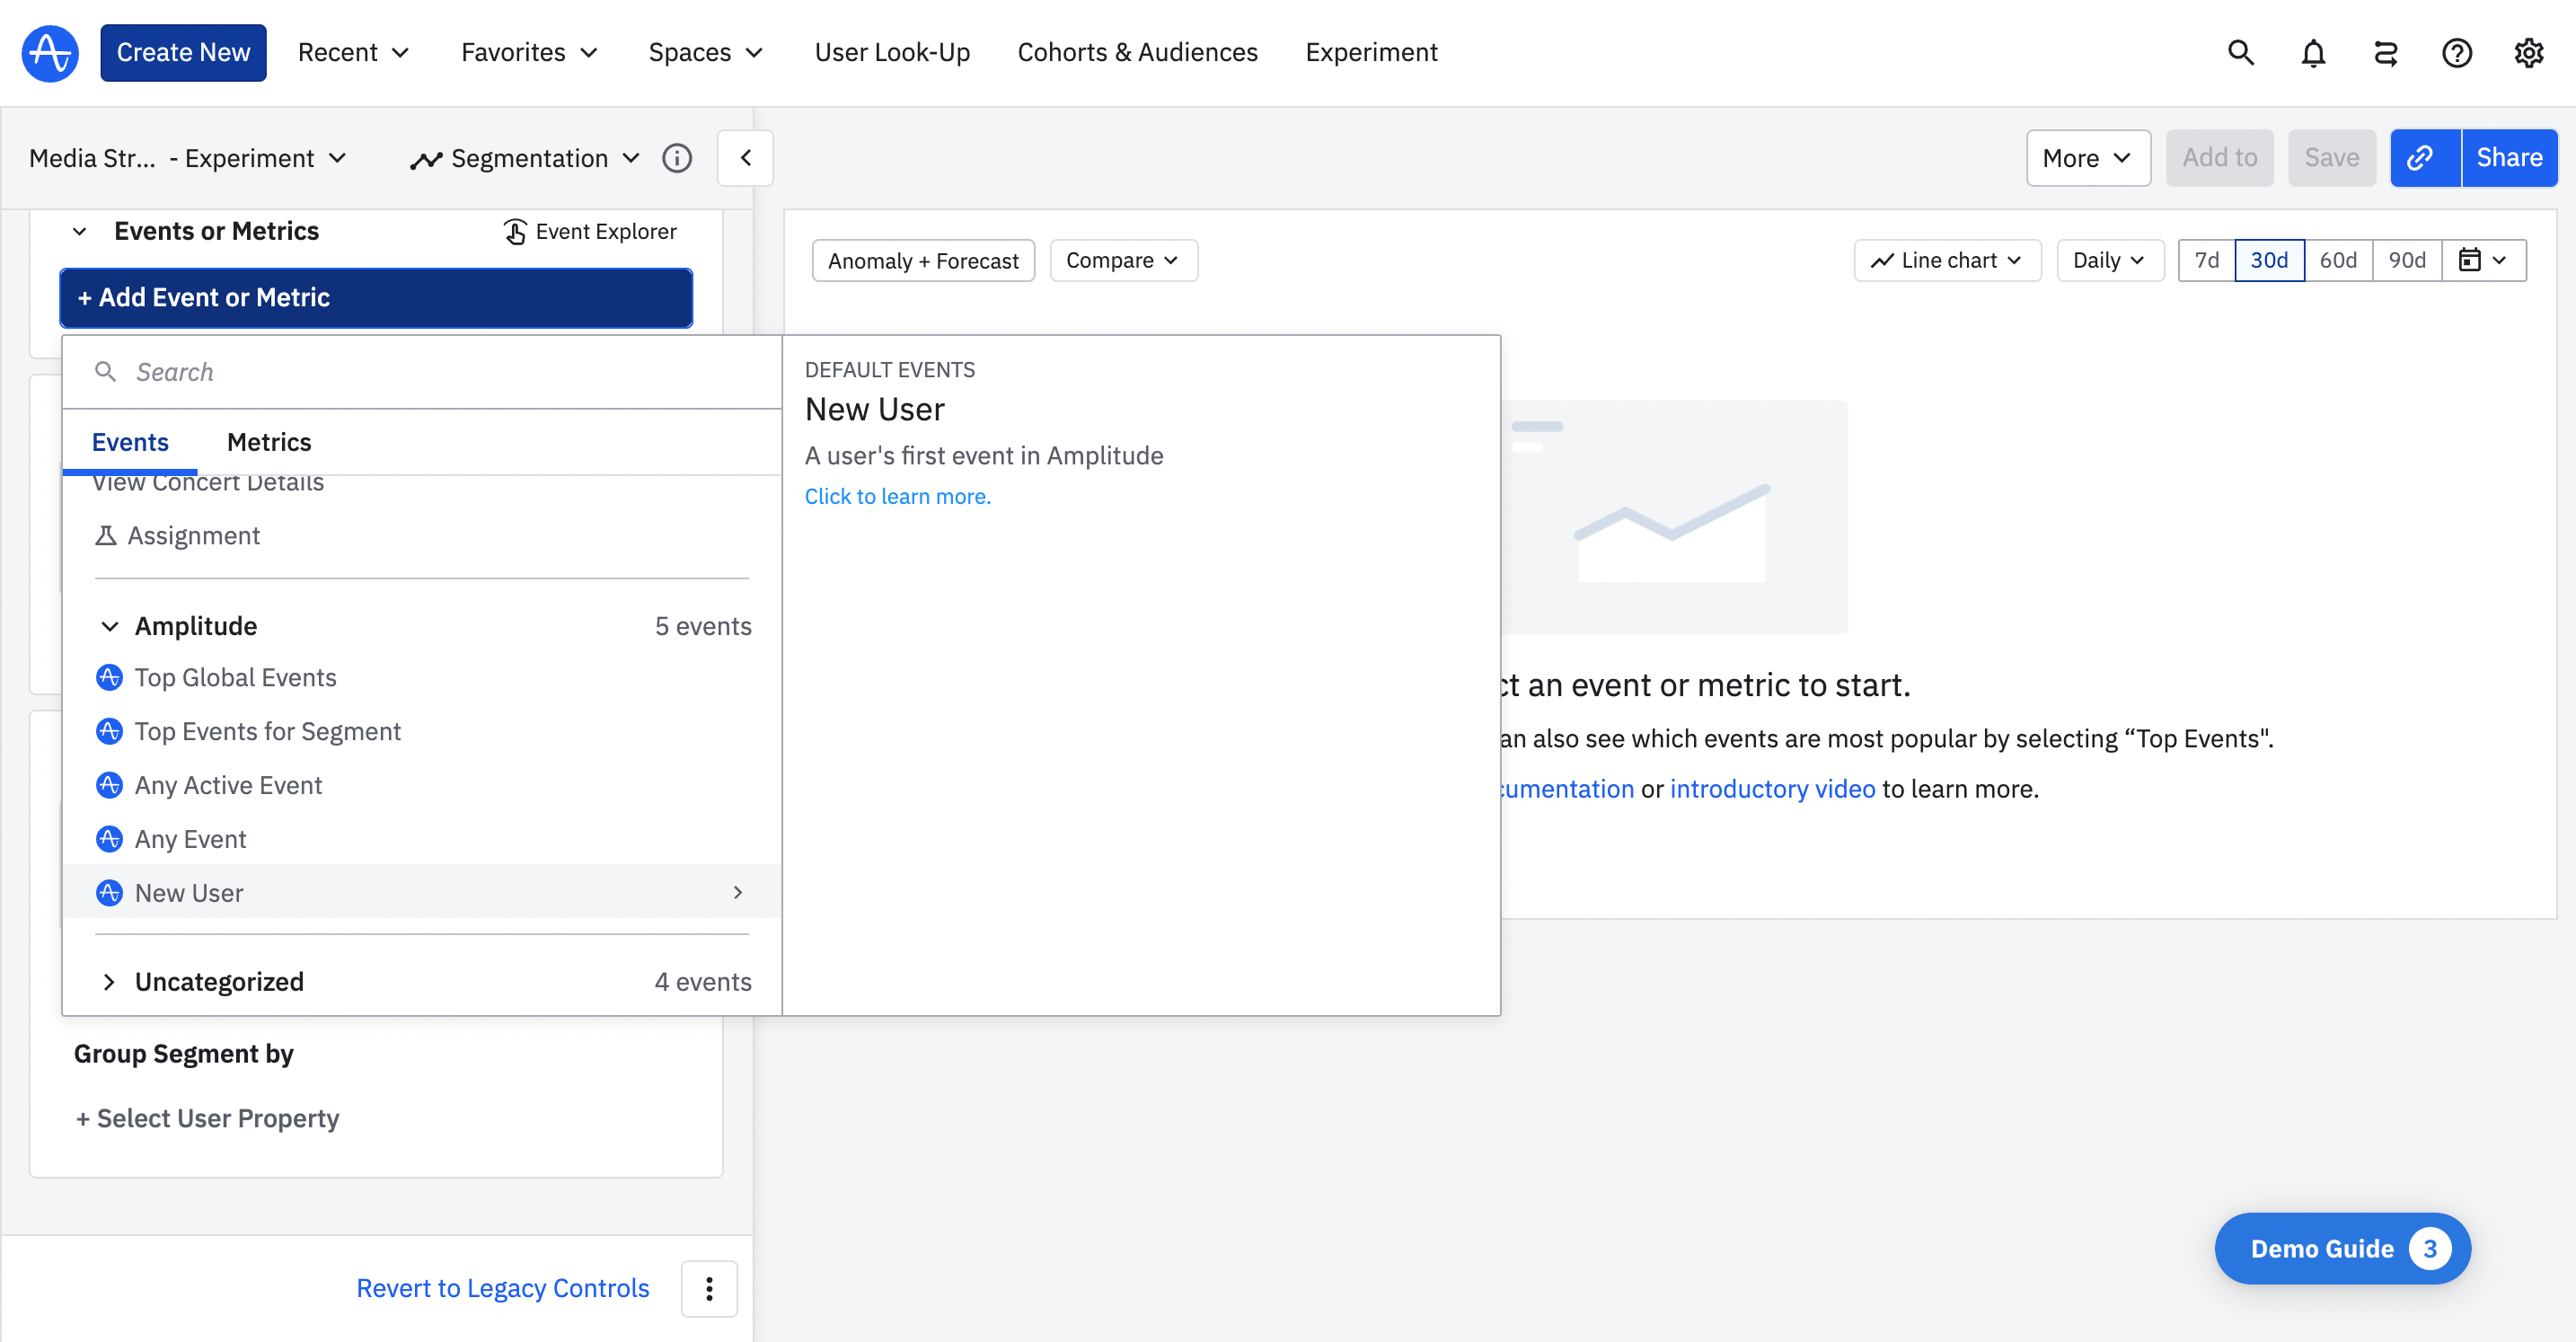
Amplitude
Amplitude is a good tool for in-depth user engagement analysis.
The platform gives you a bird’s eye view of customer behavior and enables you to draw behavioral patterns that can be used to engage customers further.
But unlike Userpilot, Amplitude doesn’t have features for measuring CSAT and actively reducing churn.
Mixpanel
Mixpanel gives a holistic view of user engagement because it records customer interactions on your website and app.
You can use it to keep track of user navigation, button clicks, scrolling, feature engagement, etc. The platform also allows you to stay abreast of the health of individual accounts on your platform. That way, it’s easier to pinpoint inactive and at-risk users.
With Mixpanel dashboards, you can quickly add reports, create unlimited dashboards tailored to different teams, and interact with live data for deeper, real-time insights instead of relying on static snapshots.
Final words
Product leaders are like caregivers: you have to keep checking on your customers to ensure they’re happy.
Having a customer engagement dashboard makes your job easier. You can see all the important data from one place, and you’re better equipped to make data-driven decisions.
Hopefully, this article has shown you important metrics to have in your dashboard, how to create one for yourself, and the best tool for it (hint: Userpilot). Book a Userpilot demo to see the product in action.
About the author